
Stock Market Commentary
A liquidity-driven bounce off support took a small breather last week. The major stock market indices ended the week with a small loss. On the way there, overbought trading conditions ended for a day. As the major indices languished, the stock market dipped in and out of overbought conditions on an intraday basis. This tenuous grip on the overbought threshold seems to make a pullback more imminent. However, I observe so many individual stocks rallying in definitively bullish modes that the case for bearishness simultaneously appears tenuous.
The Stock Market Indices
The S&P 500 (SPY) gapped down slightly to start the week and drifted its way to another test of uptrending support at the 20-day moving average (DMA). The index ended the week with a 0.7% loss.
Like the S&P 500, the NASDAQ (COMPQX) gapped down to start the week. However, the tech-laden index drifted back into the gap before ending the week about where it started.
Yet again, small caps traded differently from the S&P 500 and the NASDAQ. This time around IWM out-performed. IWM opened the week with a gap down but rallied to close the day flat. The index hit two new all-time highs before Friday’s 1.5% loss.
The Financial Select Sector SPDR Fund (XLF) rallied enough off its Monday gap down to close the day with a 0.3% gain. XLF rallied into Friday’s group of earnings reports from major banks. However, the results disappointed and took XLF back to where it closed on Monday. Like IWM, XLF continues to trade well above uptrending 20DMA support.
Stock Market Volatility
The volatility index (VIX) mounted a 2-day rally off the low for the week. Once again, the low 20s looks like support and a launchpad for the next surge in the VIX.
The Short-Term Trading Call: Dealing with Tenuous Conditions
- AT40 = 71.6% of stocks are trading above their respective 40-day moving averages (day #4 of the overbought period)
- AT200 = 88.0% of stocks are trading above their respective 200-day moving averages (TradingView’s calculation).
- Short-term Trading Call: bearish
AT40 (T2108), the percentage of stocks trading above their respective 40DMAs, started the week with a marginal break below overbought conditions at 69.6%. After many pivots around the 70% overbought threshold, my favorite technical indicator managed to close the week at 71.6%. This tenuous trading in and out of overbought conditions takes me back to expectations for an imminent pullback. As a result, I remain short-term bearish on the stock market.
Despite my bearishness, I cannot help seeing many bullish setups in a number of stocks. As I mentioned in my last Above the 40 post, I decided to make selective bullish trades. After seeing the consistent and convincing success in the bullish trades versus the lackluster results of bearish trades, I am left with a tenuous bearishness. The sellers have a LOT to prove in this stock market. The S&P 500, the NASDAQ, IWM, and XLF are all floating relatively easily above uptrending 20DMA support. Even after those supports give way, uptrending 50DMA support appears even more ready to keep the rally going.
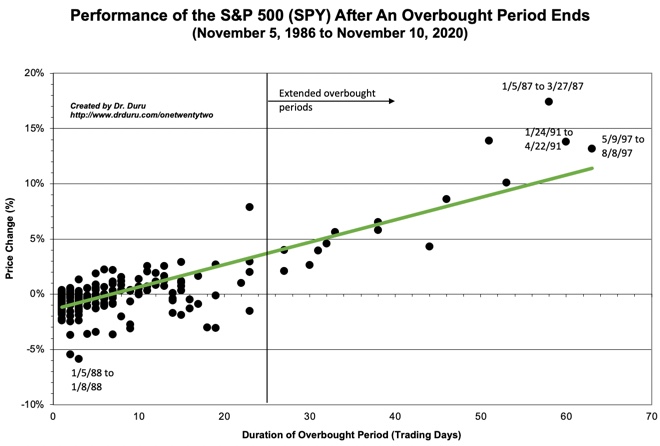
This tenuous overbought period is 4 days old, yet the S&P 500 is languishing with a 0.8% loss for the period. The graph below shows that this performance is consistent with an overbought period that ended right at 4 days. An end to overbought trading this week would create another under-performing overbought period.
Message from the Currency Market
The Australian dollar versus the Japanese yen (AUD/JPY) left a bearish stain on the stock market. The indicative currency pair dropped 0.9% with the majority of its loss occurring before the open of trading in the U.S. Given my (tenuous) bearishness, I am watching AUDJPY closely for follow-through selling pressure. Such a confirmation will incrementally embolden the bearish side of my ledger.
Stock Chart Reviews – Below the 50DMA
Advanced Micro Devices (AMD)
While Intel (INTC) soared, semiconductor chip maker Advanced Micro Devices (AMD) stalled. Now, with a 2.8% loss that created a 50DMA breakdown, AMD confirmed a double-top at all-time highs. AMD re-establishes bullishness on a new all-time high.
Facebook (FB)
The squeeze on social media intensified with the comprehensive shutdowns of accounts including Donald Trump and groups/individuals associated with assorted conspiracy theories, election misinformation, and domestic threats. Almost everyone has a reason to hate social media companies over issues of censorship, concentration and abuse of power, and the facilitation of hate speech and violence. Social media companies live true no-win lives.
Small businesses have come to rely heavily on marketing through Facebook. This dependence helped shield Facebook from the pressures of boycotts last summer over hate speech on the platform. FB churned for two months until July 30th earnings refreshed excitement in the stock.
However, investors and traders are back to selling Facebook (FB) on the bad news. FB failed at 50DMA resistance at the end of last year and trended downward from there. A 2.4% loss took FB through 200DMA support and into the post-earnings gap up from July 31st. I faded the rebound on Friday with weekly $240 put options. Follow-through buying to start the week of trading will suggest the selling pressure is over for now.
Twitter (TWTR)
My reaction to the pressure on Twitter (TWTR) differs from Facebook. I am trying to stay bullish on Twitter over the long-term and consider turbulent times like these buying opportunities. TWTR gapped down to start the week with a 6.4% loss. I observed a surge of weekly call volume and decided to open a covered call position. Sure enough, those calls expired with zero value. I am holding shares at a small loss and facing the prospect of an eventual test of 200DMA support. Note that my bullishness is greatly tempered given the growing dysfunction in how this American democracy handles social media.
A recent blog post by Howard Lindzon, the founder of StockTwits, forced me to rethink my bullishness on Twitter. Here is a key quote Lindzon included from The Pomp Newsletter:
“We will see decentralized websites, decentralized mobile apps, decentralized social networks, and much more. The risk of a centralized organization imposing their will, regardless of the validity of that decision, has become too great to ignore now. It was previously believed that decentralization was only a fascination of those who were paranoid, but now we are seeing that it is becoming a business imperative at a breakneck speed.
…These renewed focuses will leverage technology to equalize power on the internet. The days of large centralized companies overseeing their dictatorships without fear of being held accountable are over. The people can’t change the status quo, but they can vote with their feet and start using new technology stacks.
Almost on cue, Twitter founder and CEO Jack Dorsey indicated he remains fully aware of the imbalance of power on the internet. Dorsey acknowledged that companies like Twitter have too much control and authority. Twitter is even working on the kind of alternative technology mentioned in Pomp:
Needless to say, my current position in TWTR may be one of my last! “Bluesky” will undoubtedly cost Twitter a lot of money with little to no revenues in return for quite some time (if ever).
Wix.com Ltd (WIX)
Website services company Wix.com Ltd (WIX) enjoyed a breathtaking run-up out of last year’s stock market crash. Traders and investors were enamored with all things digital as societies hunkered down indoors with an assortment of digital communication devices. WIX topped out following its August 6th earnings. The stock has gone nowhere ever since, just drifting around a 50DMA pivot. The recent trade to the bottom of this range also hit key 200DMA support. WIX is a short on a close below the 200DMA.
Zoom Video Communications (ZM)
The run-up in video conferencing platform Zoom Communications (ZM) topped out on October 19th. The latest rebound in the middle of the subsequent downtrend came on the heels of the announcement of a massive $1.5B stock offering. The previous week, I wrote about positioning for a big move up or down. The setup fizzled that week but exploded the following week. I almost missed the opportunity except I stubbornly hit the reset button on the trade.
Stock Chart Reviews – Above the 50DMA
fuboTV Inc. (FUBO)
Last week, I wrote about the bear case for fuboTV Inc. (FUBO). Perhaps predictably, FUBO never confirmed its 50DMA breakdown. Subsequent to my post, FUBO traded back down to 50DMA support and then soared the next day for a 34.2% gain. In a sign of the manic times for financial markets, an acquisition seemed to drive the fresh excitement for FUBO. From the company’s website:
“fuboTV Inc…announced today it has executed a binding letter of intent to acquire sports betting and interactive gaming company Vigtory, and expects to launch a sportsbook before the end of the year…
fuboTV intends to leverage Vigtory’s sportsbook platform and digital gaming assets, and its consumer-driven betting technology, to develop a frictionless betting experience for fubo’s customers. Additionally, Vigtory has been in discussions for market access agreements in the eastern part of the United States and currently has a deal secured in Iowa through Casino Queen.
Admittedly, as a football fan, I am also excited about this news! Suddenly, FUBO is a buy until/unless 50DMA support gives way. Note FUBO is currently struggling to follow-through on the fresh buying momentum.
Martin Marietta Materials (MLM)
I regrettably missed the last gap up on Martin Marietta Materials (MLM). I bought into the current pullback and plan to just sit on the position going forward.
Vulcan Materials (VMC)
With the bullish conditions building for materials companies, I also have my eye on Vulcan Materials (VMC). I will make an entry on an extended pullback. Otherwise, I will remain content with my MLM shares.
General Motors Company (GM)
An upside resolution to a Bollinger Band (BB) squeeze reignited the bullish momentum for General Motors Company (GM). The stock remains a buy on the dips. My shares were called away on Friday as part of a covered call position – I positioned myself for an extended period of churn and not a fresh breakout!
Invesco Solar ETF (TAN)
I have not yet bought back into First Solar (FSLR). However, a big buy-the-dip opportunity in solar could be unfolding. Invesco Solar ETF (TAN) pulled back this week and ended the week with a key test of uptrending 20DMA support. TAN lost 7.2% and filled the gap up from January 6th when the promise of fresh liquidity for these kinds of investments crowded out the shock over the insurrection in Washington D.C. I am considering securing profits in my TAN position – my bearishness in the stock market is fighting through its tenuous state to scream at me to sell.
Shake Shack Inc (SHAK)
Seeing burger joint Shake Shack (SHAK) is like staring at the face of market bullishness. SHAK notched a new all-time high last week on the way to a 21.9% gain for the week. The excitement launched with Shake Shack increasing guidance for Q4 earnings. The company is also bullish on this year’s prospects:
“Looking ahead, we are targeting an acceleration of new Shack development and expect to open a total of 35 to 40 domestic Company-operated Shacks in 2021, with timing more towards the back half of the year due to COVID related volatility. We are planning to step-up unit growth for fiscal 2022 to open a total of 45 to 50 new domestic Company-operated Shacks. These openings are expected to incorporate a version of our new Shack Track digital pre-ordering and pick-up capability and we also plan to build our first drive-thru Shack later in 2021.”
SPDR S&P Retail ETF (XRT)
My bearishness has to be tenuous when retail stocks show off their bullishness. The SPDR S&P Retail ETF (XRT) is already up 11.9% for the young year. XRT bounced perfectly and sharply off uptrending 20DMA support.
U.S. Concrete (USCR)
U.S. Concrete (USCR) is up 27.8% since January 5th. The promise of massive infrastructure spending launched USCR skyward. USCR tends to reverse big gains, so I am on alert to scoop up shares on a pullback.
Be careful out there!
Footnotes
“Above the 40” (AT40) uses the percentage of stocks trading above their respective 40-day moving averages (DMAs) to measure breadth in he stock market. Breadth indicates the distribution of participation in a rally or sell-off. As a result, AT40 can identify extremes in market sentiment that are likely to reverse. Above the 40 is my alternative name for “T2108” which was created by Worden. Learn more about T2108 on my T2108 Resource Page. AT200, or T2107, measures the percentage of stocks trading above their respective 200DMAs.
Active AT40 (T2108) periods: Day #66 over 20%, Day #50 above 30%, Day #49 over 40%, Day #48 over 50%, Day #47 over 60%, Day #4 over 70% (day #4 overbought)


Red line: Overbought threshold (70%); Blue line: Oversold threshold (20%). Source: FreestockCharts
Source for charts unless otherwise noted: TradingView.com
Full disclosure: long UVXY shares and calls, long SPY put spread, short AUD/JPY, long ZM put spread, long TWTR, long FB puts, long TAN
FOLLOW Dr. Duru’s commentary on financial markets via StockTwits, Twitter, and even Instagram!
*Charting notes: FreeStockCharts stock prices are not adjusted for dividends. TradingView.com charts for currencies use Tokyo time as the start of the forex trading day.