
AT40 = 9.4% of stocks are trading above their respective 40-day moving averages (DMAs) (8th oversold day)
AT200 = 23.2% of stocks are trading above their respective 200DMAs
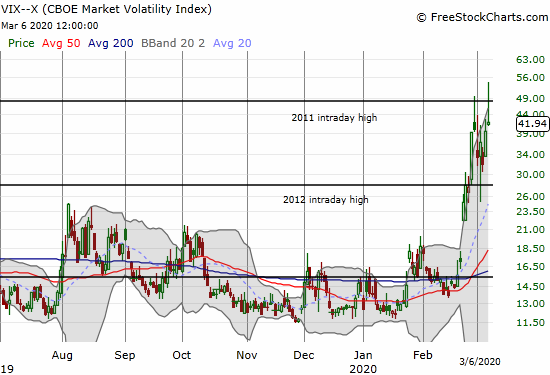
VIX = 41.9
Short-term Trading Call: bullish
Stock Market Commentary
The Shake and Bake bottom barely held as support last week.
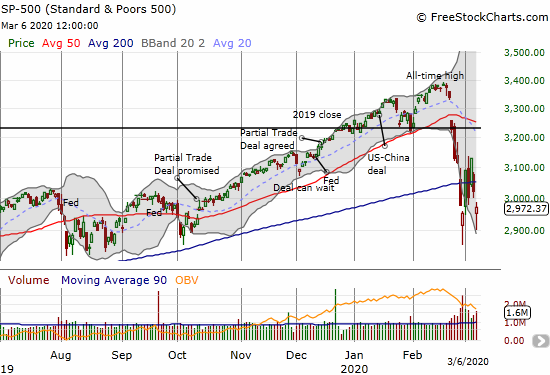
It was a week of dramatic ups and downs that ended essentially in a stalemate relative to the wide trading range on the week. The day-to-day felt momentous, but the end result was underwhelming. The S&P 500 (SPY) ended the week with an ugly 0.6% gain. I count that as a small victory amid a minefield of risks and dangers for the stock market.
Oversold
AT40 (T2108), the percentage of stocks trading above their respective 40-day moving averages (DMAs), has churned in oversold territory, below 20%, for 8 trading days. Friday’s return to single digits preserved the low of this oversold period. If the coming week makes any kind of progress, the higher low will look the beginnings of a sustainable bottom.
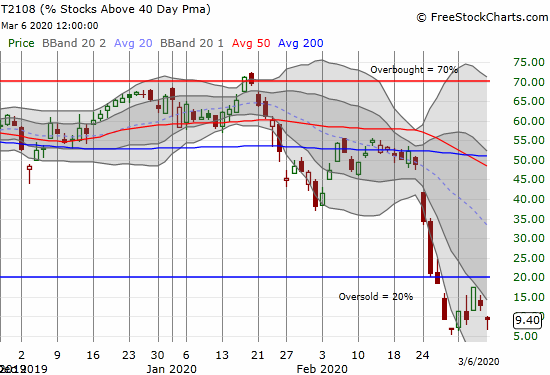
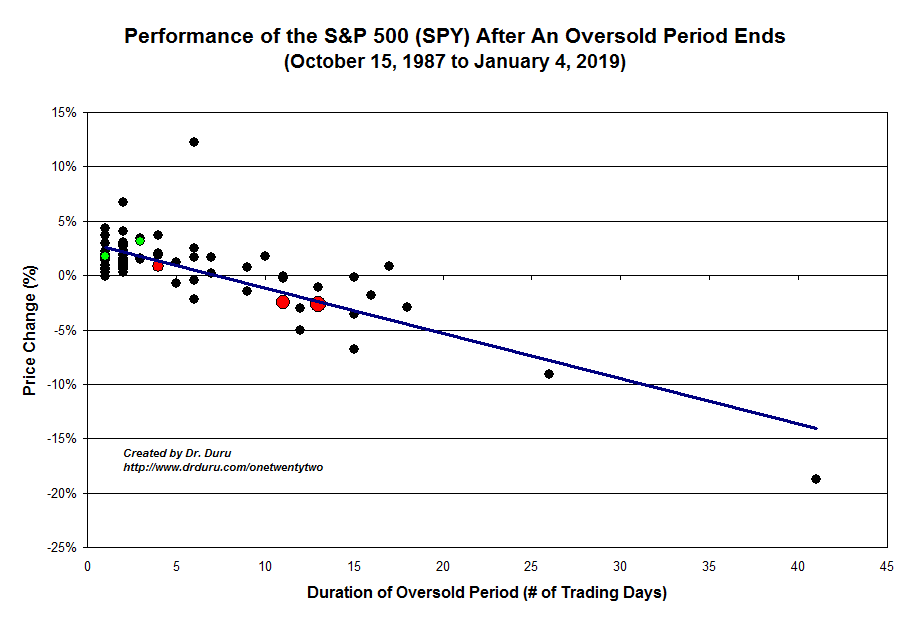
At 8 days in duration, this oversold period is already reaching historic proportions. Since 1987, there are only 17 more oversold periods that have lasted longer than the current one. The historic nature of this oversold period means that it challenges the AT40 trading model, but I remain prepared. Buying into the depths of this oversold period can still be quite profitable when the oversold period finally ends. The key wildcard is whether the length of the oversold period drags the market into a bear market or into the beginnings of a bull market recovery.
The Stock Market Indices
The S&P 500 is down 4.6% since the oversold period began on February 26, 2020. Friday’s higher low gives some hope that a bottom is slowly but surely forming. The double confirmed 200DMA breakdowns suggest that bearish action is unfolding, but my best guess going forward is an extended trading range for the stock market. As I have stated before, a breach of the intraday low of this oversold period will mark a swing in opinion about the health of the market: more buyers will turn into sellers and fears will widen into the drudgery of a bear market.
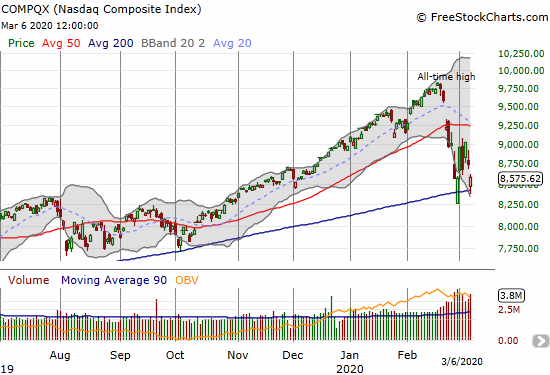
The NASDAQ (COMPQX) is doing its part to give the appearance of market support. For the second time in a week, the NASDAQ survived a test of its uptrending 200DMA. If the NASDAQ gives up this support during the current oversold period, I will be bracing for a truly historic and extended oversold period (meaning bears are going to go to town on the market, especially fading rallies back to 200DMA resistance).
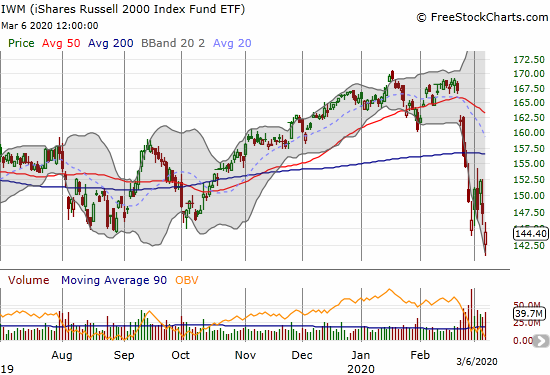
When the S&P 500 was still clinging to a gain for the oversold period, the iShares Russell 2000 Index Fund ETF (IWM) was lagging with a negative performance. Friday’s new low for the oversold period plants the index of small caps into bearish territory confirmed by the 200DMA breakdown. Note well that IWM broke through critical support levels from 2019 and closed at a-14 month low.
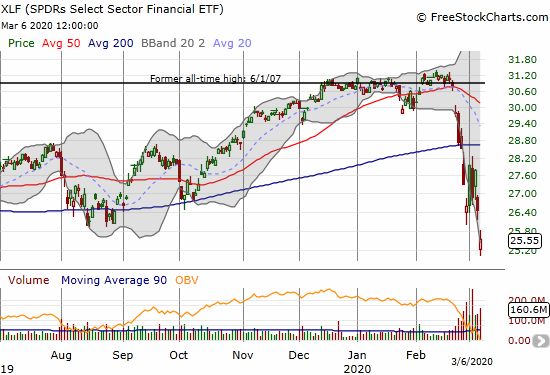
After observing the lagging behavior of the SPDRS Select Sector Financial ETF (XLF), I decided to keep its stocks off my shopping list. Friday’s 3.4% loss and near 52-week low confirmed that decision.
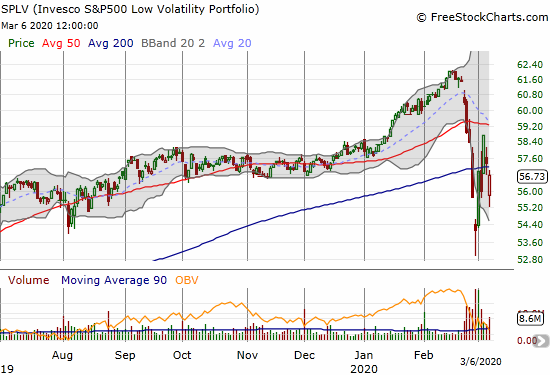
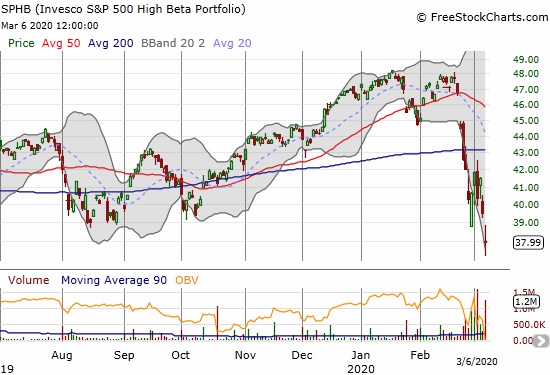
The latest divergence between the Invesco S&P 500 Low Volatility ETF (SPLV) and the Invesco S&P 500 High Beta ETF (SPHB) gave me fresh reason for concern. SPLV lost 1.1% and almost recovered to its 200DMA while SPHB lost 3.9% and closed at a 14-month low. This separation is bearish for risk-taking and works against my general bullishness for the oversold period. I am currently looking into more detailed historical data to see whether the relationships I am assuming between changes in SPLV, SPHB, and SPY hold up. I will post on my findings in the coming week or so.
Volatility
The volatility index (VIX) just barely closed at a new high for this oversold period. More importantly, the VIX faded from a new intraday high. This fade was even sharper than the previous week’s and supports my bullish expectations going into this next week of oversold struggles. I even shorted a small amount of shares in ProShares Ultra VIX Short-Term Futures (UVXY) in preparation for an imminent volatility implosion. At the same time, I had to watch a tranche of UVXY puts and a SVXY call option expire worthless.
I duly noted that while the VIX closed near flat over the week, UVXY GAINED 45.9% and VIXY gained 29.1%. So I think there is a lot of room to the downside in the long volatility products whenever fear finally subsides (and it will at some point!).
The Short-Term Trading Call
In my previous Above the 40 post I noted how oversold conditions provide reason enough to buy stocks. The search for explanations for any given day’s rally or sell-off are unproductive. So while I do check in on the headlines and latest development for coronavirus and the related fears and panics, I do not base my trading strategy on trying to map the trajectories of the headlines. I am sticking to the AT40 trading strategy.
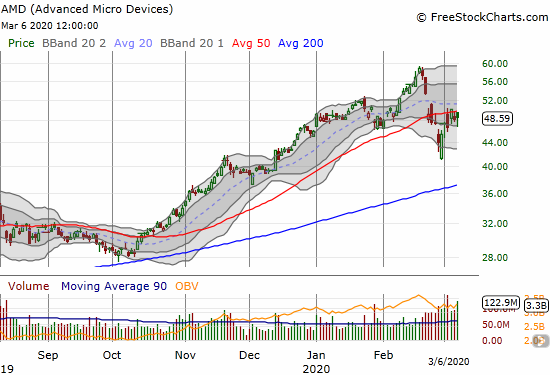
Based on my success early in the week, I took an out-sized risk by holding a few major options positions going into Friday. I “just” needed a percent or two in the underlyings. I blithely assumed the S&P 500 would hold on to a pivot around its 200DMA. Instead, the Friday gap down and subsequent selling wiped my speculative positions away. Advanced Micro Devices (AMD) was the smallest but one of the most tantalizing. The company provided guidance Thursday evening that the flew contrary to coronavirus pessimism. The stock ended the after hours session at $51, and I looked forward to perhaps scraping out a small gain on my $50 strike call expiring Friday. Instead, the stock buckled under the market’s pressure and gapped down Friday morning (see chart below). I was not able to salvage anything for that call option.
These are the experiences that test the resolve of the AT40 trading strategy. I have focused on a bullish bias as a way to stay disciplined on the strategy and to resist chasing stocks down as fear and panic get stretched to extremes. This coming week will sorely test such resolve, especially if the recent bottom gives way! I am even less backstopped by put options than a week ago. Moreover, I have moved cash and bonds in long-term accounts into stocks.
{Given the steep market sell-off, I divided my stock charts by relative 200DMA positioning instead of using the 50DMA}
Stock Chart Reviews – Below the 200DMA
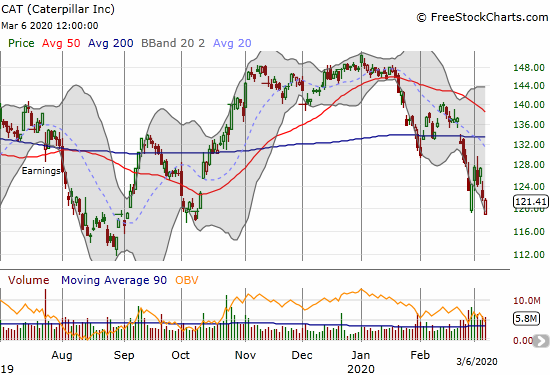
Caterpillar (CAT)
Caterpillar (CAT) held onto its recent low. I flipped put options on CAT twice during the week. I did not fade it on Friday because the rally did not go high enough. A break of the lows puts the $112 level into play.
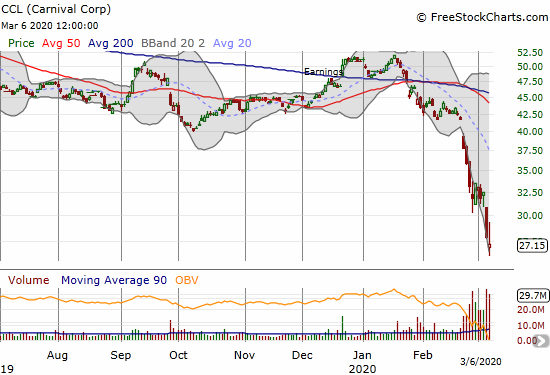
Carnival Corp (CCL)
Carnival Corp (CCL) has been one of my most difficult stocks to watch. I started buying just ahead of the coronavirus panic on the long-term thesis of the growing popularity of cruises. In recent years, I took my first cruise and was sold on their overall value and family-friendly packaging. Yet, for this short-term , travel-related stocks like CCL are obvious shorts. CCL lost 34.9% in two weeks. Yet, I have not shorted any of these stocks partially because of my existing long – just one of those cases where the psychology of trading can break down and work against me.
This recent warning from the U.S. State department speaks volumes:
“U.S. citizens, particularly travelers with underlying health conditions, should not travel by cruise ship. CDC notes increased risk of infection of COVID-19 in a cruise ship environment. In order to curb the spread of COVID-19, many countries have implemented strict screening procedures that have denied port entry rights to ships and prevented passengers from disembarking. In some cases, local authorities have permitted disembarkation but subjected passengers to local quarantine procedures. While the U.S. government has evacuated some cruise ship passengers in recent weeks, repatriation flights should not be relied upon as an option for U.S. citizens under the potential risk of quarantine by local authorities.
This is a fluid situation. CDC notes that older adults and travelers with underlying health issues should avoid situations that put them at increased risk for more severe disease. This entails avoiding crowded places, avoiding non-essential travel such as long plane trips, and especially avoiding embarking on cruise ships. Passengers with plans to travel by cruise ship should contact their cruise line companies directly for further information and continue to monitor the Travel.state.gov website and see the latest information from the CDC…”
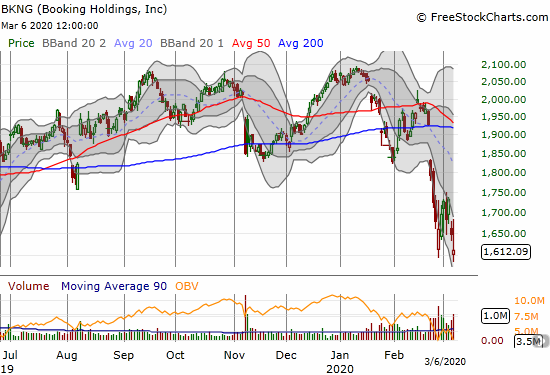
Booking Holdings (BKNG)
Speaking of travel, Booking Holdings (BKNG) lost 2.2% after a strong fade from intraday highs. With BKNG’s significant European business, I have to believe BKNG is still trading far higher than it should.
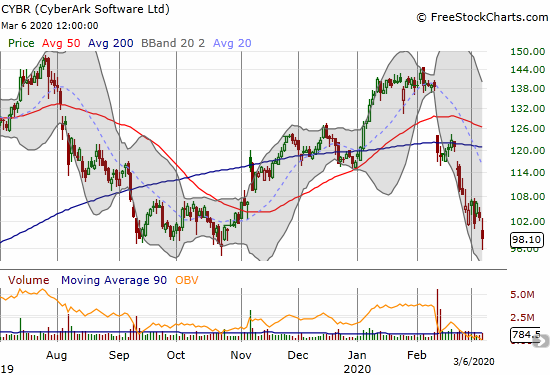
CyberArk Software (CYBR)
I keep spying CyberArk (CYBR) for a buy during this sell-off. CYBR is a stock I bought and sold much lower, and I long regret ever taking profits. I want to get back in and stay in for the long-term play on the need for cybersecurity. I will likely start buying this week as the stock plumbs 2019 lows.
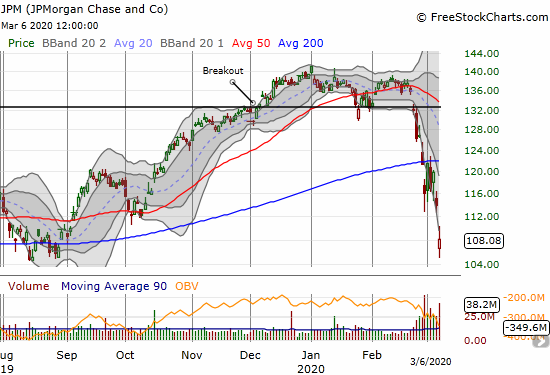
JPMorgan Chase (JPM)
JPMorgan Chase (JPM) is a leading stock in XLF. JPM lost 5.2% and tested support from the August, 2019 low. JPM is the only financial I will consider touching as a speculation on a rebound to 200DMA resistance, a 13% rebound from current levels. Ideal plays for me are long an April $110/120 call spread, short an April $120/$110 put spread, or short an April $120/$105 put spread. With current levels of elevated volatility and an earnings report on April 14th, I think there is less to lose and more to gain by selling the put spreads. I JPM gives up to sellers again, I will be quick to roll into XLF put options to create a pairs trade.
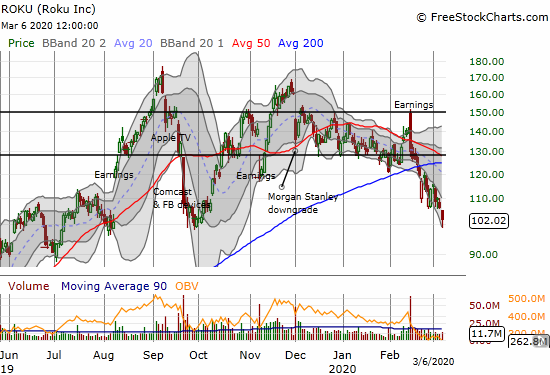
Roku (ROKU)
Roku (ROKU) made a new low for this selling cycle. The stock perfectly rebounded off $100 (of course). While ROKU looks like an obvious “stay-at-home” play to contend with coronavirus fears, the stock is so incredibly expensive, it remains a high-risk, speculative buy (Yahoo Finance reports ROKU still at 11.1 price/sales and 18.7 price/book with no profits in sight). While the market is roiling, ROKU is a short on a fade or a breakdown below $100.
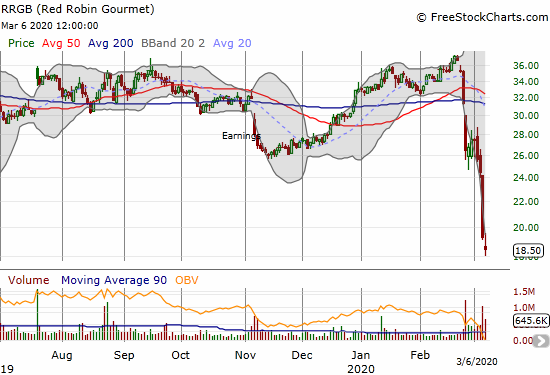
Red Robin Gourmet (RRGB)
Red Robin Gourmet (RRGB) got clobbered on Thursday for a 21.2% loss on no news that I could find except speculations on coronavirus fears. I am so grateful I targeted RRGB as of many profitable stocks to close out while I was bearish on the stock market.
I started buying right back into the stock on Thursday. I continue to think RRGB is under-valued, and this sell-off makes it extremely under-valued. And yes, I am biased because I LOVE the turkey burgers, and almost always see plenty of patrons in local restaurants. RRGB is now trading at a paltry 0.3 price/sales and 1.0 price/book. The market must be trying to get ahead of even worse earnings reports thanks to the coronavirus. These valuations make RRGB an even better take-out target. I will be buying RRGB aggressively going forward.
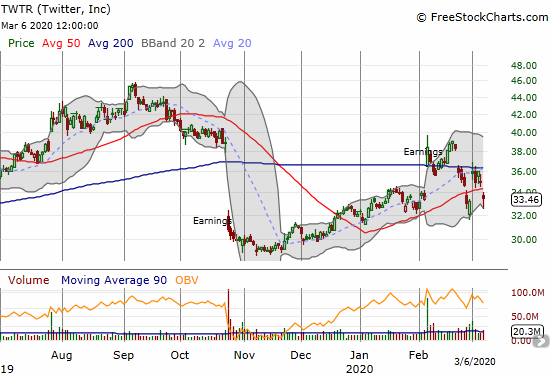
Twitter (TWTR)
I did not think Twitter (TWTR) had more upside in it after earnings, and I was correct. While I missed selling calls against my shares at the post-earnings high, the subsequent surge in volatility allowed me to sell calls at a good premium although the stock was at a lower price.
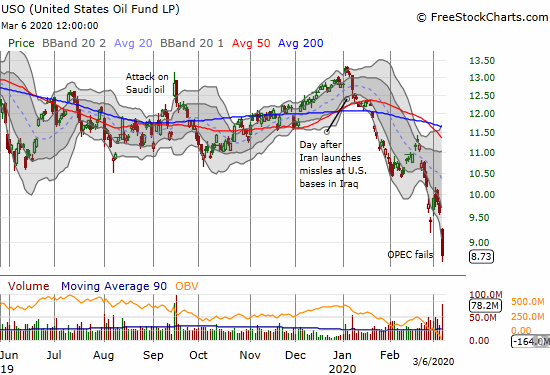
United States Oil Fund LP (USO)
If I had not identified oil as a contrarian play for the year, I might have seen it for the perfect short that it has become. OPEC (Saudi Arabia) and Russia failed to agree to production cuts last week, and oil got crushed anew. The United States Oil Fund LP (USO) lost a whopping 9.2% on Friday and hit a 4-year low. As a contrarian play, these levels would be yet another good place to take a swing. I have learned my lesson and consider oil-related plays no touch until I can identify a potential upside catalyst…or even see some technical signs of life. The outlook remains bearish as Saudi Arabia is clapping back at Russia with aggressive price cuts. This dispute will of course have wide repercussions for oil-dependent nations AND U.S. oil producers who also keep borrowing money and pumping more oil.
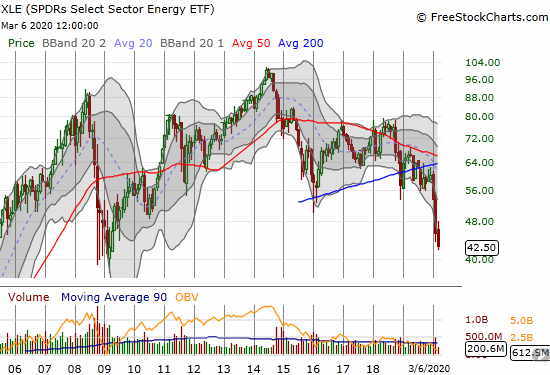
SPDRs Select Sector Energy ETF (XLE)
I pulled back to a monthly chart to get a better look at the carnage in SPDRs Select Sector Energy ETF (XLE). XLE was a perfect short after falling below the 200-monthly moving average line that formed the bottom part of a triangle or wedge. XLE is now at levels last seen during the financial crisis, and as I noted above, I cannot get interested in taking another speculative swing here. I will not be surprised to see XLE slide right past the 2008/2009 lows. Indeed, at the time of writing, oil futures suggest another plunge of $10 for oil. This is definitely financial crisis level destruction in the oil pits!
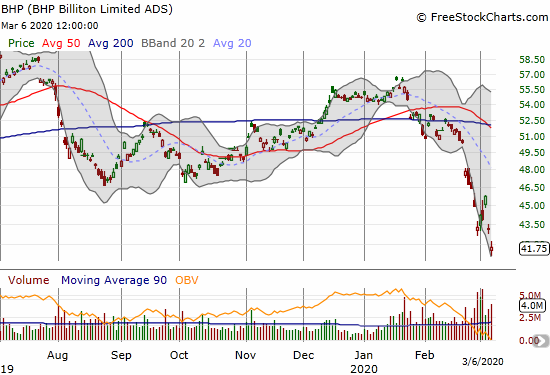
BHP Billiton Limited ADS (BHP)
BHP Billiton Limited ADS (BHP) is a diversified commodities company but is mainly an iron ore play. BHP has enough oil assets to tank even harder than the other iron ore plays like Rio Tinto (below). I failed to fade the last rally. At a 27-month low, BHP is now on the buy list for some time in the future when the market is looking better.
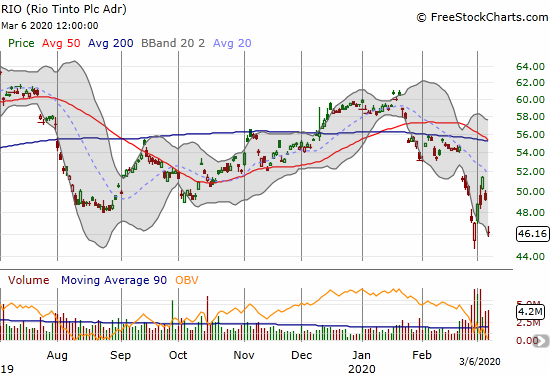
Rio Tinto (RIO)
Rio Tinto (RIO) is another commodity player I neglected to fade in the last rally. RIO is now at a 15-month low and likely headed lower unless/until Chinese stimulus stokes more steel production…which is not likely anytime soon.
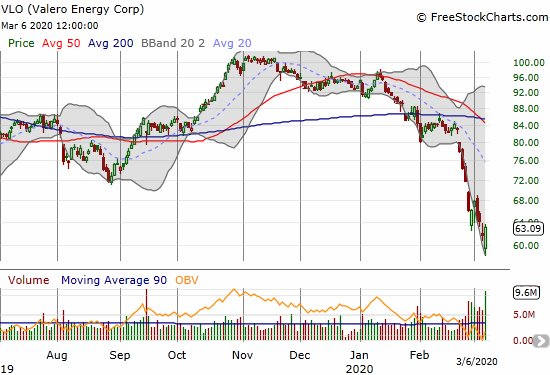
Valero Energy (VLO)
Almost anything with “energy” in its name is a bad word. However, I cannot help eyeing the refiner Valero (VLO) as its input costs are plunging with the price of oil. At a near 3-year low and almost 40% below recent highs, VLO is simply too enticing to pass up as a longer-term play. Friday’s gain is encouraging as well. I have VLO on the buy list for this week.
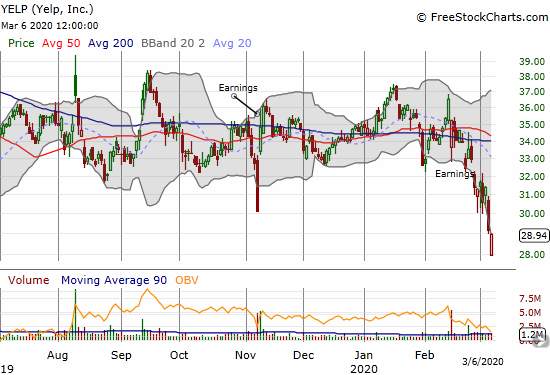
Yelp (YELP)
Yelp (YELP) broke through the bottom of its trading range. I failed to put in place the covered call strategy on YELP, so this plunge now makes YELP an enticing buy outright. The stock is of course plunging on fears that no one will need food and restaurant reviews with coronavirus fears keeping people indoors. As with many of of these types of companies, the longer-term value remains intact and the short-term angst is an opportunity to get in at discount prices. YELP stays on my “watch list” because the stock dropped below $20 4 years ago, and I see risk back down to those levels. The stock is still not priced for downside risk on a valuation basis: 58.8 trailing P/E, 33.9 forward P/E, 2.4 price/sales, 2.9 price/book. The price to earnings ratios have me worried whereas the P/S and P/B are actually very reasonable for a software/internet company.
Stock Chart Reviews – Above the 200DMA
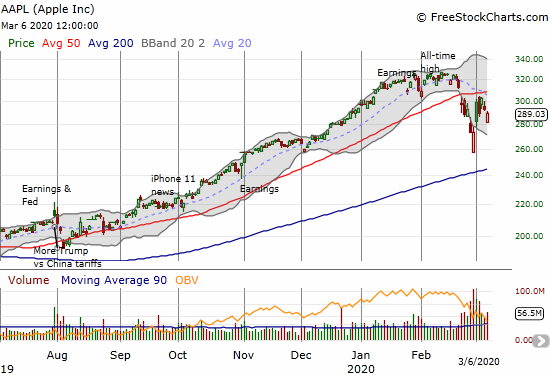
Apple (AAPL)
I have talked about Apple (AAPL) as an overall barometer for the market. I find encouragement in seeing AAPL well off its lows for the cycle even as the stock confirmed 50DMA resistance. I went ahead and dipped into the well of the weekly call strategy for AAPL. Of course, look out if AAPL breaks last week’s intraday lows.
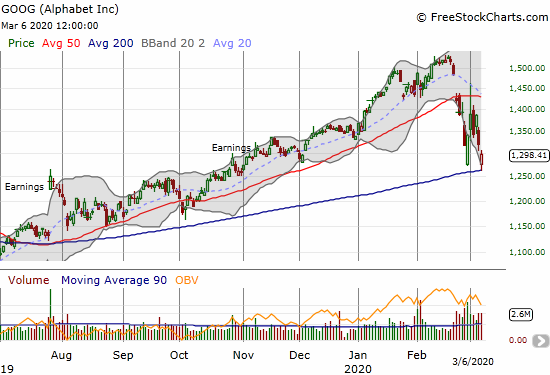
Alphabet (GOOG)
Alphabet (GOOG) is on the shopping list this week given its picture perfect bounce off 200DMA support. I will only trigger a move after the stock trades above Friday’s intraday high as a hopeful sign that buyers are taking control.
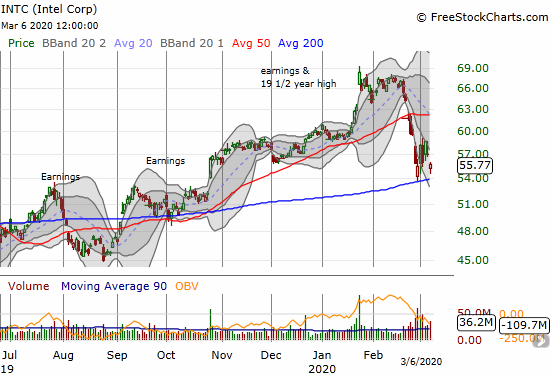
Intel (INTC)
I used the dip early in the week to take another crack at the between earnings trade for Intel (INTC). I bought a calendar call spread with the short side expiring last Friday. Much to my surprise, the small dip on Friday triggered my initial target selling price. This trading experience was another reminder of the value of calendar spreads: the trade can profit even when the stock moves in the opposite direction of the trade. INTC is right back on the shopping list this week with the stock levitating above 200DMA support. Like GOOG, I will only trigger once the stock trades above Friday’s intraday high.
Advanced Micro Devices (AMD)
I described above my tantalizing trade in Advanced Micro Devices (AMD). AMD is definitely still on the shopping list, even more so with the positive report on future earnings. I am buying ahead of a clear break above the 50DMA and definitely buying into dips.
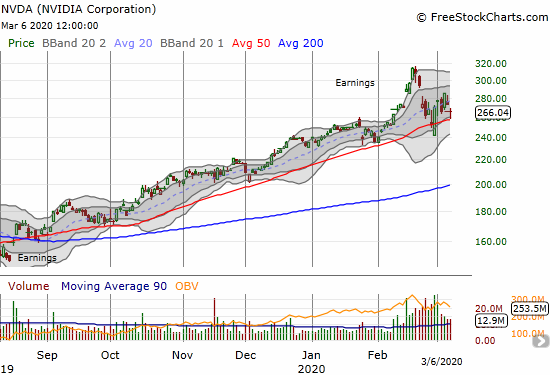
NVIDIA (NVDA)
NVIDIA (NVDA) is doing relatively well throughout this oversold period. Until Friday, the stock was showing more buying power than selling power. NVDA is on the shopping list this week assuming it continues to hold uptrending 50DMA support.
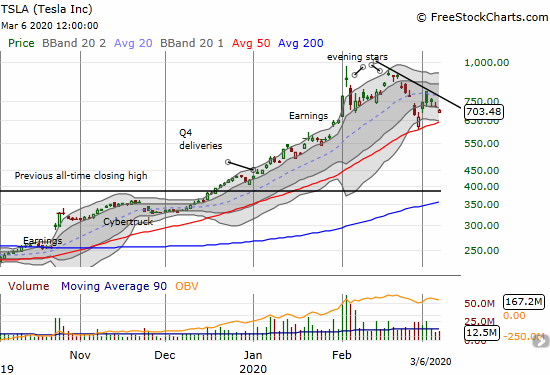
Tesla (TSLA)
Given the angst in the market, I am surprised Tesla (TSLA) remains as high as it is. In my Above the 40 post a week ago I noted the perfect bounce off 50DMA support but lamented that Monday would likely send the stock up faster than I could catch it. TSLA indeed gapped up, and I had to scramble. The stock had just one more day of lift in it, and I had to quickly take some profits as the stock faded from Tuesday’s intraday high to close flat with Monday. I repositioned with an out-of-the-money put expiring this week and a call spread expiring in 2 weeks. The chart below shows how TSLA is struggling to beat a downtrend from its all-time high while also trying to hold 50DMA support. The resolution of this channel should open up the next big upside or downside moves in TSLA.
— – —
FOLLOW Dr. Duru’s commentary on financial markets via email, StockTwits, Twitter, and even Instagram!
“Above the 40” uses the percentage of stocks trading above their respective 40-day moving averages (DMAs) to assess the technical health of the stock market and to identify extremes in market sentiment that are likely to reverse. Abbreviated as AT40, Above the 40 is an alternative label for “T2108” which was created by Worden. Learn more about T2108 on my T2108 Resource Page. AT200, or T2107, measures the percentage of stocks trading above their respective 200DMAs.
Active AT40 (T2108) periods: Day #8 under 20% (oversold day #8), Day #9 under 30%, Day #20 under 40%, Day #11 under 50%, Day #30 under 60%, Day #34 under 70%
Daily AT40 (T2108)
")
Black line: AT40 (T2108) (% measured on the right)
Red line: Overbought threshold (70%); Blue line: Oversold threshold (20%)
Weekly AT40 (T2108)

*All charts created using FreeStockCharts unless otherwise stated
The T2108 charts above are my LATEST updates independent of the date of this given AT40 post. For my latest AT40 post click here.
Be careful out there!
Full disclosure: long IWM calls, long QQQ calls and shares, long SVXY call, long UVXY puts, long SSO, long USO calls, long XLE calls, long TWTR shares and short calls, long AAPL calls, long CCL, long RRGB, long INTC call options, long TSLA put and call spread
*Charting notes: FreeStockCharts stock prices are not adjusted for dividends. TradingView.com charts for currencies use Tokyo time as the start of the forex trading day. FreeStockCharts currency charts are based on Eastern U.S. time to define the trading day.
So Duru, is there enough blood in the streets yet?
I sure hope so! Goodness!