
AT40 = 17.5% of stocks are trading above their respective 40-day moving averages (DMAs) (6th oversold day)
AT200 = 32.9% of stocks are trading above their respective 200DMAs
VIX = 32.0
Short-term Trading Call: bullish
Stock Market Commentary
Was it a delayed response to the emergency rate cut from the Federal Reserve? Was it the big comeback by Joe Biden in the Democratic Presidential primary? Is it fresh money flooding the market from passive investments? Was there some news on the coronavirus panic that was misinterpreted as good news?
As I have noted before, the headlines can be distractions for trading the stock market. For this period of extreme angst, the technical conditions of overbought provide sufficient rules without requiring projections or explanations. Oversold periods are extreme, fear exhausts itself, and oversold conditions tend to end with rallies.
Oversold
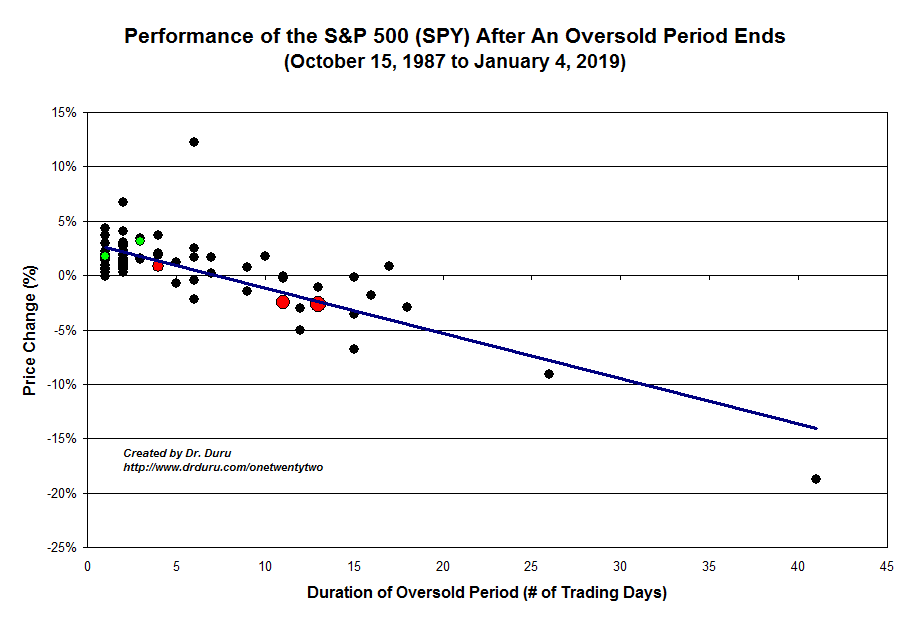
While the stock market closed with incredible gains for the second day of three, AT40 (T2108), the percentage of stocks trading above their respective 40-day moving averages (DMAs), remained under 20%, the threshold for oversold market conditions. AT40 closed at 17.5%. The oversold period is starting to “age” at 6 days long. The chart below is a reminder that the majority of oversold periods end within 3 days.
The Indices
The aging of the oversold period increases the odds that the S&P 500 (SPY) will exit the oversold period lower than when it entered. So, I take some small comforts that the S&P 500 is up 0.4% since the oversold period began on February 26, 2020. If the oversold period ends this week, the S&P 500 should thus finish with a gain.
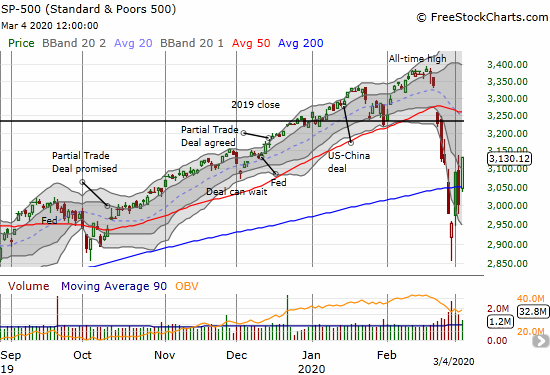
In my last Above the 40 post I saw affirmation of the “shake and bake bottom” in the sharp rally that started the week. The sharp fade on Tuesday after the Federal Reserve cut rates gave me some doubt. However, the market still seems to be following a typical script of shaking out sellers in from oversold conditions. Even the fade of the Fed news was not surprising given the market’s overall angst. There are plenty of investors who are looking to exit on rallies. I will cover the recent drama of the Federal Reserve and other global central banks in another post. Interested readers can refer to my post over the weekend laying out the case for a large rate cut from the Fed.
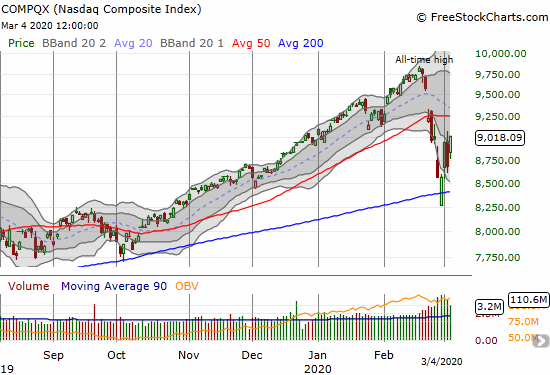
Surprisingly, the NASDAQ (COMPQX) is tracking the S&P 500. The tech-laden index gained 3.9% and is now up 0.4% for this oversold period.
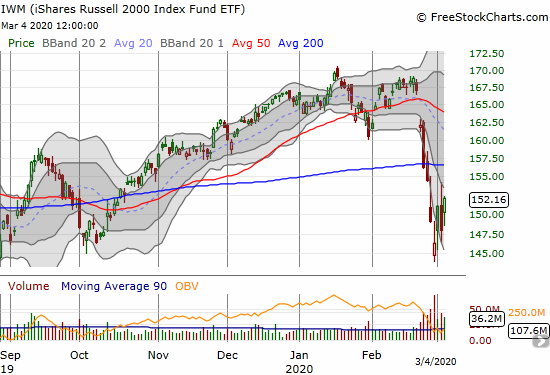
The iShares Russell 2000 Index Fund ETF (IWM) lagged with a 2.9% gain. IWM is still down for the oversold period and still has a hill to climb to return to its 200DMA. I used Tuesday’s selling to buy more IWM calls.
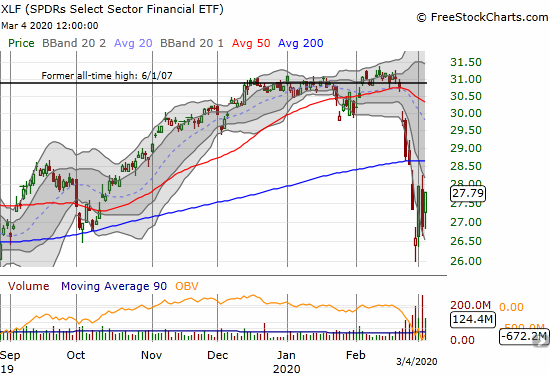
The SPDRS Select Sector Financial ETF (XLF) is also still down for the oversold period. XLF’s 3.3% gain is not even the ETF’s highest close for the oversold period. This lagging behavior is telling and seems to confirm my decision to keep these stocks off the shopping list. The plunging rate environment will likely as a brake on financial stocks.
Volatility
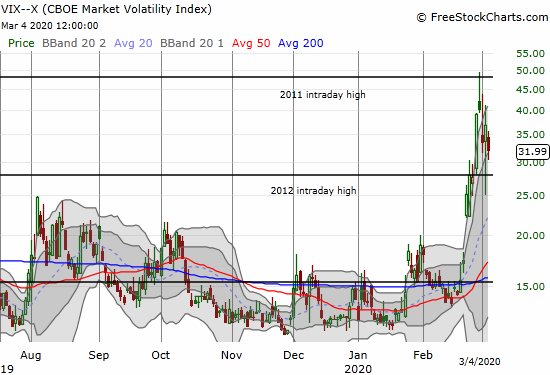
The volatility index (VIX) continued to fade from Friday’s peak fear. At 32.0% the VIX remains quite elevated, so extremely large swings up and down in the market are still in play.
The Short-Term Trading Call
In a previous Above the 40 post I described myself as being uncomfortably bullish. I am still uncomfortable but less so. Tuesday was maximum discomfort as the quick post-Fed fade caught me still holding several speculative call options and spreads that expire on Friday. I used Wednesday’s strong rally to finally take profits on those. I am still holding speculative positions in an Amazon.com (AMZN) call spread and Advanced Micro Devices (AMD) calls. I took profits on short-term shares in Pro Shares Ultra S&P 500 (SSO) (a second roundtrip) and plan to hold the remaining position until some point after the oversold period ends.
Interestingly, home builders have become some of my best-performing positions for this oversold period. My seasonal plays were up so much that I had to trim some positions just to protect some profits. My last Housing Market Review covered most of my positioning and latest perspectives on the housing market and home builders. Note that declining interest rates are helping to act as a turbo boost on this trade.
Time is now ticking on my volatility fades, so I purchased another round of put options on ProShares Ultra VIX Short-Term Futures ETF (UVXY). These volatility fades serve a dual purpose: 1) a play on volatility fading to 20 and below as fear subsides, and 2) a “protection” against a sudden plunge in volatility that could dampen the value of call options bought at high premiums. Note in general, I am still favoring call spreads, vertical and calendar, specifically to offset the high volatility premiums.
On the downside, I am continuing to dabble in “backstops.” Tuesday’s plunge allowed me to take profits on my last tranche of Caterpillar (CAT) put options. I bought a fresh tranche in today’s rally. Per my last Above the 40 post, I bought a put spread on Chipotle Mexican Grill (CMG) after the stock rallied on an upgrade to overweight. Given the market is oversold and my trading call is bullish, these hedges are backstops on worst case scenarios and are not intended to fully hedge my longs (not even close actually!).
Stock Chart Reviews – Below the 50DMA
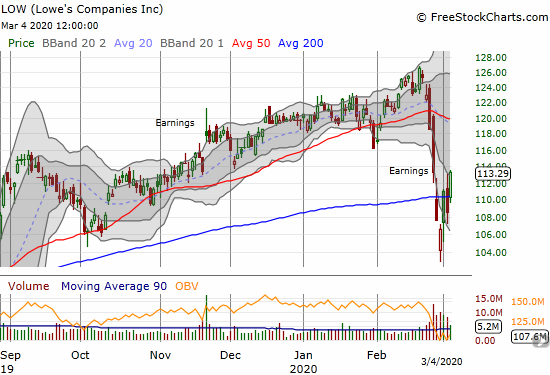
Lowe’s Companies (LOW)
I now have Lowe’s Companies (LOW) on my shopping list. The stock printed a more convincing 200DMA breakout today. Given the performance of Home Depot (HD) (see below), I think LOW could eventually challenge its all-time high after some churn around its 50DMA resistance.
Stock Chart Reviews – Above the 50DMA
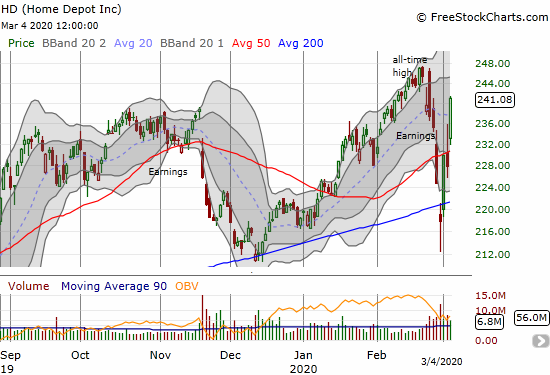
Home Depot (HD)
Home Depot (HD) is showing off the strength in the housing market. After a 200DMA breakdown last Friday, HD has gained 10.7%. I somehow did not move fast enough to catch this rocket ship. The stock is up too sharply for me to buy here. I definitely like it on a dip back to 50DMA support.
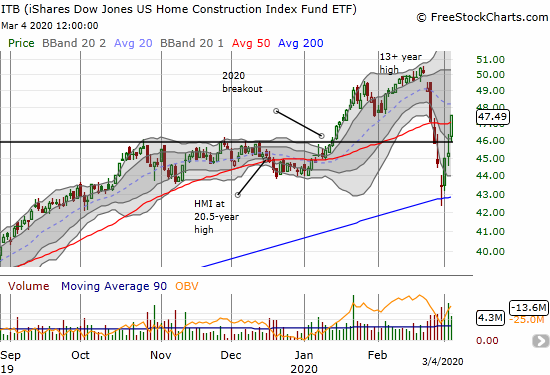
iShares Dow Jones US Home Construction Index Fund ETF (ITB)
Partially thanks to the Fed driving rates down, housing-related stocks are flourishing enough to out-perform the market during this cycle. Lower rates promise to drive down mortgage rates. Even if coronavirus fears somehow keep people from buying homes, refinance activity will give current homeowners yet more spending power.
The iShares Dow Jones US Home Construction Index Fund ETF (ITB) had a near picture-perfect test of 200DMA support last Friday. ITB has not looked back since and even notched a small gain on Tuesday when the rest of the market was selling off again. ITB is up 9.4% from last week’s bottom. Compare that performance to the S&P 500’s 6.0% and even the NASDAQ’s 5.3% (lower because of a strong rally from the intraday low).
This latest sell-off cycle created a perfect storm for the seasonal trade on home builders.
— – —
FOLLOW Dr. Duru’s commentary on financial markets via email, StockTwits, Twitter, and even Instagram!
“Above the 40” uses the percentage of stocks trading above their respective 40-day moving averages (DMAs) to assess the technical health of the stock market and to identify extremes in market sentiment that are likely to reverse. Abbreviated as AT40, Above the 40 is an alternative label for “T2108” which was created by Worden. Learn more about T2108 on my T2108 Resource Page. AT200, or T2107, measures the percentage of stocks trading above their respective 200DMAs.
Active AT40 (T2108) periods: Day #6 under 20% (oversold day #6), Day #7 under 30%, Day #18 under 40%, Day #9 under 50%, Day #28 under 60%, Day #32 under 70%
Daily AT40 (T2108)
")
Black line: AT40 (T2108) (% measured on the right)
Red line: Overbought threshold (70%); Blue line: Oversold threshold (20%)
Weekly AT40 (T2108)

*All charts created using FreeStockCharts unless otherwise stated
The T2108 charts above are my LATEST updates independent of the date of this given AT40 post. For my latest AT40 post click here.
Be careful out there!
Full disclosure: long IWM calls, long QQQ call spread and shares, long SVXY call, long long UVXY puts, long SSO, long ITB call spread and calls, long AMD calls, long AMZN call spread
*Charting notes: FreeStockCharts stock prices are not adjusted for dividends. TradingView.com charts for currencies use Tokyo time as the start of the forex trading day. FreeStockCharts currency charts are based on Eastern U.S. time to define the trading day.