
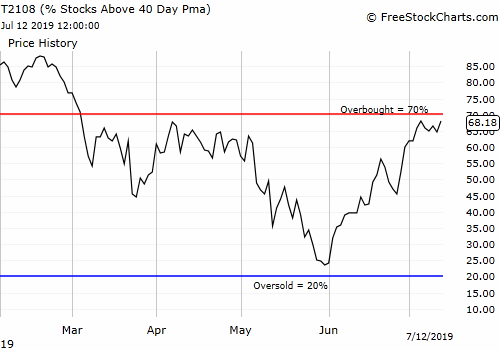
AT40 = 68.2% of stocks are trading above their respective 40-day moving averages (DMAs)
AT200 = 54.9% of stocks are trading above their respective 200DMAs (essentially matches the 2019 high and is a new 10-month high)
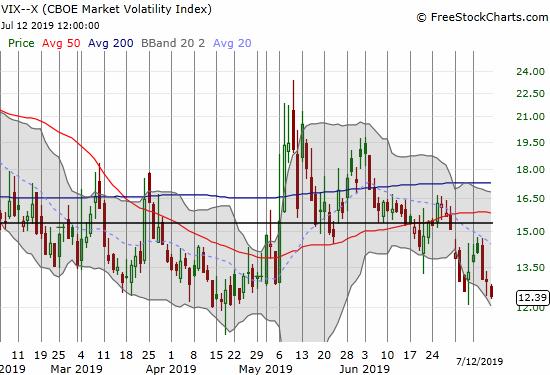
VIX = 12.4
Short-term Trading Call: neutral (caveats below)
Stock Market Commentary
After the report on June jobs, financial markets got a little less optimistic about the prospects for rate cuts. However, last week, Congressional testimony from Federal Reserve Chair Jerome Powell helped encourage financial markets all over again. The Fed’s dovish signature was written all over the market action.
Market Projections for Rate Cuts
In the wake of the June jobs report, the odds for at least a 50 basis rate cut at the July Fed meeting dropped from 29.2% to a mere 5.4%. The odds for three rate cuts (75 basis points) in 2019 plunged from 61.2% to 41.6%. All data are according to CME FedWatch. After Powell went to work, the odds for 50 basis points in July jumped back to 23.0%. The odds for at least one rate cut in July remain at 100%. The odds for 75 basis points of cuts by December jumped back up to 55.4%.
The tables below compare the meeting probabilities from July 5th (the first table) and July 12th (the second table). The most likely rate level (horizontal axis) at the given meeting date (vertical axis) is marked in blue. The probability for that (maximum) rate level is the SUM of all the probabilities in the blue cell and all the cells to the left of that blue cell. The current rate range is 2.25% to 2.50% (or 225 to 250 basis points).
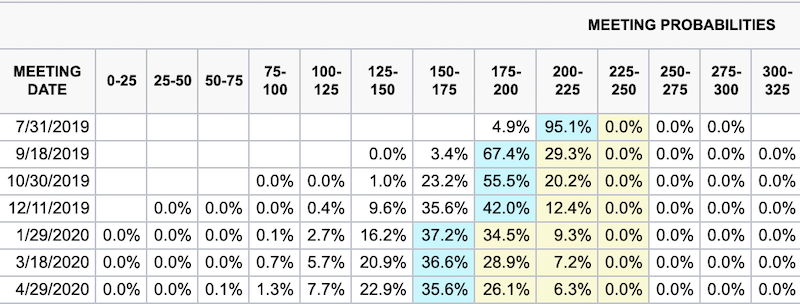
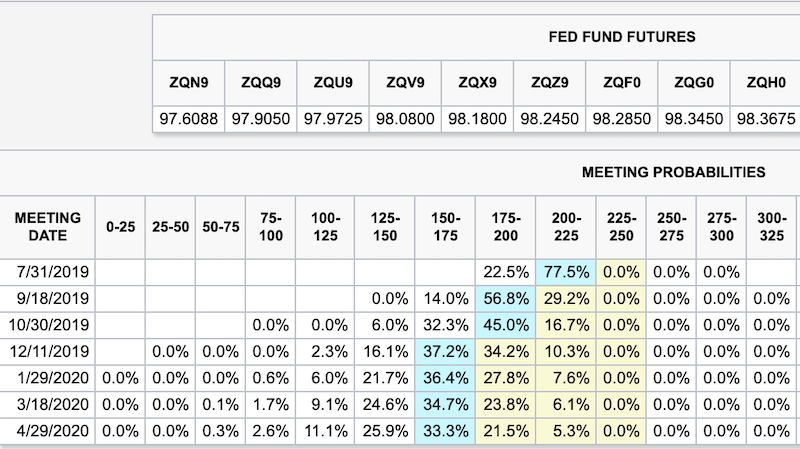
Source for data and charts: CME FedWatchTool
A Fresh Retreat for the U.S. Dollar
The change in rate cut projections knocked the U.S. dollar index (DXY) off the residual strength it enjoyed from the jobs report. The U.S. dollar index came tumbling back down to its 200-day moving average (DMA). This pivot around the 200DMA is a critical moment for the currency given the importance of this trendline. I am gradually increasing my bets against the U.S. dollar as I see lower highs and lower lows developing that tell me not to trust 200DMA as support for much longer.
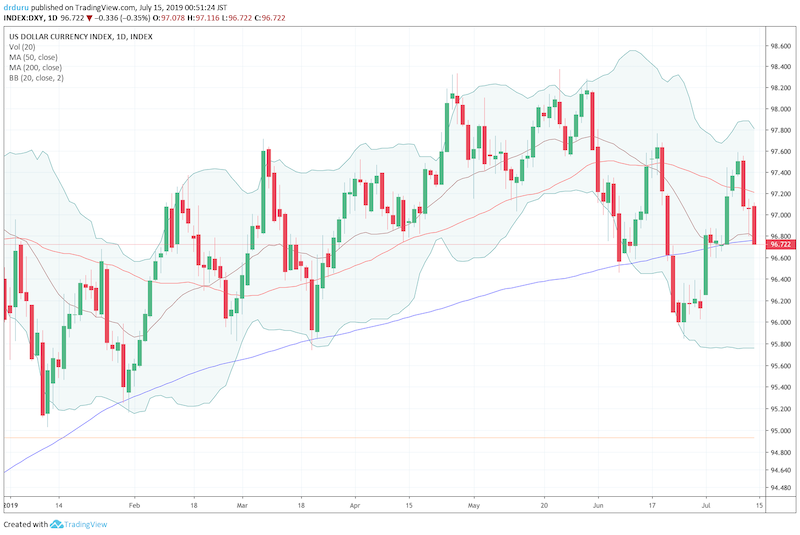
Source: TradingView.com
Small Caps Lagging Again
It was a bullish week for the major indices except small caps could not break out of their month-to-date churn.
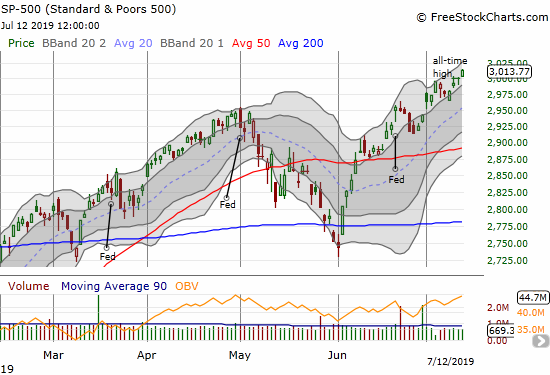
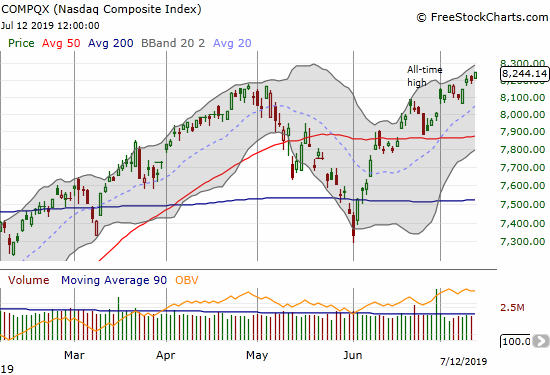
The S&P 500 (SPY) and the NASDAQ (COMPQX) finished the week at new all-time highs.
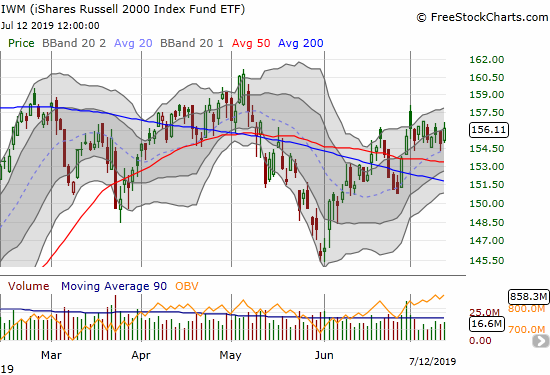
Small-caps did not take advantage of this fresh momentum. The iShares Russell 2000 ETF (IWM) has made no progress all month. IWM’s 0.8% gain on Friday was only good enough for a close near the top of the tight range.
Still Not Overbought
Even with small caps lagging, I would have assumed last week’s bullishness sufficient to push AT40 (T2108), the percentage of stocks trading above their respective 40DMAs, through the overbought threshold (70%). AT40 was on a bullish run the previous week. Instead of following through, my favorite technical indicator just chopped its way to no gain on the week. AT40 closed the week at 68.2%. This divergence is not bearish (yet), but the dynamic does raise my skepticism about the underlying health of the market. If AT40 falls sharply from the overbought threshold, I will be inclined to flip bearish on the market even in advance of the well-anticipated rate cut from the Fed.
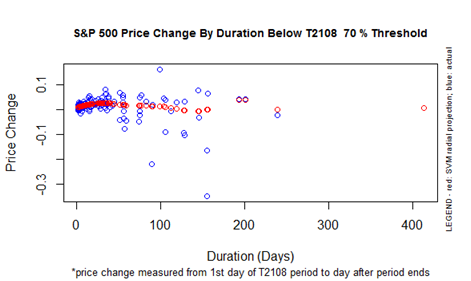
The last overbought period ended on March 6th with the S&P 500 closing at 2,771.45. The index is up 8.7% since then. This kind of gain is at the high end for the AT40 70% underperiod even at the current duration of 91 trading days. The chart below suggests that the index will not make further gains as long as AT40 remains below 70%.
Volatility crush
The volatility index (VIX) was decisive to the downside. It finished the week at 12.4 which almost matches the lows for the year. With earnings season kicking off, this is exactly the point where I should be thinking about another surge higher for the VIX. Instead, I decided to stand down; I did not refresh my cyclical bet long on volatility. At this point I prefer going long volatility just ahead of the next Fed meeting. At the current rate, volatility could soon reach a bullish extreme, aka extremely low volatility (ELV), at 11.
Stock Chart Reviews – Bearish
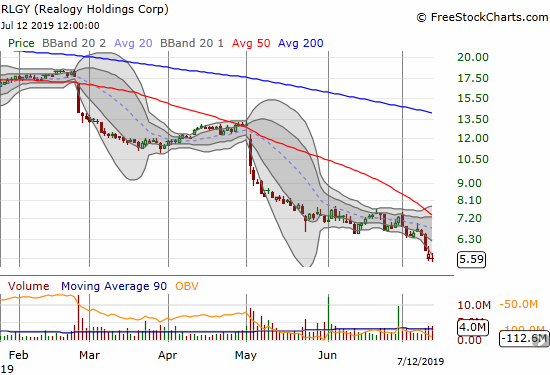
Realogy Holdings (RLGY)
I included this chart just to have something recorded in the bearish column. I am fascinated at the persistent decline in Realogy Holdings (RLGY) despite the counter-seasonal strength in the stocks of home builders. I still have a to-do for understanding the company-specific factors putting this collection of realtors on an apparent death march.
Stock Chart Reviews – Bullish
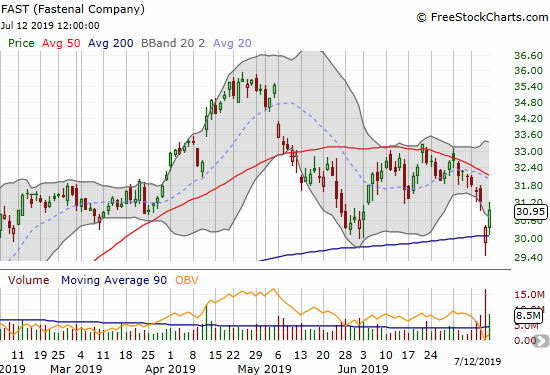
Fastenal Company (FAST)
I am giving credit to Fastenal Company (FAST) for surviving a post-earnings 200DMA breakdown. Otherwise, the now declining 50DMA resistance would plant FAST firmly into the bearish column. This kind of rebound is something that can happen with a market breathlessly awaiting rate cuts. I will be looking for other such post-earnings bounces over the next week and a half. I only want to buy FAST if it can confirm a 50DMA breakdown. A new post-earnings low would be VERY bearish.
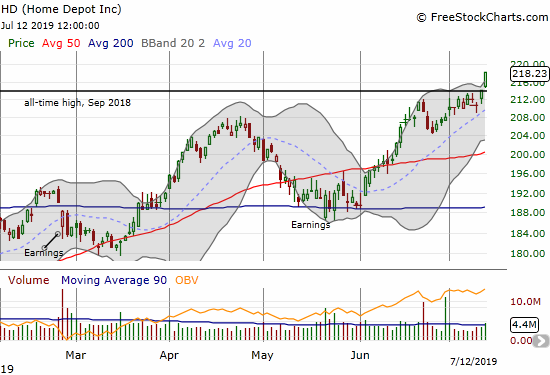
Home Depot (HD)
Home Depot (HD) pulled off an impressive breakout on Friday. The stock’s move to a fresh all-time high makes it a buy on the dips. I would have tried a calendar call spread except I am already riding call options on Lowe’s Companies (LOW)…
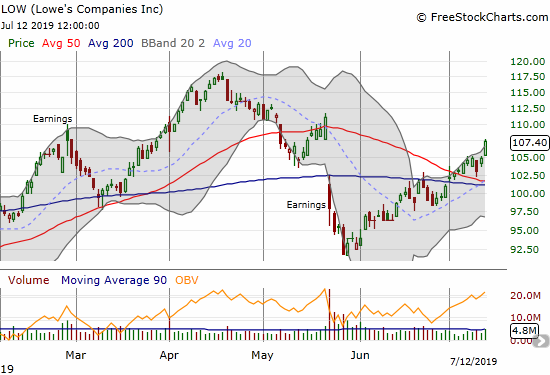
Lowe’s Companies (LOW)
Lowe’s Companies (LOW) confirmed its 50DMA breakout in the previous week. On Wednesday, LOW dipped for an effective and successful test of converging 50 and 200DMA support. LOW now looks set to finish closing its post-earnings gap down. I assume it is also going to ride Home Depot’s coattails to still higher prices.
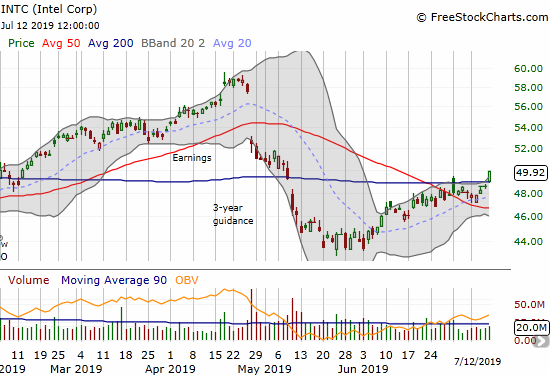
Intel (INTC)
Intel (INTC) printed a bullish 200DMA breakout. The move may be too little too late for my first and second tranches of my between-earnings call options trades (I already took profits on the third tranche). If INTC confirms the breakout this week, I will buy shares for holding. INTC pays a relatively juicy 2.6% dividend yield.
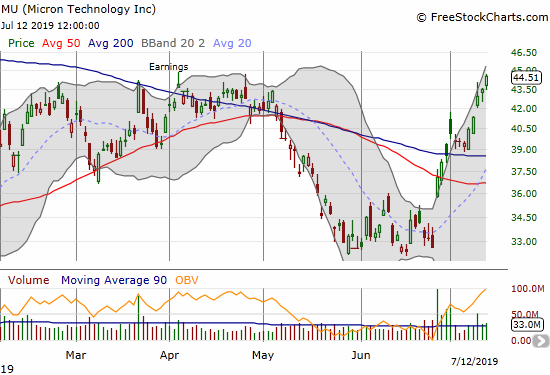
Micron (MU)
I clearly was not bullish enough on Micron (MU)! MU is still sprinting upward ever since its post-earnings gap up into 50DMA resistance that got my attention.
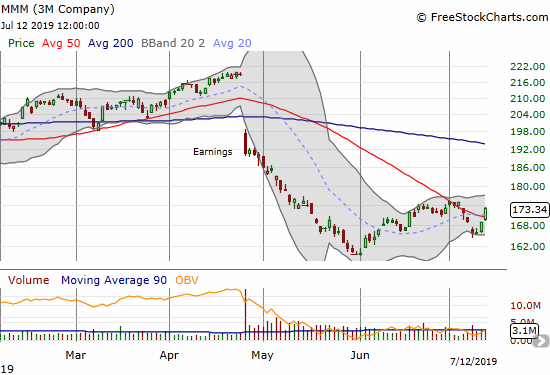
3M Company (MMM)
Ever since a disastrous April earnings report, the 3M Company (MMM) has been a laggard. The stock is finally vying for a bottom. MMM made another 50DMA breakout and just needs a higher high to put in the classic bottoming pattern. MMM is exactly kind of “bargain basement” buy that should work well in a time of rate cuts. MMM pays a healthy 3.4% dividend yield.
— – —
FOLLOW Dr. Duru’s commentary on financial markets via email, StockTwits, Twitter, and even Instagram!
“Above the 40” uses the percentage of stocks trading above their respective 40-day moving averages (DMAs) to assess the technical health of the stock market and to identify extremes in market sentiment that are likely to reverse. Abbreviated as AT40, Above the 40 is an alternative label for “T2108” which was created by Worden. Learn more about T2108 on my T2108 Resource Page. AT200, or T2107, measures the percentage of stocks trading above their respective 200DMAs.
Active AT40 (T2108) periods: Day #129 over 20%, Day #29 over 30%, Day #22 over 40%, Day #12 over 50%, Day #9 over 60% (overperiod), Day #91 under 70% (underperiod)
Daily AT40 (T2108)
")
Black line: AT40 (T2108) (% measured on the right)
Red line: Overbought threshold (70%); Blue line: Oversold threshold (20%)
Weekly AT40 (T2108)

*All charts created using FreeStockCharts unless otherwise stated
The T2108 charts above are my LATEST updates independent of the date of this given AT40 post. For my latest AT40 post click here.
Be careful out there!
Full disclosure: long IWM calls, long MU shares and short calls, long INTC calls, long LOW call, net short the U.S. dollar index
*Charting notes: FreeStockCharts stock prices are not adjusted for dividends. TradingView.com charts for currencies use Tokyo time as the start of the forex trading day. FreeStockCharts currency charts are based on Eastern U.S. time to define the trading day.