Stock Market Commentary
Jackson Hole did not provide the market moving spark that I expected. Instead, soft economic news delivered the decisive interpretation of future monetary policy required to provide a fresh catalyst for stocks. The bullish spark caught me flat-footed as I was leaning into imminent oversold trading conditions. Fortunately, the sentiment shift was so sharp and obvious, I was able to comfortably pivot to run with the herd…and the herd rushed for tech stocks in particular. In fact, the stampede was so decisive that buyers went into “press the limits” mode. The week ended with tech stocks generally tapping the upper limits of price action at the upper Bollinger Band (BB) and other forms of potential technical price resistance.
The end of the week also featured the August jobs report. The market seemed to see softening in the data despite the “stronger than expected” job creation. So I was surprised to see bond yields zipping higher for the first part of the day. The U.S. dollar (DXY) ripped higher as well. Stocks were also caught by surprise as sellers flattened out the S&P 500 and the NASDAQ from small up gaps at the open. Small caps held on for healthy gains. As stocks press the limits, the financial market faces one of those classically important junctures just as the summer of loving stocks comes to an end with the Labor Day weekend.
The summer, between Memorial Day and Labor Day delivered a 7.4% gain. Yet one more strike against the outdated adage “sell in May and go away.”
The Stock Market Indices
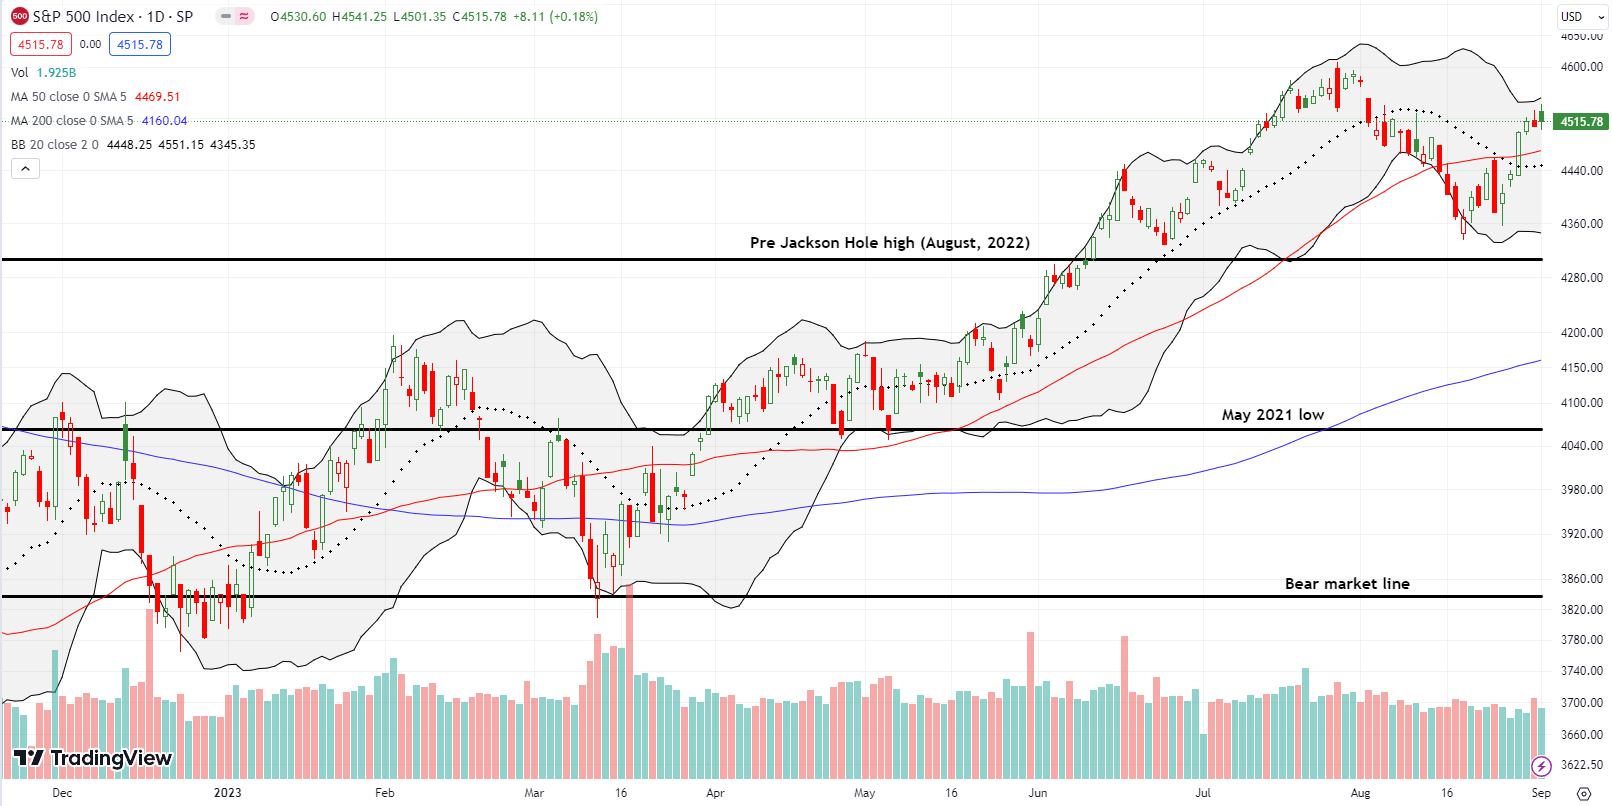
The S&P 500 (SPY) confirmed a breakout above 50-day moving average (DMA) support but failed to make more progress from there for the week. The index twice approached its upper Bollinger Band (BB) before fading slightly. This end-of-the-week tentativeness raises the stakes given the index has now fully reversed its loss since the bearish engulfing top in July. Can the S&P 500 press the limits of a recovery and reach for an invalidation of the top?
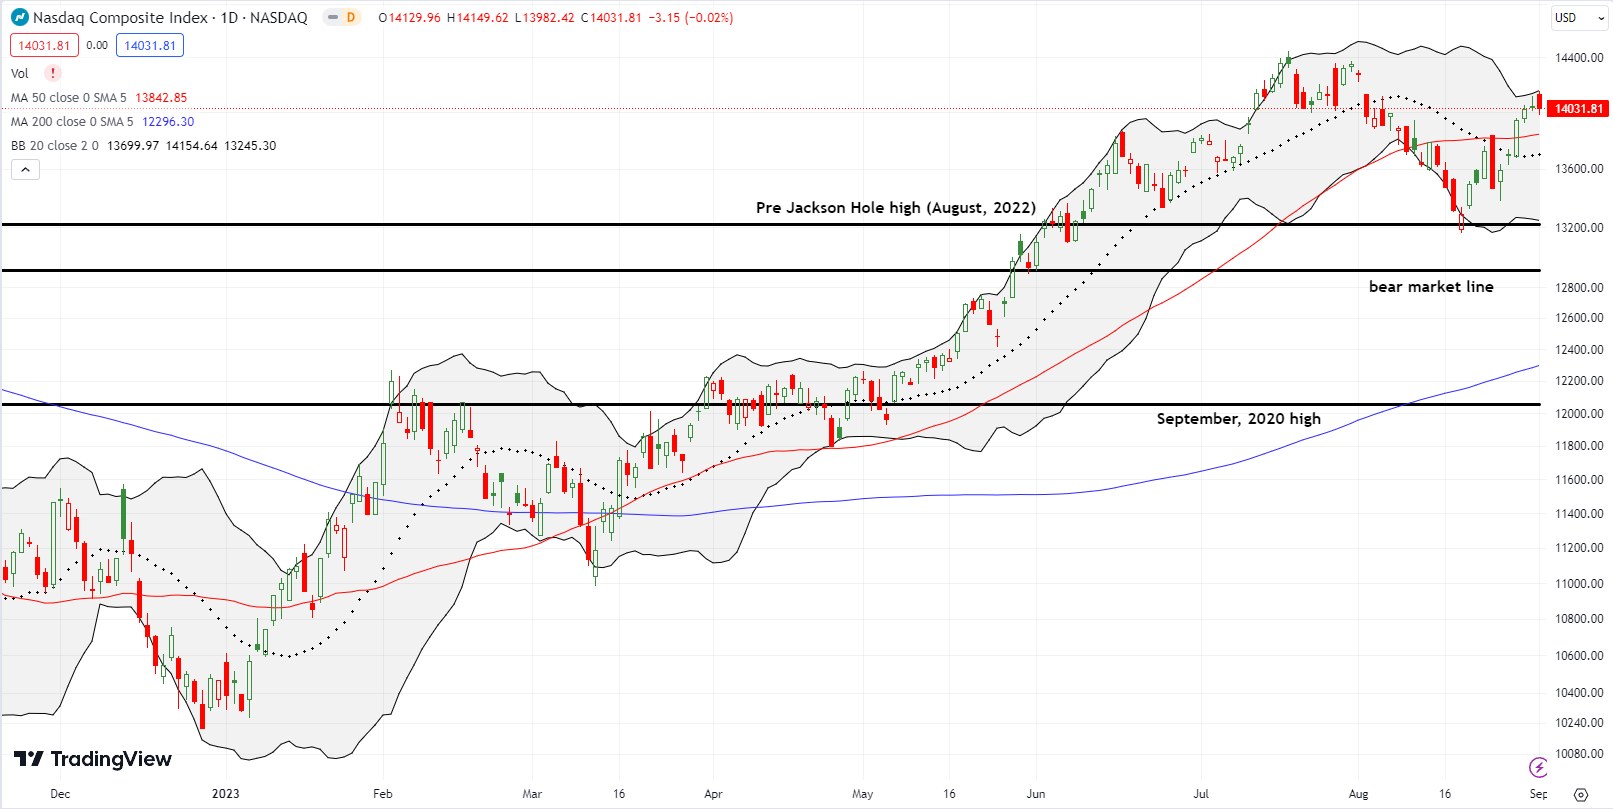
The NASDAQ (COMPQ) also reversed all its losses following the bearish engulfing top in July. (The persistent symmetry is uncanny and likely reflects the dominance of the same big-cap tech stocks across the two indices). The tech-laden index is also in “press the limits” mode after tapping the upper BB twice before intraday fades. So also like the S&P 500, the NASDAQ is at a critical spot where buyers need to prove they have more fuel in the tank.
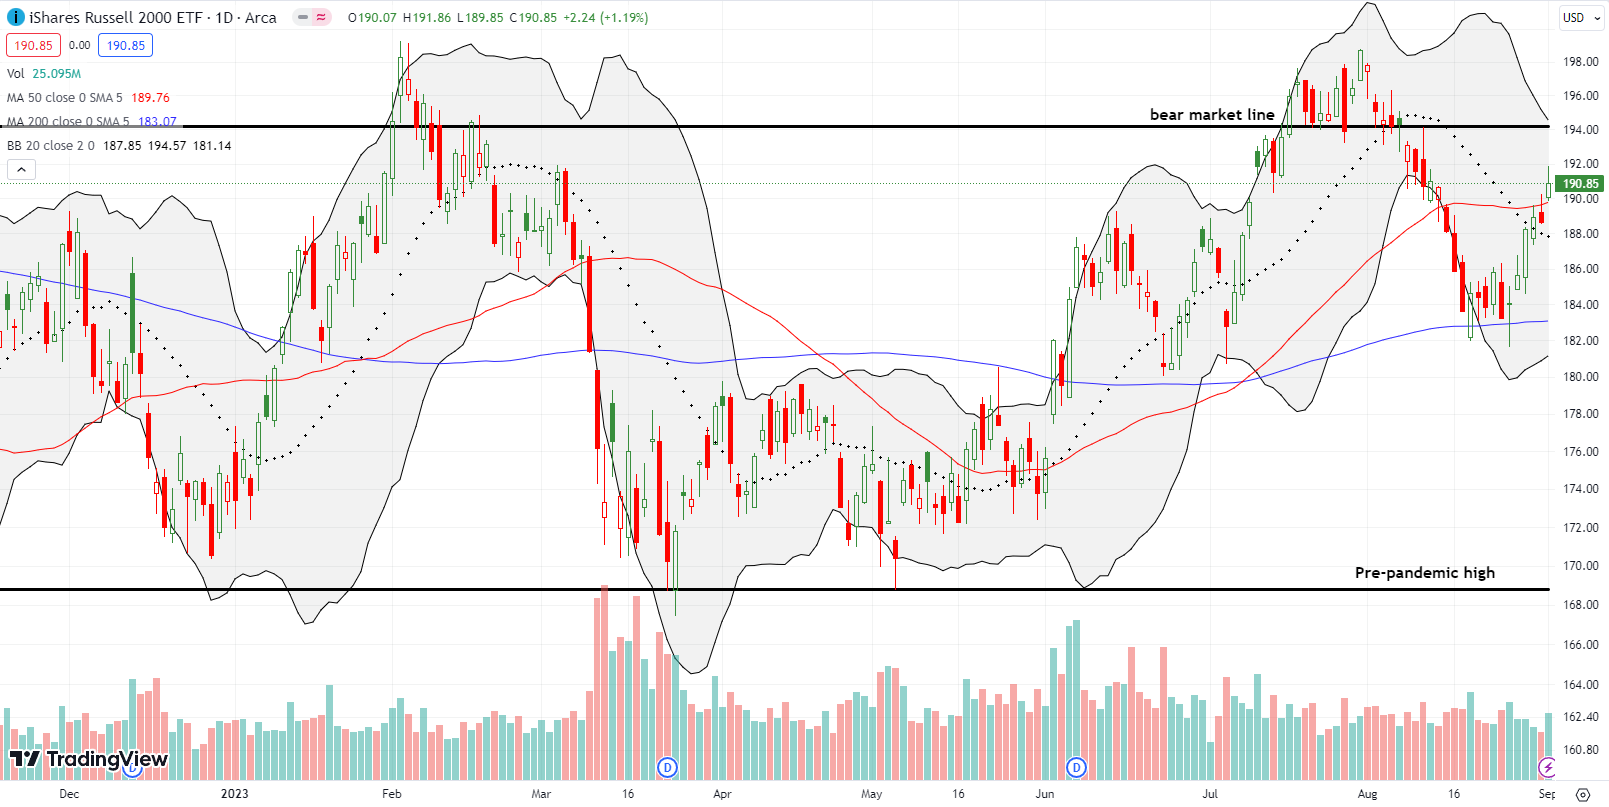
The iShares Russell 2000 ETF (IWM) was my marquee trade for the week, but I sold my call options too early (the calls were left from a calendar call position where the sort side expired harmless the week prior). I was worried too much about overhead resistance at the 50DMA. I set a tight stop on my position, and the market promptly took me out of the position before moving higher (d’oh!). I was feeling particularly disappointed after IWM broke out above 50DMA resistance. IWM now looks clear to challenge resistance at its bear market line. I will look to jump into a new calendar call position.
The Short-Term Trading Call As Stocks Press the Limits
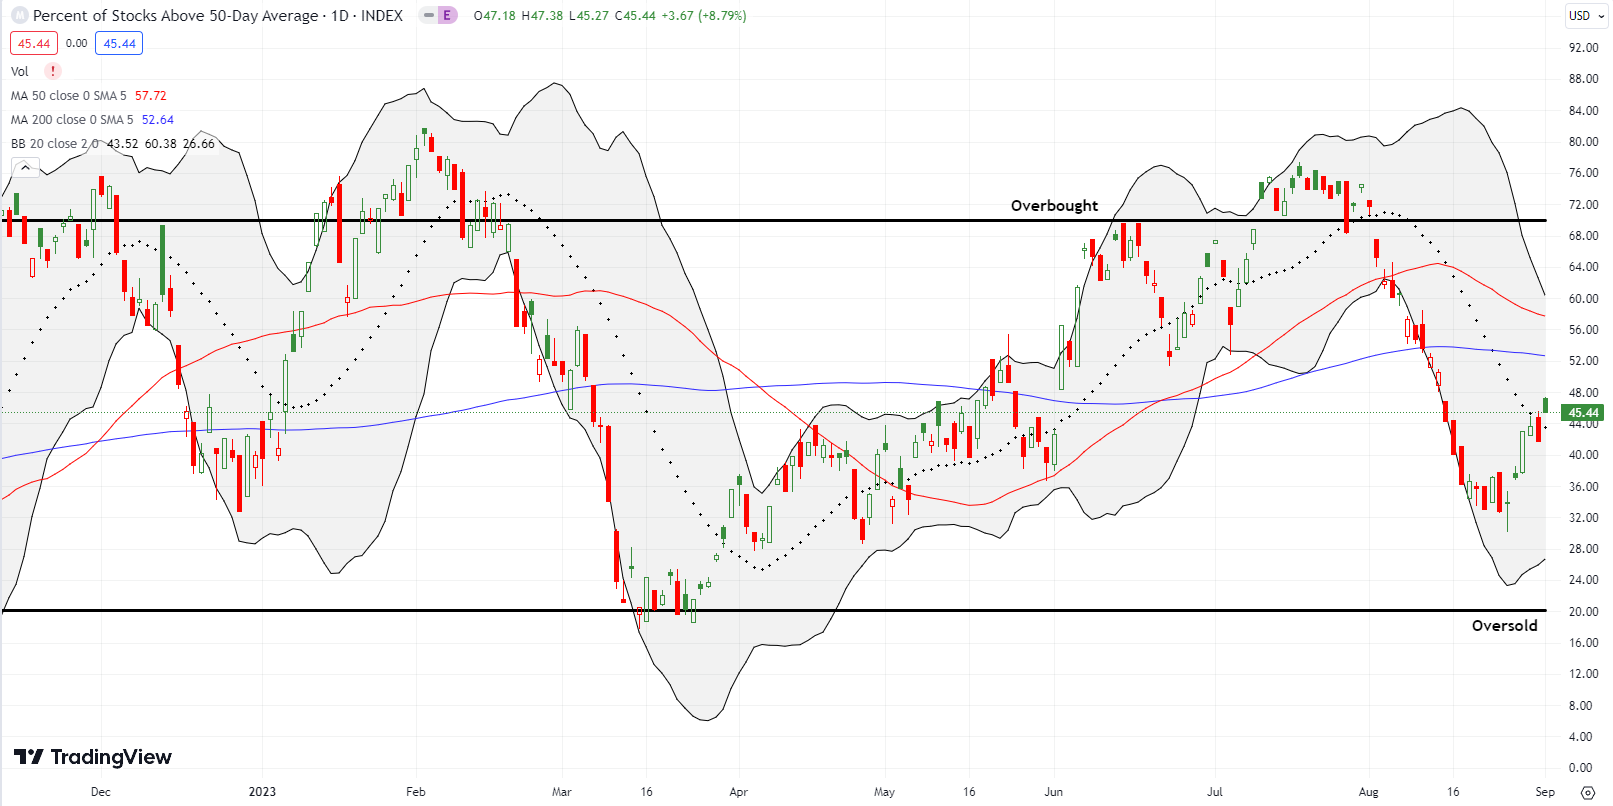
- AT50 (MMFI) = 45.4% of stocks are trading above their respective 50-day moving averages
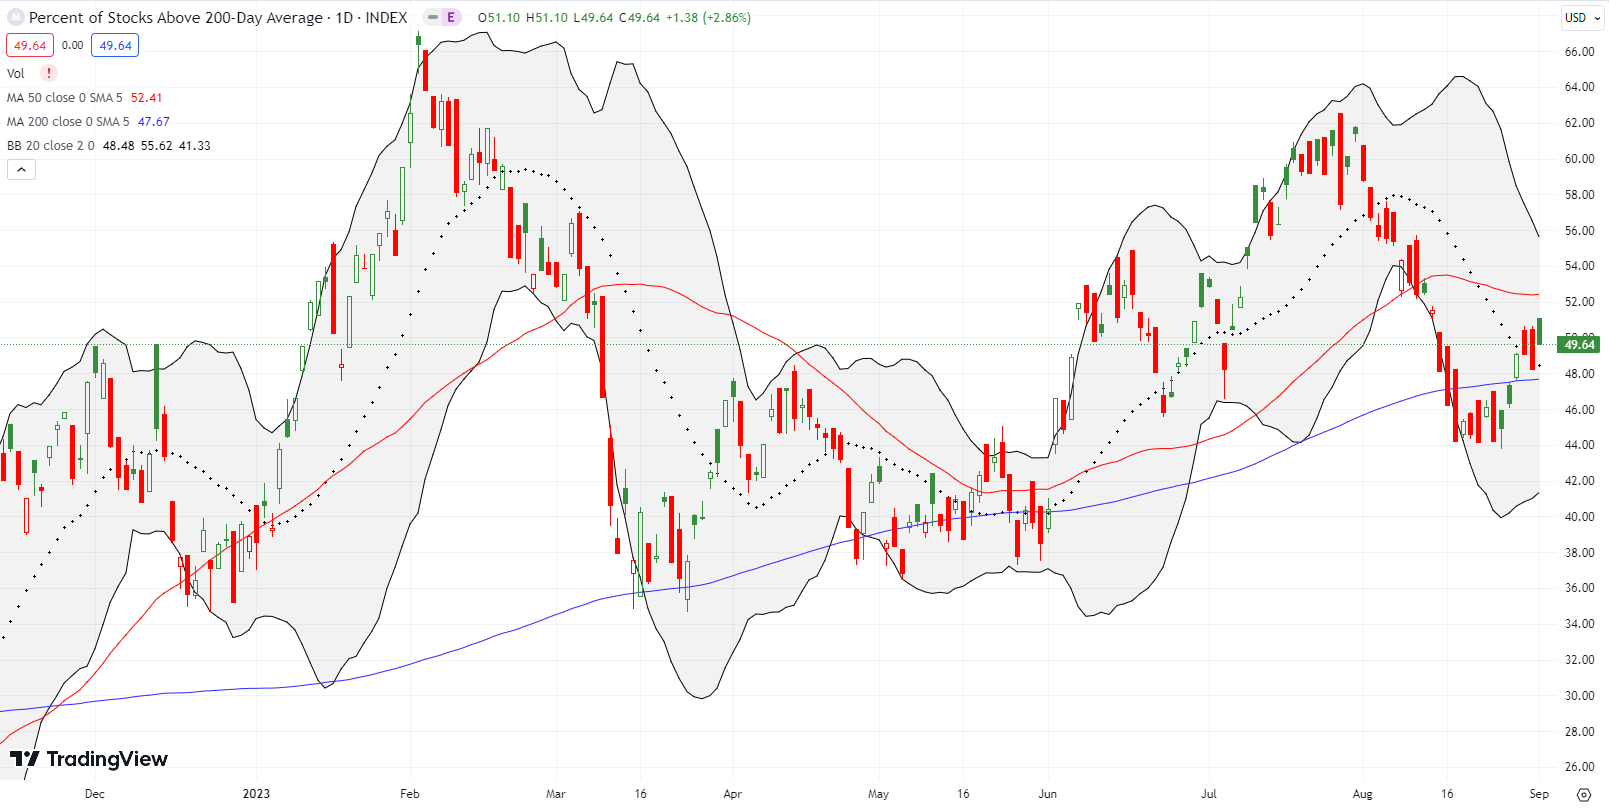
- AT200 (MMTH) = 49.6% of stocks are trading above their respective 200-day moving averages
- Short-term Trading Call: neutral
AT50 (MMFI), the percentage of stocks trading above their respective 50DMAs, pulled off an impressive rebound from the August lows. The consolidation of market breadth at those lows makes me think the stock market also printed lows in August. However, I also think the risks of the stock market’s most dangerous months are alive and well especially as stocks press the limits going into September. Here are some numbers to keep in mind:
- The maximum drawdown in August (on a closing price basis) was 4.8%. This pullback was much bigger than August’s median 2.2% and average 3.1% maximum drawdowns for the month.
- If September delivers a median maximum drawdown of 1.6%, the S&P 500 will bottom out at 4436 which would perfectly reverse the gain the day the index broke out above its 50DMA.
- If September delivers an average maximum drawdown of -2.8%, the S&P 500 will bottom out at 4381 right above August’s bottom.
- History suggests a strong June produces a 50/50 chance of a positive, even strong, second half of the year. The gain for the second half is now 1.5% after August at one point wiped out all of July’s gains.
- Strong trading extending to the end of July historically precedes a strong finish to the year.
Connecting all this history makes me both prepared for a fresh pullback to test the August lows and eager to buy dips. Moreover, I cannot get bearish after seeing the market’s ability to recover from August’s plunge toward oversold conditions with important technical breakouts. Staying neutral feels like the right balance as we stare down a month that can deliver outlier sell-offs. In other words, I am less interested in anticipating the next pullback and more interested in buying that pullback.
The bulls also got a boost from earnings expectations. According to FactSet, analysts raised quarterly earnings estimates for the first time in 2 years. The overall expectation for 2023 and 2024 (calendar year) earnings looks like it has bottomed. This potential trend reversal raises the attractiveness of buying dips ahead of Q3 earnings reports starting in October.
Insight/2023/09.2023/01-change-in-s%26p-500-quarterly-eps-first-2-months-of-quarter.png?width=1008&height=576&name=01-change-in-s%26p-500-quarterly-eps-first-2-months-of-quarter.png)
If I am right that the major indices press the limits of a sentiment shift, then a pullback could start as soon as this week. However, I am guessing buyers will be able to dissuade most selling pressure until Apple (AAPL) broadcasts its major product event on September 12th.
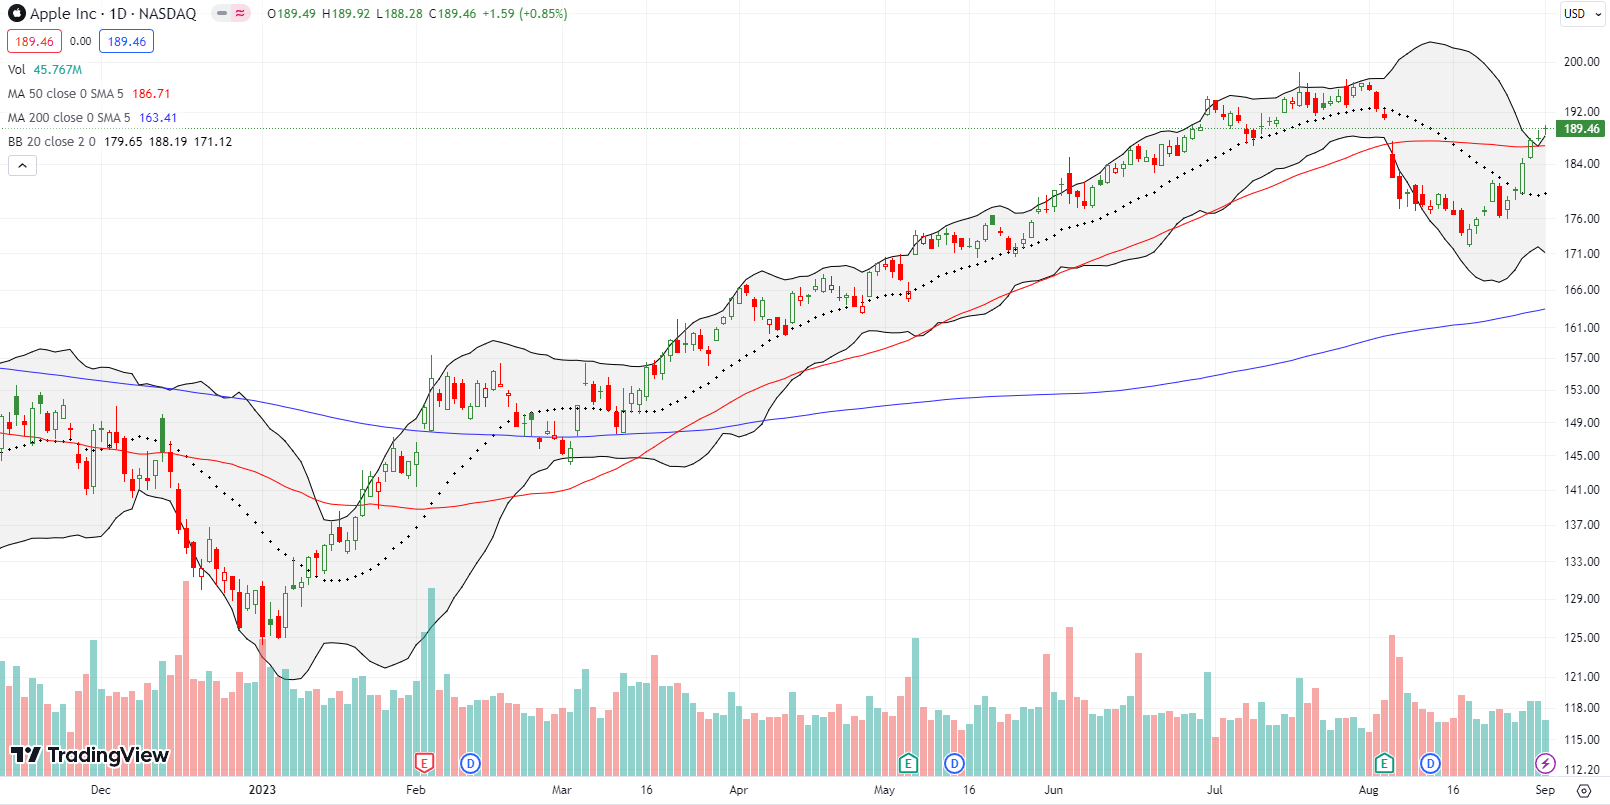
Indeed, AAPL confirmed a 50DMA breakout last week and confirmed my assumption that the stock would bias higher going into September 12th. I started my trade with a calendar call spread, assuming AAPL would stall last week around the 50DMA. I had to exit the trade with a tiny profit after the breakout. I will look for a fresh entry in the coming week. Note how AAPL is leading the “press the limits” theme for the indices.
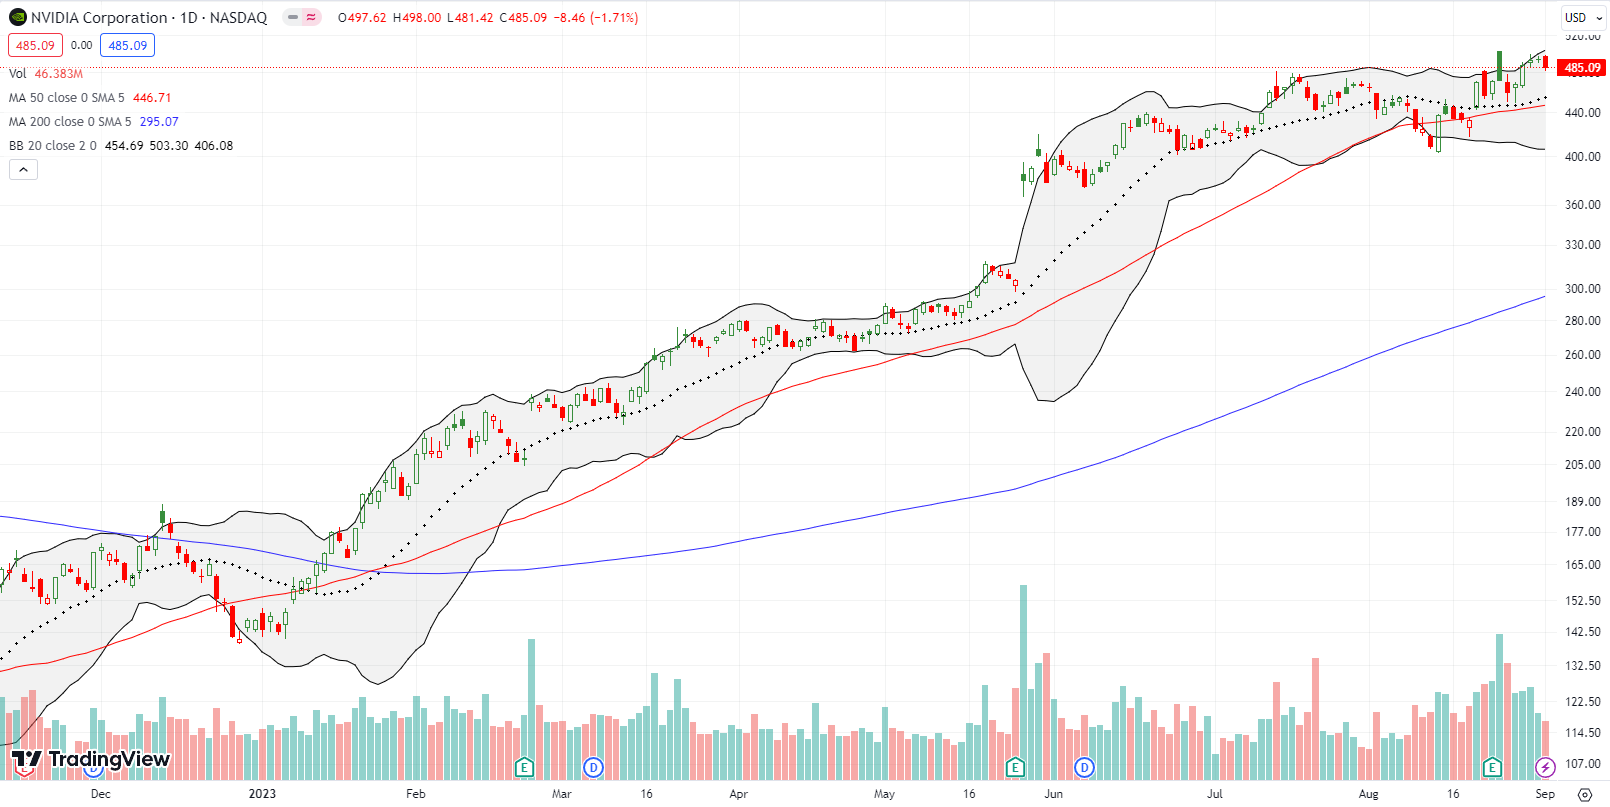
NVIDIA Corporation (NVDA) has followed along its upper Bollinger Band for much of the last week and a half. Earnings briefly interrupted the “press the limits.” A joint announcement with Alphabet on September 29th revived the press to the upper BB. So, Friday’s tiny pullback looks like a speedbump to yet higher prices. From the press release:
“In a fireside chat at Google Cloud Next, Google Cloud CEO Thomas Kurian and NVIDIA founder and CEO Jensen Huang discussed how the partnership is bringing end-to-end machine learning services to some of the largest AI customers in the world — including by making it easy to run AI supercomputers with Google Cloud offerings built on NVIDIA technologies. The new hardware and software integrations utilize the same NVIDIA technologies employed over the past two years by Google DeepMind and Google research teams.”
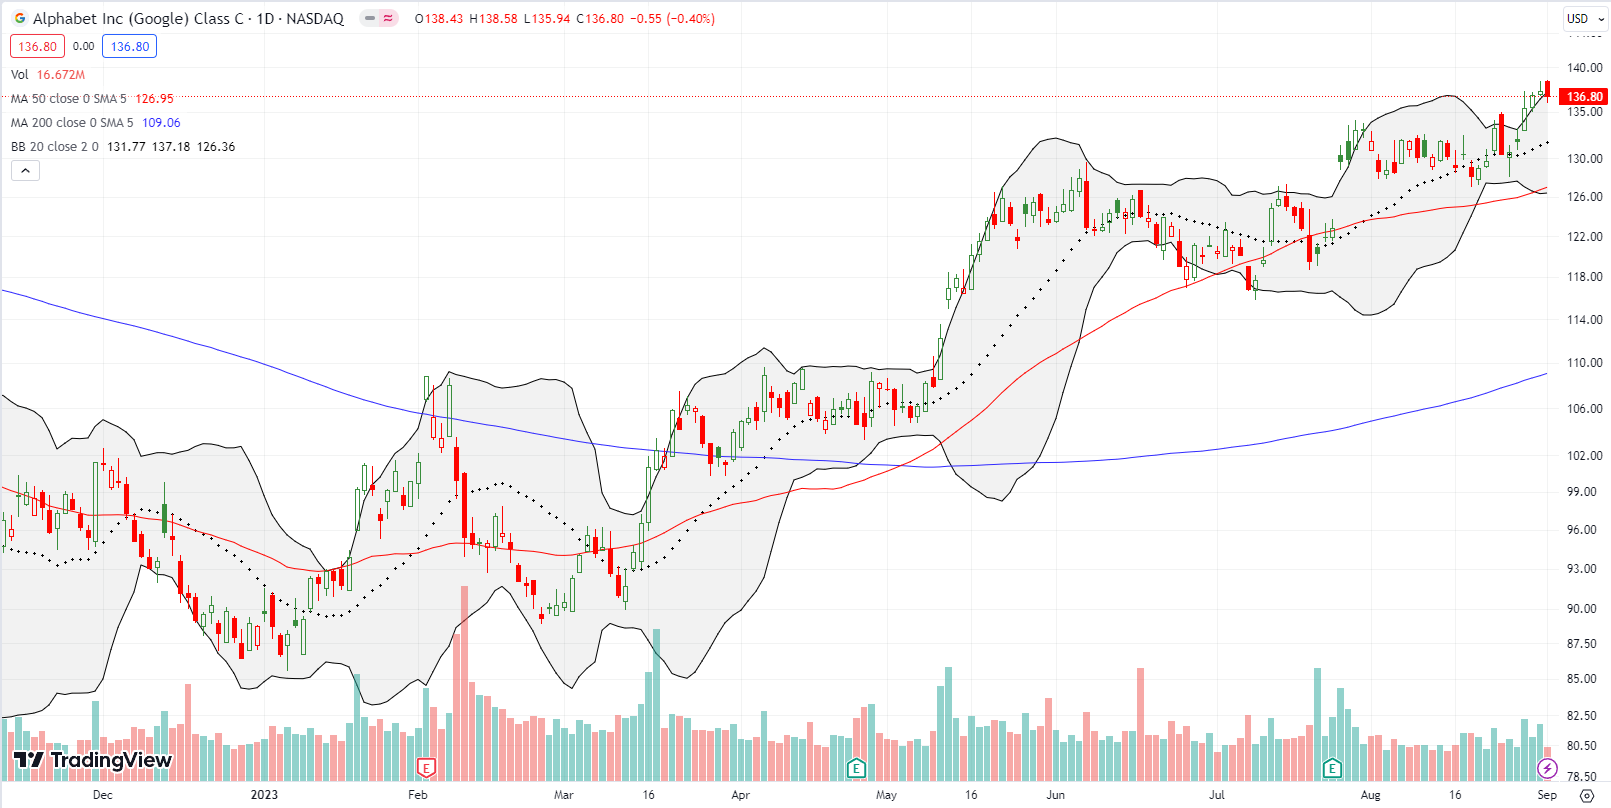
With events like Google Cloud Next blanketed by AI announcements, Alphabet Inc (GOOG) is slowly but surely taking back the AI momentum from Microsoft (MSFT). GOOG pressed against its upper Bollinger Band the last 4 trading days and hit a 17-month high. MSFT meanwhile is fighting to break through 50DMA resistance.
I jumped into a GOOG calendar call spread at the breakout on the 29th. I was hoping to hold the long side going into this week, but the stock’s steady climb motivated me to take a small profit and look to refresh a position once the stock has cooled a bit. (Recall that my generative AI trade has me aggressively trading GOOG).
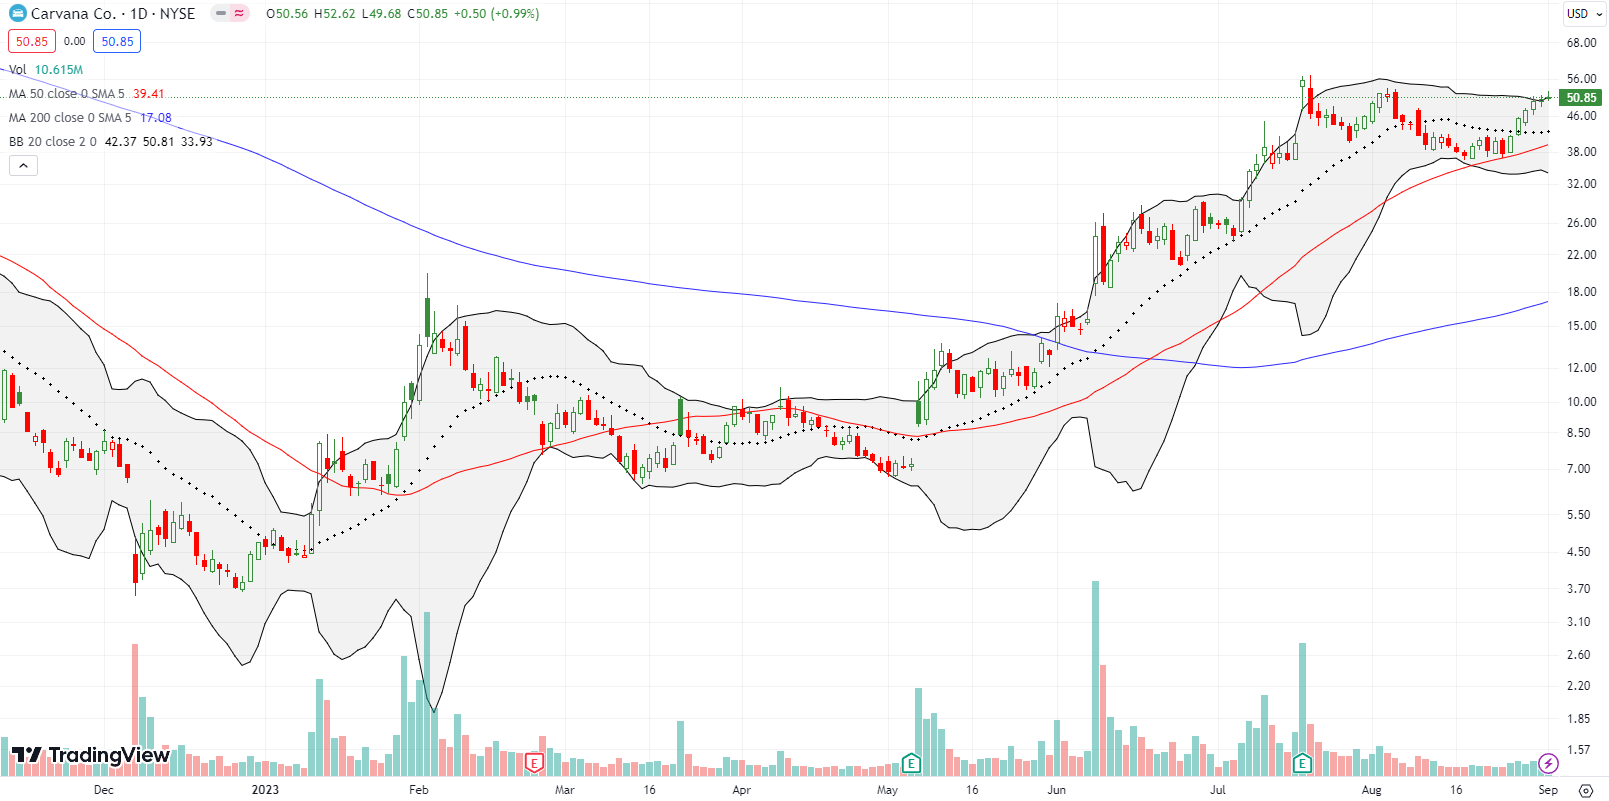
Even online used car dealer Carvana Co (CVNA) participated in the “press the limits” theme. When the stock market teetered on a journey to oversold conditions, I was sure CVNA would break through 50DMA support. With great anticipation I hopped into a put spread, and the rest is history. I missed a picture-perfect rebound off 50DMA support. Now with CVNA pressing against a triple threat of two previous highs and its upper BB, I am tempted once again to bet on put options…
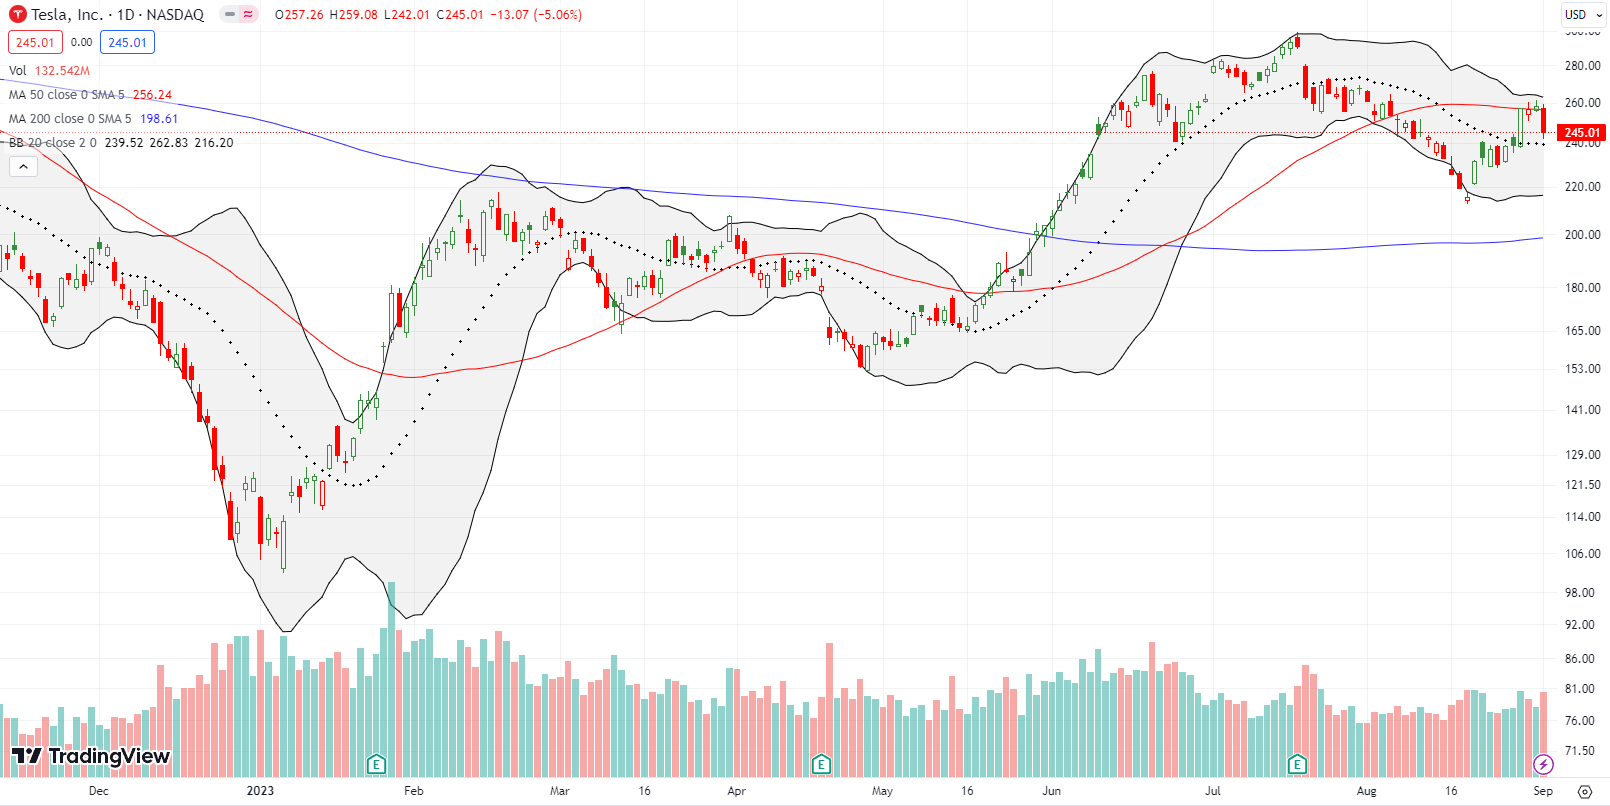
Surprisingly, Tesla, Inc (TSLA) was not up to the challenge of holding its 50DMA breakout. News of more price cuts weighed on the stock enough to cause a 5.1% decline and a 50DMA breakdown. TSLA was the rare failure at the limits. Sentiment must be souring on TSLA all over again. So if price somehow manages a fresh 50DMA breakout, I want to chase the contrary move aggressively.
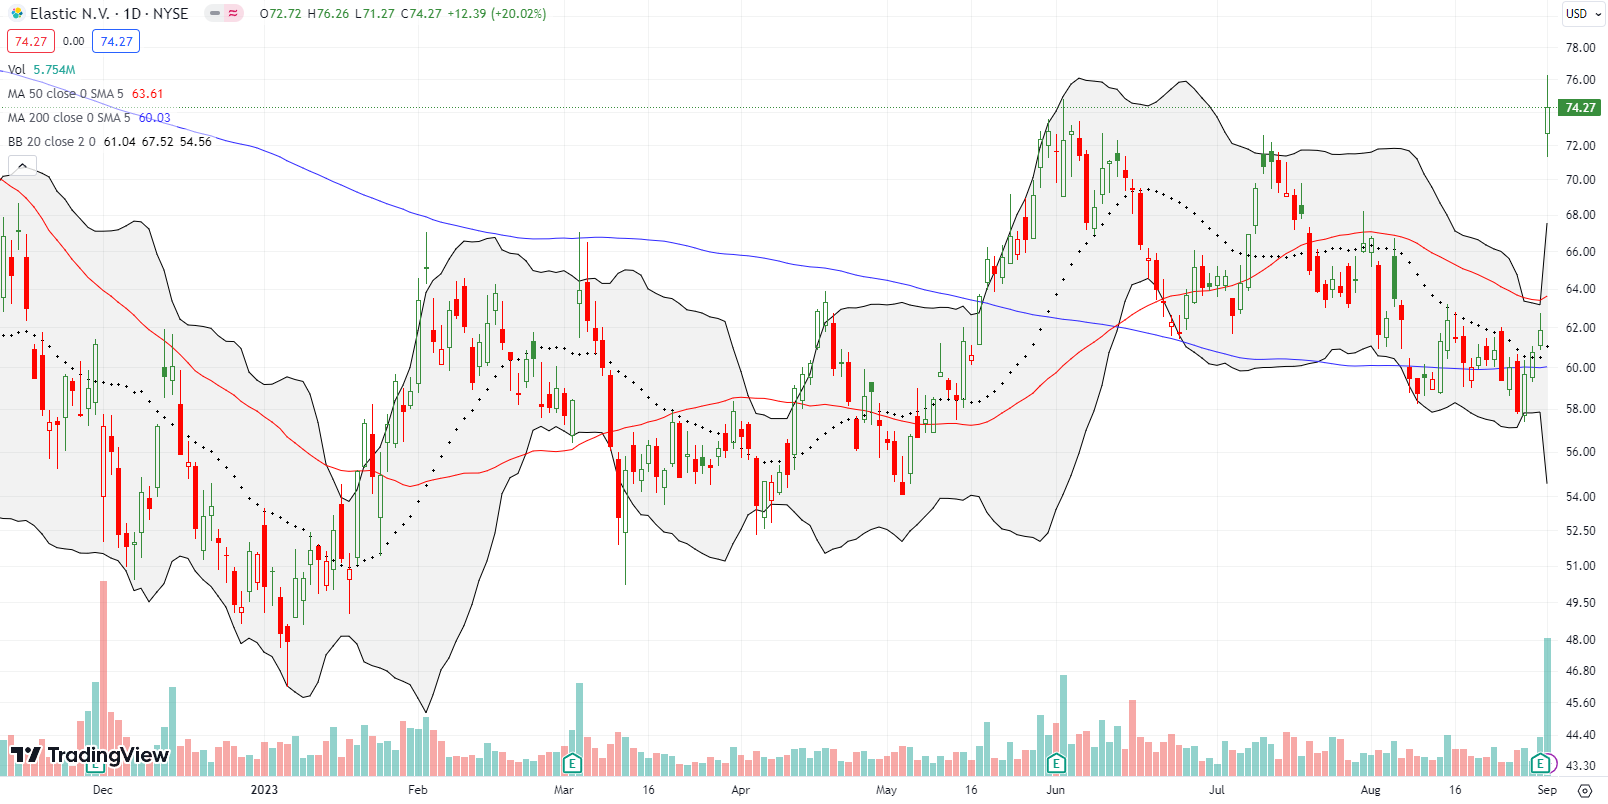
Data analytics software company Elastic NV (ESTC) is one of the few SaaS stocks I determined to just hold while it grows into its valuation and beyond. Friday’s 20.0% gain took the stock to an 11-month high. The stock is still worth 60% of its all-time high from 2021 and 40% down from where I first bought it (not including the call options I sold against the position).
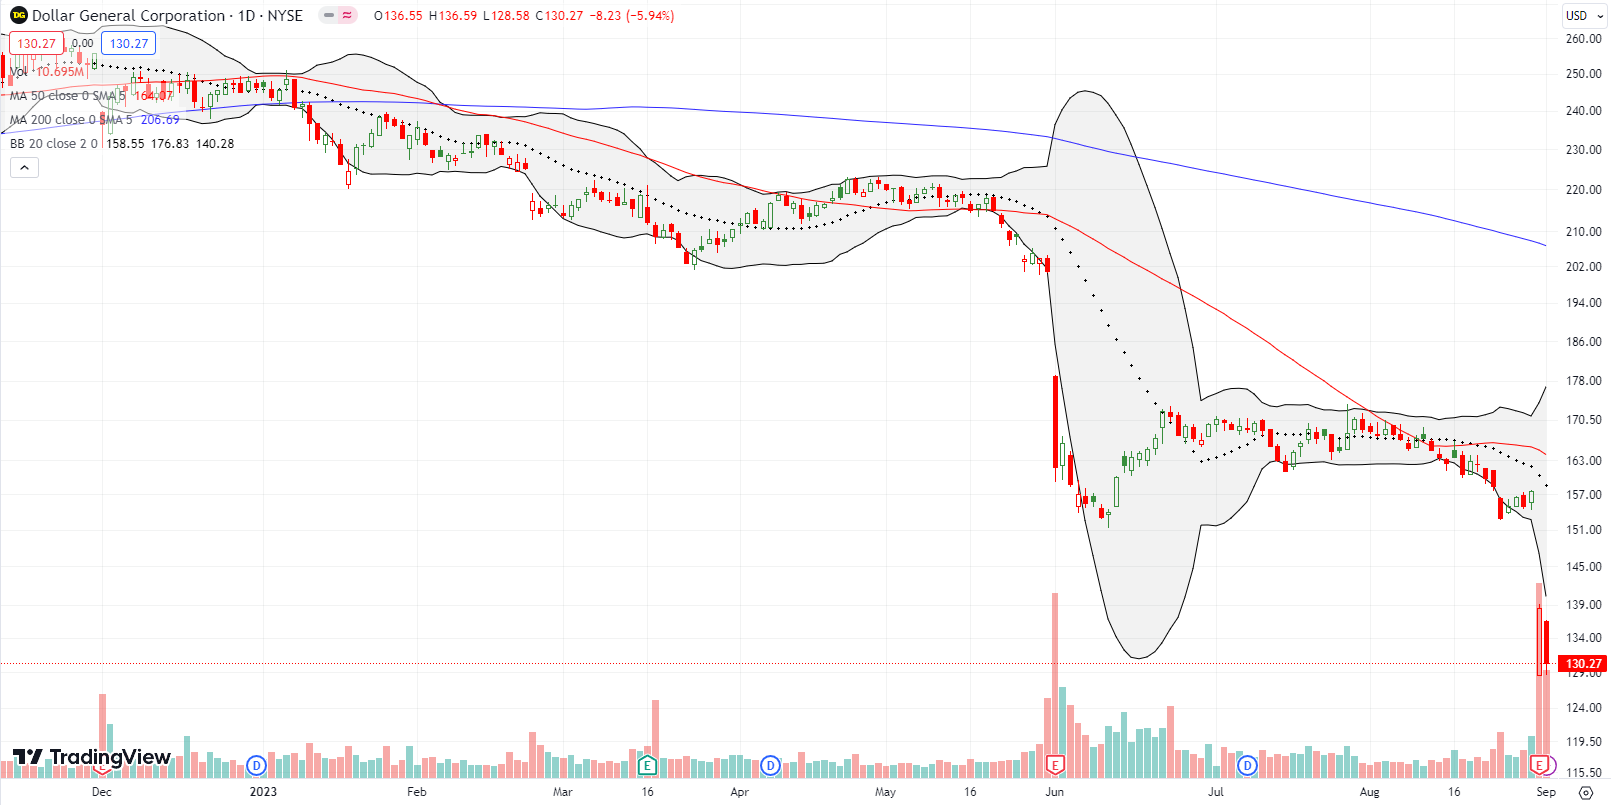
Dollar General Corporation (DG) collapsed last week 12% post-earnings. The stock zipped right past its pandemic closing low and finished the week at prices last seen in June, 2019. This stock looks severely broken and has scared me away from trying to flip another dip in budget retail competitor Dollar Tree (DLTR). DLTR plunged 12.9% post-earnings the previous week.
Be careful out there!
Footnotes
Subscribe for free to get email notifications of future posts!
“Above the 50” (AT50) uses the percentage of stocks trading above their respective 50-day moving averages (DMAs) to measure breadth in the stock market. Breadth defines the distribution of participation in a rally or sell-off. As a result, AT50 identifies extremes in market sentiment that are likely to reverse. Above the 50 is my alternative name for “MMFI” which is a symbol TradingView.com and other chart vendors use for this breadth indicator. Learn more about AT50 on my Market Breadth Resource Page. AT200, or MMTH, measures the percentage of stocks trading above their respective 200DMAs.
Active AT50 (MMFI) periods: Day #79 over 20%, Day #53 over 30%, Day #4 over 40%, Day #14 under 50%, Day #19 under 60%, Day #22 under 70%
Source for charts unless otherwise noted: TradingView.com
Full disclosure: long ESTC shares and short an ESTC call option, long TSLQ, long TSLA call
FOLLOW Dr. Duru’s commentary on financial markets via StockTwits, Twitter, and even Instagram!
*Charting notes: Stock prices are not adjusted for dividends. Candlestick charts use hollow bodies: open candles indicate a close higher than the open, filled candles indicate an open higher than the close.


