

Bearish Engulfing the Major Indices
The stock market took a decidedly bearish turn right at the edge of Jackson Hole. In particular, the NASDAQ (COMPQ) printed a bearish engulfing pattern right at resistance from its 50-day moving average (DMA) (the red line in the chart below) and its 20DMA (the dotted line).
")
The S&P 500 (SPY) mimicked the NASDAQ’s bearish turn. The index had its own bearish engulfing pattern created right at the convergence of 50DMA and 20DMA resistance.
")
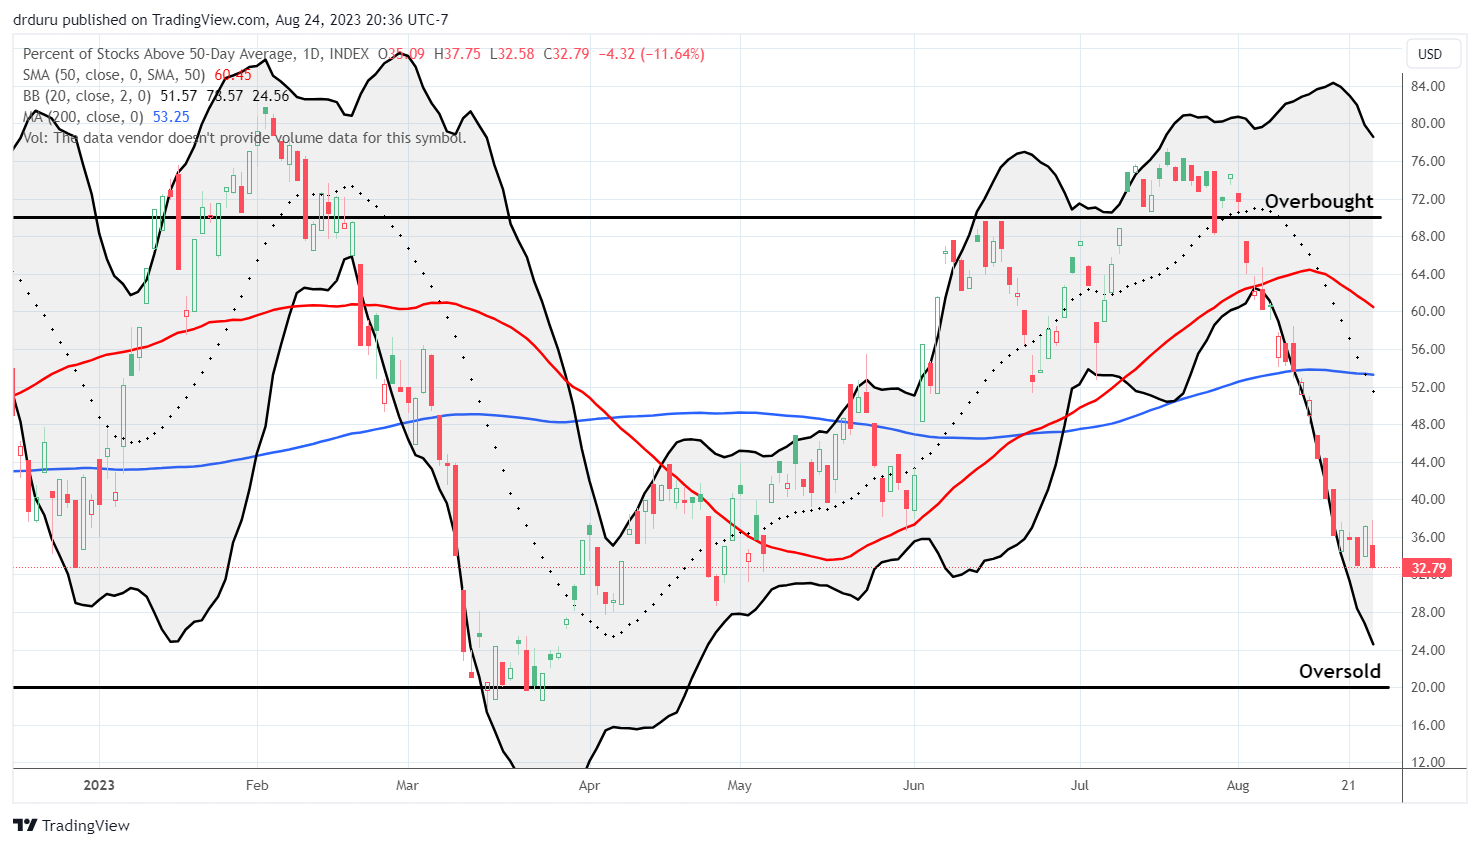
With these bearish turns, my favorite technical indicator takes on increasing importance. AT50 (MMFI), the percentage of stocks trading above their respective 50DMAs, reversed to a new (marginal) 4-month low. AT50 looks set to bumrush oversold trading conditions. Will Jerome Powell grease the skids with his upcoming speech at Jackson Hole? Or will he ignite a “close enough to oversold” bounce? I dare not predict. Instead, I will be ready to respond next week.
Swingtradebot
I further explore the bearish implications of the bearish engulfing patterns using Swingtradebot in the video below.
YouTube Transcript augmented by ChatGPT for clarity and readability
Introduction: A Quick Analysis of Today’s Stock Market
Oh man, the stock market was ugly today, particularly into the close. I wanted to create another quick video using Swing Trade Bot to show you how to quickly understand what the market is doing.
Section 1: Overview of Swingtradebot’s Homepage
Here’s the home page again. Since I’m a subscriber, some of the things I do may not be available in the free version, but I highly encourage you to subscribe. This is the home page, and if I go to research, I can get the general market overview.
Section 2: Analyzing Market Trends
What should stand out to you right away is that the midterm and short-term trends are down for all the major indices. Oh my goodness, it’s ugly! Decliners today were huge compared to advancers, and this bar chart shows how many more bearish signals there are than bullish signals. It also reveals how many more new lows are happening compared to new highs, and it’s gotten pretty extreme.
Section 3: Examining Technical Indicators
When I see all this red, I want to know how extreme the selling is. Check out the percentage of stocks above their 50-day moving averages. When I write about this technical indicator, I call it AT50 (for “above the 50”). It’s my favorite technical indicator because I love following market breadth. You can see here that after a small pop that matched my expectations, the market was ready for balance. Unfortunately, the balance was very brief, and this indicator came right back down to 33.9 percent. It’s getting extreme for me; when it gets down to 20, it’s oversold. The site calculates the indicator a little differently from the one I use on Trading View. Check out my blog at doctordo.com/122 to see how I deal with this.
Section 4: A Closer Look at Bearish Patterns in the NASDAQ
The homepage is great for giving you a quick overview of what’s happening in the market. Now, a feature that caught my eye on the NASDAQ was the bearish engulfing pattern. You can hover over the chart symbol to get a quick view of what the daily chart looks like. For the NASDAQ, the pattern is even more perfectly bearish because the NASDAQ tapped right at the 50-day moving average. Then the faders and sellers rocked the market. What makes this a bearish engulfing pattern is that the intraday high was above the previous day’s high, and we closed below the intraday low of the previous day. This is even more significant when it’s at some sort of resistance level, especially when resistance has converged between the 50-day moving average and the 20-day moving average. This situation is incredibly bearish.
Section 5: Identifying Stocks with Bearish Engulfing Patterns
I can now do a deep dive and say, “You can see all the signals that triggered today for the NASDAQ.” The bearish engulfing one is here, so I’m going to click on that and see what kind of stocks also had bearish engulfing patterns. Sure enough, you’ve got nine pages of stocks with that pattern. What’s great about Swing Trade Bot is that you can combine scans. I want a bearish engulfing pattern and stocks that faded right from the 50-day moving average resistance. These will essentially be the most bearish of all stocks for the day. By using very restrictive filtering, there are only six candidates. I can then quickly scan for some candidates.
Section 6: Shortlisting and Watchlisting Bearish Stocks
Among the stocks I found, Asana, Ciena, Smartsheet, and Semtech Corporation look bearish. I can add them to my bearish watch list. I can also add specific notes about the stocks to remind myself why I added them. This helps me keep track of my bearish “herd of bears.”
Section 7: Final Thoughts and Conclusion
Take Two Interactive and Z Scalar also look bearish, but I’ll be careful with my selection to avoid any surprises like acquisition news. Before adding them to the watch list, I’ll just remind you that none of these setups are guaranteed, so if you do enter into these trades, you want to have a well-defined stop.
I hope this has been helpful for you. Subscribe to my YouTube channel for more of these tutorials and other trading action. I’m a big fan of the stock market, and I love telling stories about it. Be careful out there, and I’ll see you sometime soon!
Be careful out there!