

Housing Market Intro and Summary
June’s housing market showed some evidence of slight cooling with the Spring selling season in its late stages. July’s housing data showed a widening divergence in fortunes between an on-going decline in existing single-family home sales and resilient activity for new single-family homes. Enveloping both markets are elevated pricing pressures. A sudden plunge in sentiment among home builders, partially attributed to increasing affordability pressures, suggests that new home activity may soon get weighed down by existing home market activity and stubbornly high mortgage rates. Overall, the data suggest the housing market is on the edge of an important turning point…within just two months of the seasonal start of strength in home builder stocks.
Housing Stocks
In my last Housing Market Review I claimed that iShares US Home Construction ETF (ITB) was not likely to continue higher at its pace at the time. Sure enough, ITB topped out and soon had its worst day since the October, 2022 lows. A 4.3% plunge sliced ITB right through its formerly reliable support at its 50-day moving average (DMA) (red line below). While ITB has since recovered, I do not expect a resumption of the previous uptrend given the latest set of housing data.
")
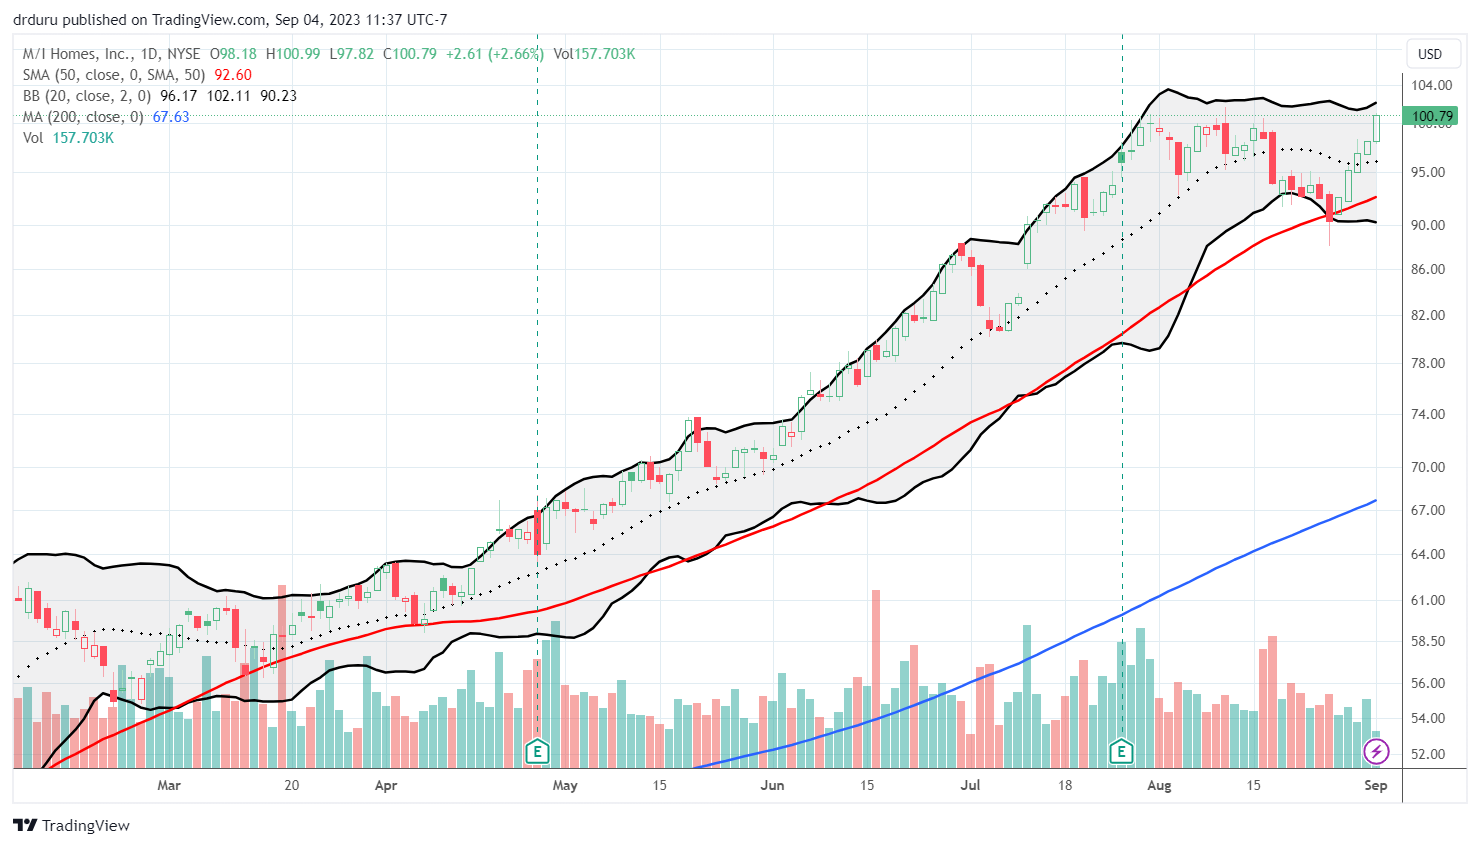
M/I Homes (MHO) emerged from the latest correction as one of the strongest home builders in the cohort I track. MHO successfully tested its 50DMA support in late August. The subsequent rebound has taken MHO to a new all-time closing high. This exceptional strength provides an interesting counter to my expectation of a short-term topping in ITB.
Strong investor sentiment in the housing sector continues despite the increasing headwinds putting the market on the edge. Last week, Bloomberg noted analysts were as bullish as ever on homebuilder stocks:
“Wall Street price targets show an expected return potential of 16% over the next 12 months for US homebuilders, ahead of the 13% seen for the broader market and the tech-heavy Nasdaq 100 Index (^NDX). That’s on top of 2023’s 47% surge in builders’ stocks, which has already surpassed the Nasdaq’s 41% climb.”
I am quite surprised by the unrelenting bullishness given mortgage rates convincingly broke out above the 7% level and are now at levels last seen 22 years ago. The chart later in this post shows mortgage rates may also be in the middle of a new uptrend. Since analysts are expecting rates to stabilize, a continue run-up in rates could send analysts into a quick retreat and take home builder stocks down with them. In other words, in the coming weeks and maybe months the housing market is all about rates on the edge of a sustained breakout.
Housing Data
Home Builder Confidence: The Housing Market Index – August, 2023
The relentless rebound in home builder confidence came to screeching halt in August. This plunge was the biggest news of the month across the housing data I track. While home builder stocks somehow managed to rise on the day anyway (ITB gained 0.7%), I think the setback greased the skids for the subsequent 2 days of selling in the stocks of home builders. ITB sold off 6.2% over those two days. The stocks further surprised me by holding the lows around that level before reversing almost all those losses by the end of the month.
In June, the National Association of Home Builders (NAHB)/Wells Fargo Housing Market Index (HMI) entered positive sentiment territory (over 50) for the first time in almost a year. HMI increased from 55 in June to 56 in July, a 13-month high. HMI dropped back to 50 in August and thus has a tenuous hold on staying out of negative territory.
In June and July, the NAHB offered potential inflation-fighting remedies for housing markets. The industry group noted in this latest report that “shelter inflation is up 7.7% from a year ago and accounted for a striking 90% of the July Consumer Price Index reading of 3.2%.” They blamed rising prices for declining foot traffic and pointed to the end of a 4-month decline in pricing incentives as evidence of fresh affordability pressures on home buyers. Yet, “demand for new construction continues to be supported by a lack of resale inventory.” This base of support is also helping home builders thrive even in the recessionary environment for housing.
/Wells Fargo Housing Market Index (HMI) and the University of Michigan Index of Consumer Sentiment")
Source for data: NAHB and the University of Michigan
The HMI bottomed 5 months after consumer sentiment. Earlier, I thought consumer sentiment had topped out and would cap HMI as well. Instead, HMI looks like it has helped pull consumer sentiment upward. My expectations for a topping out in housing activity and home builder stocks seems supported by the parallel declines in the HMI and consumer sentiment.
The decline in HMI was broad-based across the components. Each one declined significantly from July’s levels.
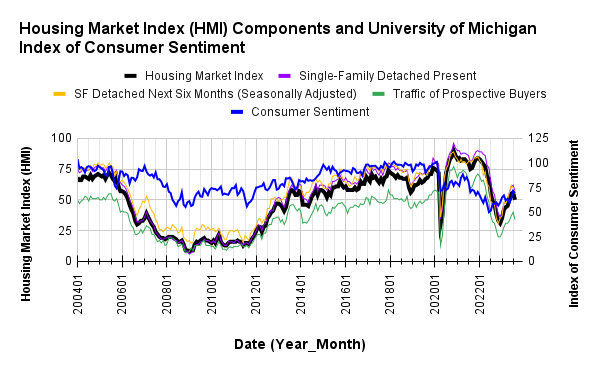
The regional HMIs all took big hits but severity varied. After just having joined the South and the Northeast above 50, the West fell to 46 and below May’s reading. The South also fell below its May reading. These regions are the two most important for housing activity, so the sharp declines in the West and South augur poorly for overall HMI in coming months. The Midwest fell exactly to its May level. The Northeast is still at its second highest sentiment reading of the year.
New Residential Construction (Single-Family Housing Starts) – July, 2023
Given May’s surge in housing starts, June’s cooling in starts looked unsurprising. However, starts promptly rebounded in July. Housing starts increased 6.7% month-over-month to 983,000. Starts soared 9.5% year-over-year. June’s starts were revised downward to 921,000. I am still looking to 1M as a ceiling on starts until the cycle begins to prepare for the 2024 spring selling season. The plunge in HMI all but seals the deal on a 1M cap for starts.
![US. Bureau of the Census, Privately Owned Housing Starts: 1-Unit Structures [HOUST1F], first retrieved from FRED, Federal Reserve Bank of St. Louis, August 27, 2023](https://drduru.com/onetwentytwo/wp-content/uploads/2023/08/20230827_Housing-Starts.png "Housing starts")
Building permits in July generated a fifth consecutive monthly increase with a 0.6% gain (June’s monthly gain was revised slightly upward to 2.4%). The sequential growth slowed significantly and aligns with the changing fortunes for builder sentiment.
After being the only region with a year-over-year increase in single-family starts in June, the Northeast flipped as the only region with a year-over-year decline in July. The South was the only region with a month-over-month decrease in starts. Housing starts in the Northeast, Midwest, South, and West each changed -21.9%, +20.0%, +6.1%, +23.6% respectively year-over-year.
New Residential Sales (Single-Family) – July, 2023
New home sales crushed expectations by almost 100,000 in May. After a dip in June, the uptrend resumed in July with a 4.4% month-over-month gain and 31.8% year-over-year surge. The 714,000 new homes sold is a 17-month high. June’s 697,000 sales were revised downward to 684,000. The comparables are still favorable given the trough a year ago. The on-going uptrend from the July, 2022 bottom and the 17-month high stand as a testament to the sales pivots builders collectively accomplished in the face of rapidly increasing mortgage rates. With rates above the 7% level, I still expect new home sales to flatten out in the near-term. The plunge in builder confidence suggests a flattening is in store.
![US. Bureau of the Census, New One Family Houses Sold: United States [HSN1F], first retrieved from FRED, Federal Reserve Bank of St. Louis, September 1, 2023.](https://drduru.com/onetwentytwo/wp-content/uploads/2023/09/20230901_New-Home-Sales.png "new home sales")
The median price jumped 4.8% from June to $436,700, still an 8.7% year-over-year decrease. While the year-over-year changes continue to trend downward, July’s big price jump offers the prospect of a bottom in prices.
Prices have significantly cooled from the mania of the pandemic housing bubble, but July’s price mix was a bit confounding. The monthly surge in price was driven by a large increase in share of sales in the $400,000 to $749,000 price range (from 42% to 50%) with most of the share loss coming from the adjacent price ranges. The year-over-year price decline was helped by a large decline in share of homes priced above $500,000, from 46% to 34%. A transition in mix could be underway, but it is difficult to tell which narrative will dominate.
The inventory for new homes fell to 7.3 months of sales from 7.4 in June. While the market remains above the 6.0 level characteristic of a balanced market, absolute inventories only increased slightly from 432,000 to 437,000.
All four regions surged in sales year-over-year with the South gaining the least. The Northeast, Midwest, South, and the West changed 43.5%, 58.5%, 17.5%, 60.2% respectively.
Existing Home Sales – July, 2023
Signs of a slowing market for existing homes appeared in July. However, the mix of changes in the key data leave some doubt as to which trends will dominate in coming months. Perhaps unsurprisingly, the National Association of Realtors (NAR) provided little color commentary for July’s data.
For the first time this year, the median sales price of an existing home fell month-over-month. The 0.8% price drop is minimal but is finally consistent with the Federal Reserve’s effort to cool off demand AND price in the housing market overall. Still, the median price increased 1.9% year-over-year. Combined with higher mortgage rates, existing homes are as unaffordable as ever.
The seasonally adjusted annualized sales in July of 4.07M and decreased 2.2% month-over-month from the 4.16M in existing sales for June (unrevised). Year-over-year sales decreased 16.6%. The continued downtrend throws doubt on my expectations for stabilization. The second chart below shows that the current decline has taken existing single family homes, excluding condos and coops, back to levels below the pandemic low. Only the low from January of this year stands in the way of a new 12-year low in sales. Perhaps because they offer more affordability, sales of existing condos and coops look like they are stabilizing.

(For historical data from 1999 to 2014, click here. For historical data from 2014 to 2018, click here) Source for chart: National Association of Realtors, Existing Home Sales© [EXHOSLUSM495S], retrieved from FRED, Federal Reserve Bank of St. Louis, August 29, 2023

July’s absolute inventory of 1.11M homes increased 3.7% from June and decreased 14.6% year-over-year. According to the NAR, “unsold inventory sits at a 3.3-month supply at the current sales pace, up from 3.1 months in June and 3.2 months in July 2022.” While the spring selling season never generated enough inventory to loosen the market for existing homes, this one month jump failed to motivate more buying. The increases in months of supply is small but reflective of a potential market slowing. Recall that the NAR had been fond of saying that an increase in inventory would provide more options and motivation to buyers.
The significant demand pressures also released steam in the form of time in market. Homes stayed on the market for 20 days in July, up from 18 in June and May. The 74% of homes that sold within a month is down from the 76% in June.
Surprisingly, the share of sales to first-time home buyers surged to 30% from 27% in June. First-time home buyers are supposed to be most sensitive to price and early to exit from a tough market. Instead, they increased share in a month of declining health. Certainly the increase in share of more price snesitive and contemplative buyers could help explain the pullback in price and time in market. The NAR’s 2017 Profile of Home Buyers and Sellers reported an average of 34% for 2017, 33% for 2018, 33% for 2019, 31% for 2020, 34% for 2021, and 26% for 2022. The first-time buyer share for 2022 is the lowest on record for the NAR and the current trend points to that record breaking again.
As has been the pattern for most of the year, all regions declined significantly in sales year-over-year. The West was the only region to gain month-over-month. The regional year-over-year changes were: Northeast -23.8%, Midwest -20.0%, South -14.3%, West -12.5%.
No region experienced a year-over-year price decline. The West was the first region to flip negative in January, but the region was flat for July. The regional year-over-year price changes were as follows: Northeast +5.5%, Midwest +3.9%, South +1.7%, West 0%.
Single-family existing home sales decreased 1.9% from June and declined on a yearly basis by 18.8%. The median price of $412,300 was up 1.6% year-over-year and down 0.8% month-over-month for single-family existing home sales.
California Existing Home Sales – July, 2023
Sales of existing single-family homes in California declined 3.0% from June to July and declined 9.0% year-over-year to 269,180. July’s median home price decreased 0.7% from June but held above $800,000 for the fourth month in a row. The median price is now up 0.2% year-over-year. The month-over-month price change on a square footage basis decreased from $411 a year ago to $409 (a 0.5% decrease). California metro areas dominated the bottom of the list of U.S. metro areas for year-over-year price changes. The San Francisco – San Mateo – Redwood City area fell 12.2% according to the Federal Housing Authority (FHA).
The Unsold Inventory Index (UII) fell 19.4% year-over-year and increased 13.4% month-over-month, a second monthly increase. The inventory changes varied widely by price ranges with the year-over-year UII declines below the $1M selling price still showing the crush for more affordability. Note that UUI was relatively stable across the board from May to June. The CAR reported: “The unsold inventory index (UII) in all price ranges declined by double-digits from a year ago in July, with the mid-price segment of $750,000-$999,000 dipping the most by -25.8 percent year-over-year. The $500,000-$749,000 price range (-20.0 percent) posted the second largest decline from last year, followed by the sub-$500,000 (-18.8 percent) and the $1 million price segment (-16.1 percent). All price ranges experienced a monthly increase in their UII from June, primarily due to weaker sales in July.”
Active listings still look like they have bottomed even with the year-over-year plunge of 30%.

Source: Realtor.com, Housing Inventory: Active Listing Count in California [ACTLISCOUCA], retrieved from FRED, Federal Reserve Bank of St. Louis; September 1, 2023.
The on-going competitiveness in the market can be seen from the 16-day average time to sell a home, down from 18 days a year ago although up 1 day from June. The statewide sales-price-to-list-price ratio stayed flat for the third month in a row at 100.0%.
Home closing thoughts
Mortgage Lending Wakes Up in Q2
The current cooling in the housing market makes the strength of Q2 feel like a distant memory. Still, it is is helpful to appreciate that strength as it suggests that market could soar again with small downward moves in rates and on-going strength in the jobs market. In Q2, the total number of mortgages secured by residential property soared 23% from Q1, the largest quarterly increase in two years according to ATTOM. These numbers include residential mortgages for 1 to 4 unit buildings and are down 38% year-over-year.
This jump in mortgage activity accompanied a quarterly 1.7% increase in house prices according to the Federal Housing Authority (FHA). Prices also increased year-over-year by 3.0% which maintains a streak in place since 2012.
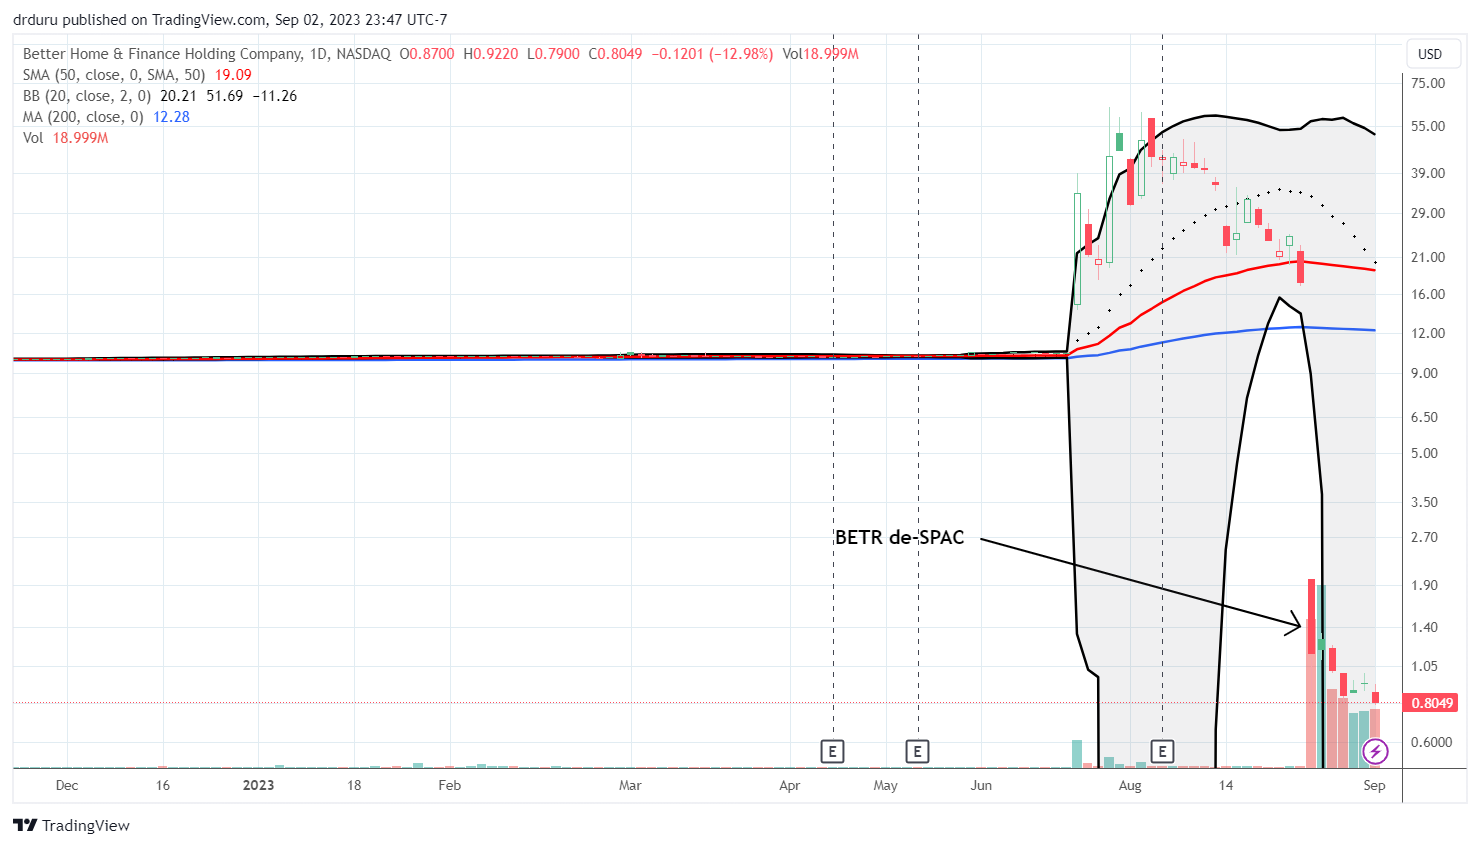
The Bizarre Case of Better Home & Finance Holding Company (BETR)
Digital mortgage lender Better.com (BETR) went public via SPAC on August 27th. The resulting stock blew up from there. The chart below says it all. Apparently, the poorly timed IPO was forced because the company needed to secure $550M from Softbank. That money better be enough to ride out the poor lending environment because it is likely the last funding the now money-losing company will get until rates drop significantly.
Spotlight on Mortgage Rates
The Mortgage Bankers Association (MBA) reported a weekly decrease in mortgage applications 3 straight weeks in August. The last week delivered an increase despite the breakout in mortgage rates. These dynamics follow another year-over-year surge in mortgage applications in July for new homes. The 35.5% increase reflects an on-going shift in housing activity away from existing homes and toward new homes. Given what looks like a breakout in mortgage rates above the 7% level, a 22-year high, I strongly suspect an imminent slowdown even in mortgages for new homes.
![Source: Freddie Mac, 30-Year Fixed Rate Mortgage Average in the United States [MORTGAGE30US], retrieved from FRED, Federal Reserve Bank of St. Louis, September 4, 2023](https://drduru.com/onetwentytwo/wp-content/uploads/2023/09/20230904_30-Year-Fixed-Rate-Mortgage-Average-US.png)
Be careful out there!
Full disclosure: long ITB