

Housing Market Intro and Summary
The spring selling season housing market looked “defiant” going into the end of a cycle. In June, the housing market looks like it refuses to let the cycle end as it sails past the expected sunset. New home sales and housing starts surged as the market for existing homes barely responds to demand pressures. A sustained bottom for the recession in housing seems to be in place even as declining affordability pushes buyers into smaller homes and lower price ranges. Economists, pundits, and analysts observe this economic swirl with increasing levels of bewilderment. The forecast misses for May were particularly stark. Now, a slow recovery in housing prices promises to sail the market further beyond the sunset. In turn, the prospects of a new dawn for housing should inject more bewilderment into the economic calculations.
The spring selling season has come to an end. However, the buying pressures seem set to continue well into the summer. In the meantime, investors in housing related stocks, especially the home builders, are scrambling to catch up with this economic reality. The price patterns in many related stocks reflect the classic FOMO (fear of missing out) that comes with a buying panic. It only took home builder stocks about two months to recover from the buying panic in February that marked a short-term top. A recovery this time around may be complicated by the onset of the NEXT seasonally strong period for the stocks of home builders! “In other words, 2023 may become an “anomaly year” in which the typical rhythms of the housing market take a backseat to a unique convergence of market forces.
Housing Stocks
The uptrend in iShares US Home Construction ETF (ITB) resumed in June. The sunset for May featured a picture-perfect test of support at the 50-day moving average (DMA) (the red line in the chart below). ITB bounced the next day by 1.4% and sailed on without looking back. Housing bears who placed bets on a deeper correction by July were left at the docks. ITB sailed on through one positive data point after another. ITB now trades at an all-time high and is up 40.0% for the year.
")
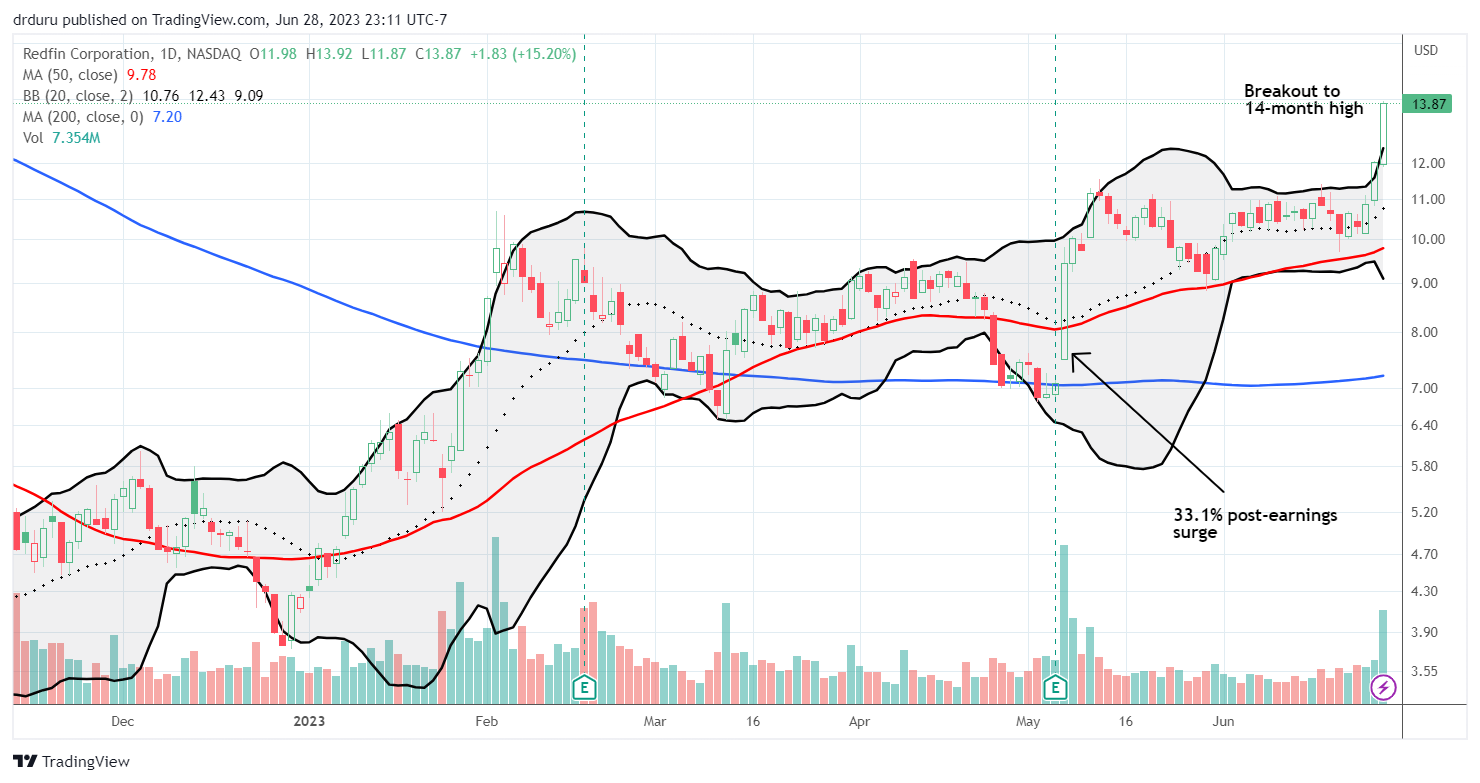
With all the bullish signals flashing as strong as ever, I decided to get “cute” and take a small break from my perma-bullish attitude toward housing-related stocks. I analyzed the data on Redfin (RDFN) and concluded that the market got ahead of itself after the company reported earnings in May; RDFN soared 33.2% in the immediate wake of earnings. My short-term “sell” rating looked OK until RDFN broke out this week in sympathy with the home builders sailing further past the sunset. While I think I made a correct read on the data (for example, new homes are leading the market and Redfin does best with existing home sales), the RDFN price action judges me quite wrong! I now eagerly look forward to earnings in August to see whether the data also judge me wrong. RDFN is up a whopping 227% year-to-date.
Housing Data
New Residential Construction (Single-Family Housing Starts) – May, 2023
The housing market has surprised pundits and economists for a year. May’s surge in housing starts stunned them if the consensus expectations for 1.4M total starts also reflects a huge forecast miss for single-family starts. Housing starts soared 18.5% month-over-month to 997,000. Starts decreased 6.6% year-over-year. April’s starts were revised downward to 841,000. May’s jump effectively confirms the 800K level as support and even suggests the housing market is closer to ending its recession. For months, I have been watching the 800K level as a “normalized” base for starts dating back to 2016.
![US. Bureau of the Census, Privately Owned Housing Starts: 1-Unit Structures [HOUST1F], first retrieved from FRED, Federal Reserve Bank of St. Louis, June 22, 2023](https://drduru.com/onetwentytwo/wp-content/uploads/2023/06/20230622_Housing-Starts.png "Housing starts")
An on-going uptrend in permits continues to suggest that housing starts are not coming back down for the next several months or more. In February, these permits ended a year-long downtrend. Permits in May generated a third consecutive monthly increase with a 4.8% gain.
Every region enjoyed a month-over-month jump in starts except the West. The setback was made more stark given the West’s 59.5% month-over-month surge in April. Single-family starts in the South are no longer a concern or “on watch” with the May revival (up 21.0% year-over-year). Housing starts in the Northeast, Midwest, South, and West each changed +12.7%, +5.7%, -3.9%, and -24.5% respectively year-over-year.
Existing Home Sales – May, 2023
The sequential decline for existing home sales took a pause in May.
The seasonally adjusted annualized sales in May of 4.30M increased 0.2% month-over-month from the 4.29M in existing sales for April (revised slightly upward). Year-over-year sales decreased 20.4%. Existing home sales still look like they are stabilizing.

(For historical data from 1999 to 2014, click here. For historical data from 2014 to 2018, click here) Source for chart: National Association of Realtors, Existing Home Sales© [EXHOSLUSM495S], retrieved from FRED, Federal Reserve Bank of St. Louis, June 23, 2023

Inventory stayed above the 1 million mark. May’s absolute inventory level of 1.08M homes increased 3.8% over April and decreased 6.1% year-over-year. According to the NAR, “unsold inventory sits at a 3.0-month supply at the current sales pace, up from 2.9 months in April and 2.6 months in May 2022.” The spring selling season did not generate enough inventory to loosen the market for existing homes. In the previous two reports, the NAR noted the reemergence of multiple offers on homes. In this May report, the NAR recommended that the government introduce a tax break on capital gains from selling an investment property. While such a policy could increase inventory, such a benefit would mainly accrue to the wealthy and would do little to nothing to help the average home buyer who needs more affordable housing.
The chief economist of the NAR quipped during an interview with Marketplace that high rates are discouraging so many potential sellers that couples are even choosing not to divorce: “The couple may not like each other, but they love their 3% mortgage rate, so they don’t want to give that up.” I could not tell whether this was a joke, but it at least reflects the level to which the market has seized up on the supply side.
The market still exhibits significant demand pressures. Homes stayed on the market for an even shorter time, perhaps due to the increased interest that comes with the spring selling season. It took an average 18 days days to sell a home in May, down from 22 days in April. The average was 29 days in March, 34 days in February and 33 days in January. The 74% of homes that sold within a month is up from the 73% in April and 65% in March. The trends in these two metrics confirm a baseline of demand that should continue to contribute to market stabilization.
The median sales prices increased for a fourth straight month. The persistent price gains are somewhat of a surprise given the absolute increase in inventory, but the price pressures are consistent with the faster pace of sales. The ascent in prices have likely carved out a bottom in pricing trends. The median price of an existing home increased 2.6% month-over-month to $396,100 while decreasing 3.1% year-over-year. The year-over-year decline in February ended a record streak of 131 straight months of year-over-year increases. The new year-over-year downward streak will not last much longer as sequential price gains continue.
The share of sales to first-time home buyers decreased back to 28% from 29% in April but increased from 27% a year ago. So despite the affordability pressures, first-timers are staying resilient. The NAR’s 2017 Profile of Home Buyers and Sellers reported an average of 34% for 2017, 33% for 2018, 33% for 2019, 31% for 2020, 34% for 2021, and 26% for 2022. The first-time buyer share for 2022 is the lowest on record for the NAR.
All regions declined significantly in sales year-over-year. The South and the West managed to log sales gains from April. The regional year-over-year changes were: Northeast -25.4%, Midwest -20.8%, South -16.5%, West -25.5%.
Once again the regions were mixed in the pace of year-over-year price changes. The West was the first region to flip negative in January, and it has worsened ever since. This month, the South joined the West in price declines. The regional year-over-year price changes were as follows: Northeast +2.5%, Midwest +1.1%, South -2.7%, West -5.7%.
Single-family existing home sales decreased 0.3% from April and declined on a yearly basis by 20.0%. The median price of $401,100 was down 3.4% year-over-year and up 2.8% month-over-month for single-family existing home sales.
California Existing Home Sales – May, 2023
Just one month after the California Association of Realtors (CAR) slashed its forecast for California existing single-family home sales, the spring selling season drove a sudden surge in sales volume. After two months of sequential declines, sales surged 9.8% from April. Sales were still down 23.6% year-over-year. The rapid rebound generated a significantly tighter market. Per the CAR: “The housing market is stabilizing and even showing signs of improvement as competition is on the rise again; nearly half of homes are selling above asking price, fewer sellers are reducing listing prices, and homes for sale are going into pending status in just two weeks compared to more than 30 days early this year.”
Prices firmed up in response to the demand push. May’s median home price increased 3.0% from April to remain over $800,000 for the second month in a row. The median price is now at a 9-month high but down 6.4% year-over-year. The month-over-month price on a square footage basis increased from $395 to $409 (a 3.5% increase) and fell from $434 a year ago.
Demand also pressured inventory levels. The Unsold Inventory Index (UII) remained flat year-over-year while plunging 16% year-over-year following April’s 30% sequential decline. The inventory changes varied widely by price ranges with the year-over-year UII declines below the $1M selling price showing the crush for more affordability with the surge in mortgage rates. The CAR reported: “None of the price ranges except the $1 million and higher price sector recorded an increase in UII from a year ago. The unsold inventory index remained flat in the $500,000-$749,000 price range (0 percent) but dipped year-over-year in the $750,000-$999,000 sector (-9.1 percent) and the sub-$500,000 (-4.3 percent). The $1 million and higher sector recorded a gain in UII by 21.1 percent from last May.”
Note that the active listing count may have finally bottomed after a steady decline from the post-pandemic peak last year. Listings are still well below pre-pandemic levels.

Source: Realtor.com, Housing Inventory: Active Listing Count in California [ACTLISCOUCA], retrieved from FRED, Federal Reserve Bank of St. Louis; June 24, 2023.
The fresh competitiveness in the market can be seen from the 17-day average time to sell a home, down 3 days from April although up from 11 days a year ago. The statewide sales-price-to-list-price ratio stayed flat with April at 100.0%.
New Residential Sales (Single-Family) – May, 2023
New home sales crushed expectations by almost 100,000 according to the Briefing.com consensus across economists. That kind of miss is emblematic of just how much the housing market has confounded the experts even with home builders and other signals continuing to flag strength upon strength. New single-family home sales soared 12.2% to 763,000 from April’s 680,000 sales (revised downward from 683,000). New single-family home sales jumped 20.0% year-over-year for a second month in a row of double-digit gains. The comparables are easier given the trough a year ago. The on-going uptrend from the July, 2022 bottom is a remarkable testament to the sales pivots builders collectively accomplished even in the face of rapidly increasing mortgage rates. The recent stabilization of rates seems to be supporting a robust recovery.
![US. Bureau of the Census, New One Family Houses Sold: United States [HSN1F], first retrieved from FRED, Federal Reserve Bank of St. Louis, June 27, 2023.](https://drduru.com/onetwentytwo/wp-content/uploads/2023/06/20230627_New-Home-Sales.png "new home sales")
The median price increased 3.5% month-over-month to $416,300, a 7.6% year-over-year decrease (and just the second such decline of the housing recession). April’s median price was adjusted much lower meaning that April’s adjusted, year-over-year price decline of 12.2% far surpassed the worst of the pandemic. Prices last dropped this much during the Great Financial Crisis when the median price declined double-digits several times from 2008 to 2009. Clearly, this time is different as the price declines do not reflect an over-supply of homes. Instead prices have cooled from the mania of the pandemic housing bubble and buyers are shifting to lower-priced homes to deal with today’s higher rates.
Builders are accommodating the demand with smaller homes which also puts mix-driven pressure on pricing. While the mix of sales shifted slightly to higher priced homes on a sequential basis, the mix continues to shift significantly downward compared to a year ago. A year ago, 22% of sales occurred at $399,000 or below. For May that mix surged to 32%.
The inventory for new homes dropped to 6.7 months of sales, reflecting the strong pace of sales in May. While the market remains above the 6.0 level characteristic of a balanced market, inventories dropped from 433,000 to 428,000. This inventory squeeze comes at a time when the inventory of existing homes is barely responding to housing demand. Thus, I expect on-going upward pressure on aggregate price levels.
The West was the only region which failed to gain sales year-over-year. The other three regions surged over 20% with the Northeast in triple digits after a double-digit loss in April. The Northeast, Midwest, South, and the West changed 110.5%, 40.0%, 22.0%, and -0.6% respectively.
Home Builder Confidence: The Housing Market Index – June, 2023
It has been a long journey for home builder confidence. The National Association of Home Builders (NAHB)/Wells Fargo Housing Market Index (HMI) entered positive territory for the first time in almost a year. At the trough, sentiment matched the lows in the immediate aftermath of the onset of the pandemic. Now, home builders are climbing a V-recovery in sentiment.
The NAHB chose to take this moment to emphasize the importance of housing’s contribution to inflation. Accordingly, the industry group proposed several remedies to aid the Federal Reserve in its fight against inflation: “… such costs can only be tamed by building more affordable, attainable housing – for-sale, for-rent, multifamily and single-family. By addressing supply chain issues, the skilled labor shortage, and reducing or eliminating inefficient regulatory policies such as exclusionary zoning, policymakers can play an important and much-needed role in the fight against inflation.”
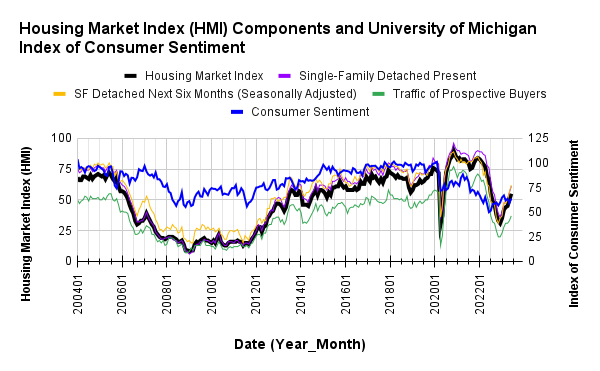
/Wells Fargo Housing Market Index (HMI) and the University of Michigan Index of Consumer Sentiment")
Source for data: NAHB and the University of Michigan
The HMI bottomed 5 months after consumer sentiment. Earlier, I thought consumer sentiment had topped out and would cap HMI as well. Instead, HMI looks like it is pulling consumer sentiment along for the ride. It now looks more likely that sentiment continues higher from here, especially with new home sales surging.
The SF Detached Present and Next Six Months (Seasonally Adjusted) continue to lead the way higher. They are now both above 60, levels not seen since last July and June respectively. The NAHB attributed these gains to a marketplace that is adjusting to and normalizing the higher level of interest rates.
Each of the four regions made gains in HMI for June although only the Northeast joined the South in positive sentiment territory. The Northeast and the Midwest made the largest gains both on a percentage basis and an absolute basis. The Northeast increased from 45 to 52. The Midwest increased from 42 to 48. The South gained 4 points to 60. The West inched higher from 48 to 50.
Home closing thoughts
The State of the Nation’s Housing
Harvard University’s Joint Center for Housing Studies (JCHS) released its annual report on The State of the Nation’s Housing. Sharp declines in affordability dominated the themes in a report chock full of bad news for buyers and renters. The share of cost-burdened households has soared, large migrations have sent households from expensive areas to lower-cost areas, and unsheltered homelessness has also jumped. JCHS concludes with the following outlook:
“As pandemic-era assistance programs wind down, housing remains prohibitively costly for millions of households. More lower-cost housing is clearly needed, but expanding development will require zoning reform to support a broader range of housing types and investments in off-site construction methods that could reduce costs. Additionally, investments are needed to preserve the country’s aging housing stock and respond to climate change; more than 14.5 million homes were affected by hazards in 2021, amounting to $57 billion in damage. Housing is a crucial engine of economic growth, and investments in this important sector pay broader dividends. As the pandemic highlighted, high-quality, stable, and affordable housing is foundational to widespread well-being and, as such, both merits and necessitates greater public attention.”
Rent is still high, but new leases reflect a cooling market
Relief for renters may be on the horizon. Marketplace reported various sources suggesting rent inflation peaked a year ago and a million new rental units are currently under construction. However, it seems most of the new units target middle and upper-income households, likely another function of high interest rates which drives up the cost of construction loans. The cost of construction is also causing some builders to pivot more and more to higher-end buyers.
The Plunge in National Housing Affordability
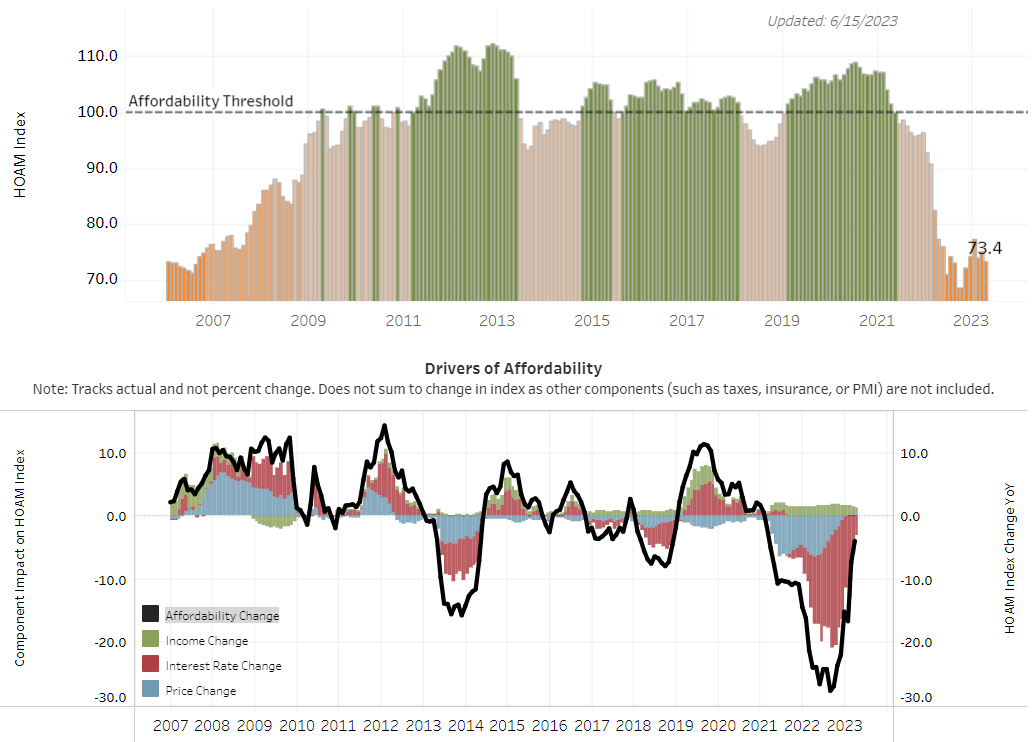
The Federal Reserve Bank of Atlanta maintains a Home Ownership Affordability Monitor (HOAM). The graphic below shows how the pandemic housing mania plunged housing affordability below 100 with soaring prices. The Federal Reserve’s rate hike cycle arrested the ascent in price but added more affordability pressures by making mortgages more expensive. On an aggregated basis, homes were last this unaffordable in the years preceding the Great Financial Crisis (GFC).
Per the Atlanta Fed: “A HOAM index value lower than 100 indicates that the median household income is insufficient to cover the annual costs of owning a median-priced home (the housing cost is greater than 30 percent of income). An index of 100 or greater indicates that the median household income is sufficient to cover the annual costs of owning a median-priced home (the housing cost is less than 30 percent of income).”
Mortgage Credit Availability Decreased in May
The Mortgage Bankers Association (MBA) reported that its Mortgage Credit Availability Index (MCAI) fell 3.1% to 96.5 in May. The MCAI, indexed to 100 in 2012, was last this low in 2013. The decline also marks the third consecutive month of a decline in mortgage availability. The MCAI soared over 185 going into 2020, just ahead of the pandemic. I am amazed that housing activity remains so resilient even with the pandemic-era plunge in mortgage availability. No wonder the Fed feels so comfortable maintaining tight monetary conditions.
The upshot of tightening credit is that a good number of home owners are in good financial shape and can better weather whatever economic slowdown may be ahead. This is a better economic setup than the years preceding the last recession which forced so many people into foreclosure and out of home ownership. I am constantly bemused by stories or tales of woe from prospective buyers who continue to wait for a price collapse. It is a strange market where some buyers want to exchange their misery of missing home ownership with ending the ownership dreams of another household.
Spotlight on Mortgage Rates
Although the Mortgage Bankers Association (MBA) reported decreases in mortgage applications 4 out of 5 weeks in May, including a current 3-week losing streak, purchase mortgage applications ended up surging for the month of May: +16% over April and +8% year-over-year, not seasonally adjusted. The commentary from the last MBA report in May even suggested that sales would soon slow down along with 7%+ mortgage rates. Instead, mortgage rates are somewhat stabilizing below the 7% level and new home sales soared.
The MBA reported mortgage application increases in 3 of 4 weeks in June. This trend sets up the market for another strong performance in June and July.
![Source: Freddie Mac, 30-Year Fixed Rate Mortgage Average in the United States [MORTGAGE30US], retrieved from FRED, Federal Reserve Bank of St. Louis, March 31, 2023](https://drduru.com/onetwentytwo/wp-content/uploads/2023/03/20230331_30-Year-Fixed-Rate-Mortgage-Average-US.png)
Be careful out there!
Full disclosure: long ITB; short RDFN shares, long RDFN calls
Great presentation and insights. You are so creative in both the data you choose and how you present it. I’m currently selling my home and see lots of the larger trends you discuss playing out in my local market.
Thanks for reading! Check back in and let us know how things work out and whether they confirm the more general analysis of the housing market.
Duru, this is an amazing assessment. To me it seems that buying new construction community style SFH is the best hybrid model in the SF Bay Area. When an old 1950 or 60’s , 3/2 1500 sq ft home goes for 1.5M after being refurbished that price seems high compared to a brand new SFH community style offering which, in my experience, typically can be around a third larger, loaded with upgrades and loan discounts, for a third less. Of course, we recognize the liberty of not having an HOA and any fees, but all in all, you’re getting peace of mind and paying 1/3 less on the front end, 1/3 less on the back end Vic on the loan. E.g., 6% interest on a 1.5M home over 360 mos is another 1.5M. 🤕
I fully agree. If I had the option to buy a new home where I am, I would have. But as you know, must SFHs now get built in the far flung reaches of the Bay!