
Stock Market Commentary
The first trading week of November was action-packed. At the start of the week I looked ahead to monetary policy from the Federal Reserve and the October jobs report as key catalysts. While those events were indeed important, the stock market was treated to an overlay of at least two other important milestones. A small cap breakout the day of the monetary announcement delivered a major technical signal. The breakout underlined expanding market breadth that small caps launched at the start of the week. A major announcement from Pfizer (PFE) about a highly effective COVID-19 anti-viral drug further underlined bullishness alongside a strong jobs report. The week was full of positive catalysts that properly set the tone for the launch of the seasonally strong period for the stock market.
The Stock Market Indices
The iShares Russell 2000 ETF (IWM) took the featured role of the week. IWM jumped 1.8% to complete a long overdue breakout to an all-time high. Friday’s 1.4% gain made the breakout official. IWM is a buy on the dips from here. A return to the 2021 trading range would end the bullish call, but my baseline case is a continued rally given expanding market breadth.
If not for IWM’s breakout, the S&P 500 (SPY) would have the featured position of the week. The index is on an impressive streak of 7 straight winning days, each with an all-time high, and only 2 small down days in the last 18 trading days. Needless to say, the S&P 500 has thoroughly left behind the last bear cycle.
The NASDAQ (COMPQX) is rallying with an even steeper slope than the S&P 500. The tech-laden index is on a streak of 7 straight all-time highs. Per my plan, I took profits on my fist full of QQQ calls ahead of the Fed. I was hoping for a dip, any kind of dip, to reload ahead of the coming week.
Stock Market Volatility
The volatility index (VIX) retested the key 15 level and rebounded from there. This short burst is not necessarily a warning given all the other positive signs in the stock market. Instead, it is very possible that big money institutions moved to protect gains with put options. We may never know, but one indication would be an S&P 500 pushing right into overbought trading territory.
The Short-Term Trading Call With Pfizer Providing Support
- AT50 (MMFI) = 66.6% of stocks are trading above their respective 50-day moving averages
- AT200 (MMTH) 56.8% of stocks are trading above their respective 200-day moving averages
- Short-term Trading Call: cautiously bullish
AT50 (MMFI), the percentage of stocks trading above their respective 50DMAs, closed at a fresh 5-month high. My favorite technical indicator shows how market breadth continues to expand. Accordingly, the market is enjoying a synchronous rally across IWM, the S&P 500, and the NASDAQ. Now, I am on watch for overbought trading conditions. The overbought threshold for AT50 sits at 71%. As a reminder, a push into overbought territory is not by itself bearish.
Indeed, under the current bullish cocktail, overbought further confirms the strength of the buyers. The overbought threshold provides a bearish signal under two primary conditions: 1) a convincing failure to break 71%, or 2) a convincing end to an overbought trading period. Still, even under those conditions, I will be very slow to flip all the way back to bearish. I would choose first to return to neutral. Next, I would watch for a fresh 50DMA breakdown in the S&P 500 to turn bearish. On a related note, AT50 has now gone 393 trading days without flipping oversold. I will provide more on that extreme in a future post.
Along with the impressive small cap breakout, the fundamental backdrop looks solid. The Federal Reserve took a cue from the Bank of Canada (BoC) by acknowledging inflation is higher than expected but expressing complete confidence in its preparation. Yet, the Fed did not follow the BoC in ending the expansion of its balance sheet. Instead, the Fed is slowing the expansion. The first rate hike is around a year away. The jobs report followed the Fed news with strong economic data.
The big surprise from Pfizer with the COVID-19 anti-viral drug underlined the bullish mix but also created some sharp divergences. I provide representative charts in the review section below.
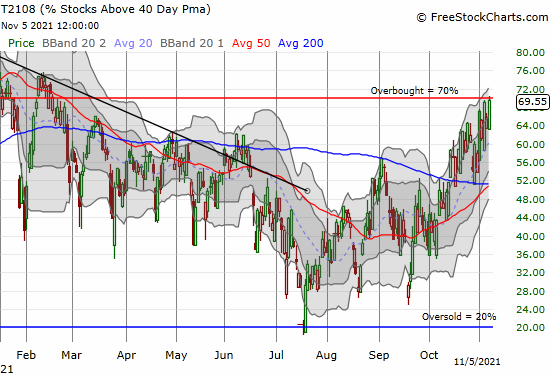
With AT50 closing in on overbought conditions, I turned to an old friend to provide a cross-reference. AT40 (T2108), the percentage of stocks trading above their respective 40DMAs, closed just short of its 70% overbought threshold. Interestingly, AT40 also rallied close to overbought on Monday and Wednesday only to fall back the following days. Still, the trend remains clearly up.
AT200 (MMTH), the percentage of stocks trading above their respective 200DMAs, still has a long way to go but the recovery trend is clear here.
Stock Chart Video Review
Stock Chart Reviews – Below the 50DMA
AMN Healthcare Services Inc (AMN)
Healthcare institutions have great challenges on staffing. AMN Healthcare Services Inc (AMN) is the biggest of the publicly traded staffing providers. Over the past month, the stock has gone berserk. AMN fell 23% from its all-time high over three days last month. The only news I see over that period is the appointment of a new CFO. So, I am not surprised the stock steadily recovered ahead of earnings. AMN even managed a fresh 50DMA breakout and gapped up 10.8% post-earnings.
AMN increased its guidance with bullish commentary: “Severe workforce shortages and growing patient volumes have elevated healthcare labor demand to unprecedented levels, leading to our record-high guidance for the fourth quarter.” I can only assume the subsequent reversal and bearish engulfing technical pattern came from a delayed reaction to the Pfizer COVID-19 anti-viral news. If so, I think investors and traders over-reacted. The pandemic exacerbated some staffing challenges in health care, but the pandemic did not cause the problem. In fact, the pandemic suppressed the demand for both preventive and elective medical care. Once this demand fully returns to normal, staffing shortages could worsen in America’s healthcare system. Despite the bearish technical signal, I am looking for an entry point to buy here. Note that AMN bounced right at the lows from October, and 200DMA support remains intact for now.
DoorDash, Inc. (DASH)
DoorDash, Inc (DASH) dropped 4.2% in the wake of the Pfizer anti-viral news. The decline created a bearish confirmation of 200DMA resistance. I bought a November put spread a week early but an increase in implied volatility brought the value to near even. A break below $192 would confirm that latest topping action. The move would also signal investors are finally pricing in some kind of post-pandemic normalization to the usage of DoorDash’s delivery services.
Peloton Interactive (PTON)
Talk about poor timing. Peloton Interactive (PTON) shaved as much as one billion dollars from its fiscal year (FY) 2022 guidance as uncertainty shrouds the business outlook. Combining that news with the Pfizer news reminding the market that pandemic-related tailwinds have stopped blowing, and PTON gets a major blow. PTON lost 35.4% and closed near its low for the day on extremely high trading volume. Despite this disaster, PTON still trades at 4x its value at the pandemic lows. Peloton Interactive is still projecting $4.4 to $4.8B in revenue in FY 2022 and has almost $1B in cash stashed in the bank.
“As discussed last quarter, we anticipated fiscal 2022 would be a very challenging year to forecast, given unusual year-ago comparisons, demand uncertainty amidst re-opening economies, and widely-reported supply chain constraints and commodity cost pressures. Although we are pleased to have delivered first quarter results that modestly exceeded our guidance, a softer than anticipated start to Q2 and challenged visibility into our near-term operating performance is leading us to recalibrate our fiscal year outlook.”
BHP Group Limited (BHP)
The price of iron ore plummeted from the summer’s lofty levels. That plunge helped take down BHP Group Limited (BHP) to 52-week lows. These declines should be negative economic signals, but so far, not so. The main narrative is a cutback in Chinese steel production as part of an anti-pollution push. So if the global economy continues its pandemic recovery, then today’s iron ore prices are a large bargain. While my last tranche of BHP call options will likely expire worthless, I am looking for a new entry point like a close above the October high to the upside or a test of the October, 2020 lows to the downside.
Rio Tinto Plc (RIO)
Rio Tinto (RIO) is more dependent on iron ore than BHP. As a result, RIO’s decline has been even more well-defined. RIO has fallen so steeply that I only see trying to buy a bottom rather than a breakout.
Chegg (CHGG)
See my Seeking Alpha article “Chegg Flunked But A Make-Up Test Is On The Way“.
Stock Chart Reviews – Above the 50DMA
Pfizer, Inc. (PFE)
Pfizer, Inc (PFE) delivered the news of the day and the week at 6:45am Eastern:
“[Pfizer’s] investigational novel COVID-19 oral antiviral candidate, PAXLOVID™, significantly reduced hospitalization and death, based on an interim analysis of the Phase 2/3 EPIC-HR (Evaluation of Protease Inhibition for COVID-19 in High-Risk Patients) randomized, double-blind study of non-hospitalized adult patients with COVID-19, who are at high risk of progressing to severe illness. The scheduled interim analysis showed an 89% reduction in risk of COVID-19-related hospitalization or death from any cause compared to placebo in patients treated within three days of symptom onset (primary endpoint)…
At the recommendation of an independent Data Monitoring Committee and in consultation with the U.S. Food and Drug Administration (FDA), Pfizer will cease further enrollment into the study due to the overwhelming efficacy demonstrated in these results and plans to submit the data as part of its ongoing rolling submission to the U.S. FDA for Emergency Use Authorization (EUA) as soon as possible.”
PFE gapped higher at the open and actually faded back to its upper Bollinger Band (BB) before ending the day with a 10.9% gain. PFE conveniently surged away from 50DMA support and looks like a buy on the dip. However, these positive COVID-19 health catalysts have often proven fleeting. At least this pattern held for Merck, which released its own bullish anti-viral news in October…
Merck & Company, Inc. (MRK)
Merck & Company, Inc. (MRK) joined the long list of casualties from the Pfizer news. While Pfizer promises much higher efficacy than Merck & Company, the depth of the loss surprised me. MRK reversed almost all its gains from the news of its COVID-19 anti-viral. Only a rally into and through earnings put the bullish momentum back into MRK. Accordingly, I suspect the pullback is an over-reaction. Since I still have a January call spread in MRK, I am content to wait out this setback. I will go back to adding to the position if the stock crosses the $84 level. My prior add came on MRK’s test of 20DMA support, and I flipped that call position right after earnings.
Moderna (MRNA)
The Pfizer news slammed vaccine-maker Moderna, Inc (MRNA). MRNA gapped below its 200DMA support and lost 16.6% on the day even after a heroic sprint off the lows of the day. MRNA last closed below its 200DMA TWO years ago. Thus, this breakdown is a major bearish moment for MRNA. The stock is a no-touch until/unless it closes above its 200DMA. A close below the intraday low confirms the bearish turn of events.
Cross Country Healthcare, Inc. (CCRN)
I made the case for healthcare staffing company Cross Country Healthcare, Inc. (CCRN) almost three months ago. As a result, I celebrated Thursday’s 20.0% gain as a major validation. Friday’s reversal pulled that rug right out. I assume CCRN suffered the same rejection AMN suffered. I am holding out hope the stock can hold the close as support as it lines up with the previous high. Such a move would also give me more confidence in buying AMN. I will have to lock in my remaining CCRN profits if weakness resumes on Monday.
Airbnb (ABNB)
“Reopening” stocks got a big boost from the Pfizer news. Lodging-share company Airbnb (ABNB) had the double fortune of reporting earnings the night before. ABNB jumped 13.0% post-earnings and closed just under its all-time high. The move confirms the recovery rally in the stock and maintains ABNB as a buy on the dip.
Dominos Pizza (DPZ)
My short in Dominos Pizza (DPZ) was ill-timed, and I stopped out after the stock punched through 20DMA resistance. I was ready to flip bullish on Thursday’s 50DMA breakout and 5.0% gain. However, DPZ reversed 2.7% in the wake of the Pfizer news. Pizza was a pandemic winner as it became a popular delivery food. I cannot gauge how much pandemic premium remains in DPZ, but I am watching the trading around the 50DMA closely.
Papa Johns International, Inc. (PZZA)
Unlike Dominos, Papa Johns International, Inc. (PZZA) soared after reporting earnings. PZZA gained 13.6% post-earnings and closed at an all-time high. The Pfizer news reversed a good chunk of that gain with a 5.5% loss. PZZA held the former all-time high as support, so a rebound from here should be a fresh buy signal.
Deere & Company (DE)
A week ago, I went on breakout watch on Deere & Company (DE). Deere immediately delivered with a 4.8% breakout through converged 50/200 DMA resistance. I bought a Nov $370 calendar call spread to reduce the price of the November $370 call spread that I wanted to trade. After a quick fade and rebound, the short side of the spread expired as desired. I am left with a cheaper play on a run-up into earnings.
Avis Budget Group, Inc. (CAR)
In a normal stock market, one-day surges in the triple digit percentages can happen. However, they are so infrequent that few traders should “expect” such moves. This stock market is not normal. I think many traders have come to expect triple digit percentage moves as a regular feature of week-to-week trading. The latest poster child of a stock market gone wild is rental car company Avis Budget Group, Inc. (CAR). As far as I can tell, traders got extremely excited over the mention of electric vehicles during the Q&A of the earnings conference call. From the Seeking Alpha transcript:
“…we at Avis realized that the electrification of vehicles is where not just our industry, but the entire mobility ecosystem is eventually headed. And I think the bold move made by one of our competitors and that announcement is good for the overall rental car industry. It pushes pace and draws attention to what needs to be done to absorb electric vehicles at scale.
I don’t think it’s fair to characterize that we haven’t moved on this. Like we’ve spent a lot of time over the past 12 months with both our OEM partners to optimize a product line for electric vehicles and also our infrastructure partners to tackle logistical hurdles about, like I said, absorbing these vehicles at scale. So we are definitely moving forward on this front. But the reason you haven’t heard from us publicly on this is like because of competitive reasons, we’d like to execute on our strategy before announcing it.
…you’ll see us going forward be much more active in the electric scenarios as the situation develops over time.”
Note that the competitor is Hertz, which generated excitement over a deal to buy Tesla (TSLA) vehicles for its fleet.
I include a monthly chart of CAR for perspective. CAR essentially went net nowhere from 1995 to early 2020. It took a pandemic to shake things up and rev up the engines to stratospheric heights. 🤷🏾♂️
Starbucks (SBUX)
I realized too late that Starbucks (SBUX) was destined to sprint right back to its 200DMA. The Pfizer news turbo-boosted SBUX to a 50DMA breakout and a 4.2% gain. Needless to say, SBUX is a buy on dips again.
Lyft, Inc. (LYFT)
Rideshare company Lyft, Inc (LYFT) enjoyed an 8.2% post-earnings gain. However, the stock faded from 50DMA resistance. The Pfizer news gapped the stock over its 50DMA. Now 200DMA resistance looms overhead. Regardless, Lyft made a convincing case for a triple (or quadruple) bottom for the year with the post-earnings pop.
Match Group, Inc (MTCH)
Match Group, Inc (MTCH) dropped enough just ahead of earnings to provide sufficient profits to close my strangle (calls and puts) position. The 3.0% post-earnings gain moved me back to the 100% bullish side of the ledger. I bought shares and a call spread.
Overstock.com, Inc. (OSTK)
I long ago stopped understanding the story on e-commerce retailer Overstock.com, Inc (OSTK). OSTK sprinted post-earnings toward the all-time high it set earlier this year. Given the streaky nature of OSTK, I am looking for a breakout to chase.
Applied Materials (AMAT)
Semiconductor companies ignited last week. Several related companies printed very bullish charts. Equipment supplier Applied Materials (AMAT) looks particularly attractive with a clean breakout above its former all-time high. AMAT is a buy on the dips from here.
Best Buy (BBY)
A month ago, I pointed out the wild trading in Best Buy (BBY). BBY turned on a dime and has barely taken a breather since. I finally jumped into the fray with call options and shares earlier in the week. A 2.8% gain on Thursday kept the sprint going. I took profit at the height of the day on Friday. With a breakout above the former all-time high, BBY is all clear for a buy on the dips. Per my own rule, that trigger ends if the stock closes below that breakout line.
Be careful out there!
Footnotes
“Above the 50” (AT50) uses the percentage of stocks trading above their respective 50-day moving averages (DMAs) to measure breadth in the stock market. Breadth defines the distribution of participation in a rally or sell-off. As a result, AT50 identifies extremes in market sentiment that are likely to reverse. Above the 50 is my alternative name for “MMFI” which is a symbol TradingView.com and other chart vendors use for this breadth indicator. Learn more about AT50 on my Market Breadth Resource Page. AT200, or MMTH, measures the percentage of stocks trading above their respective 200DMAs.
Active AT50 (MMFI) periods: Day #393 over 21%, Day #56 over 31%, Day #28 over 41%, Day #8 over 51%, Day #5 over 60% (overperiod), Day #173 under 72% (underperiod)
Source for charts unless otherwise noted: TradingView.com
Grammar checked by Grammar Coach from Thesaurus.com
Full disclosure: long SBUX puts, long DE call, long CCRN, long DASH put spread, long BHP calls, long MRK call spread, long MTCH shares and call spread, short CHGG put
FOLLOW Dr. Duru’s commentary on financial markets via StockTwits, Twitter, and even Instagram!
*Charting notes: Stock prices are not adjusted for dividends. Candlestick charts use hollow bodies: open candles indicate a close higher than the open, filled candles indicate an open higher than the close.