
Housing Market Intro and Summary
In the last Housing Market Review, I described the growing calm in the housing market data that contrast with the sell-off in home builder stocks. That sell-off worked in sync with the general stock market. The rebound in October also worked in parallel with the general stock market. As a result, the renewed strength launched the beginning of the seasonally strong period for home builder stocks. The housing data changed little over that time. Accordingly, I see a firming foundation for the home builder stock buying season.
The main change is in investor attitudes and risk tolerances. The data below describe a housing market still undergoing normalization. This market is in search of a new equilibrium as the pandemic-related tailwinds wind down. At least one housing-related company, Zillow Group (ZG), discovered itself woefully unprepared for the new normal. The company’s reset could symbolize an imminent “great reset” in the housing market for 2022. Some companies will stumble, others will thrive. I will focus on the narratives of both.
Housing Stocks
The iShares Dow Jones US Home Construction Index Fund (ITB) experienced a strong October along with the rest of the stock market. ITB returned to out-performance with an 8.7% gain in October versus the 6.9% gain in the month for the S&P 500 (SPY). November started with similar outperformance that creates a firming foundation: 3.3% vs 2.0%. This relative strength is consistent with the seasonally strong period for home builders. I was hoping to buy a dip but with the housing market gliding into normalization and ITB reaching levels last seen in May, I cannot expect much of a pullback from current levels.
In a turn of events, LGI Homes (LGIH) continues along a path of underperformance versus ITB. The last earnings report from LGI Homes underlined the relatively poor performance. LGIH peaked at an all-time high 6 months ago and has drifted downward ever since. LGIH fell 12.1% in the wake of earnings. The stock dropped as far as an 8-month low.
LGIH’s premium valuation means that normalization can carry a heavy burden. Indeed, LGI Homes reported another record-breaking quarter for Q3 but reduced fiscal year 2021 guidance from the Q2 earnings report. Expected home closings remained the same at 10,000 to 10,500 (thanks to a large backlog of 3,090 homes). However, selling communities dropped from a range of 112 – 120 to 100 – 105. The gross margin range tightened by +0.5% at the low end and -0.5% at the high end.
Granted, these adjustments seem small, but a reduction in selling communities could indicate a slower sales pace in 2022. LGIH’s high valuation requires large growth numbers. LGI Homes also reported an 11.4% year-over-year drop in home closings for October, which served as a fresh reminder of the normalization in pacing that is underway.
Housing Data
New Residential Construction (Single-Family Housing Starts) – September, 2021
Single-family home starts decreased to 1,080,000 which was flat with August’s starts (revised slightly upward). Starts were 2.3% below last year’s levels. This small decline ended 14 straight months of positive year-over-year gains. Still, starts seem to be entering a period of stabilization just above the 1,000,000 mark. This support looks like a firming foundation going into 2022.
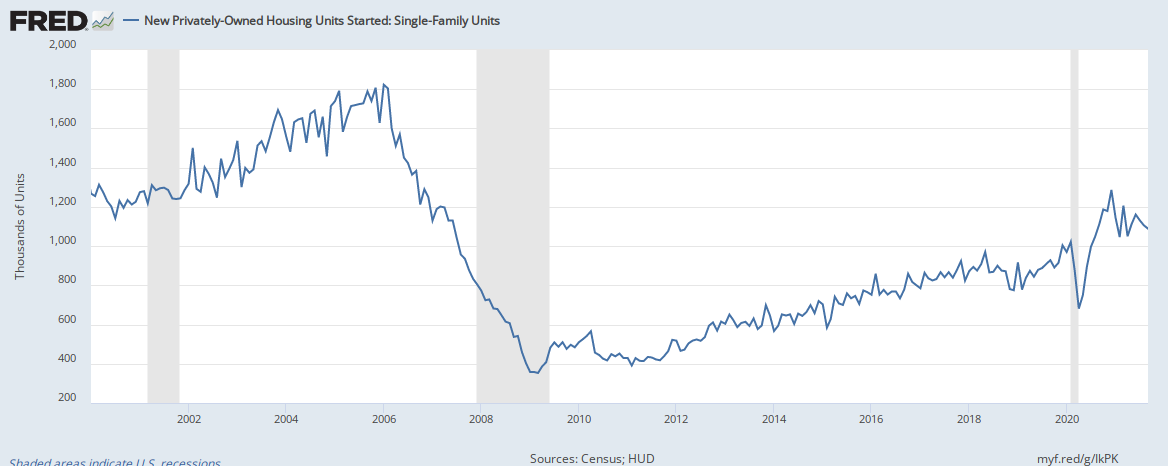
Three of four regions experienced year-over-year declines in starts. The Northeast was the region that flipped from positive growth in the previous month. Housing starts in the Northeast, Midwest, South, and West each changed -2.9%, +7.9%, -2.0%, -7.5% respectively year-over-year.
Existing Home Sales – September, 2021
Existing home sales staged a sharp comeback in September but still registered a year-over-year loss. The seasonally adjusted annualized sales in September of 6.29M increased 7.0% month-over-month from the unrevised 5.88M in existing sales for August. Year-over-year sales decreased 2.3%.
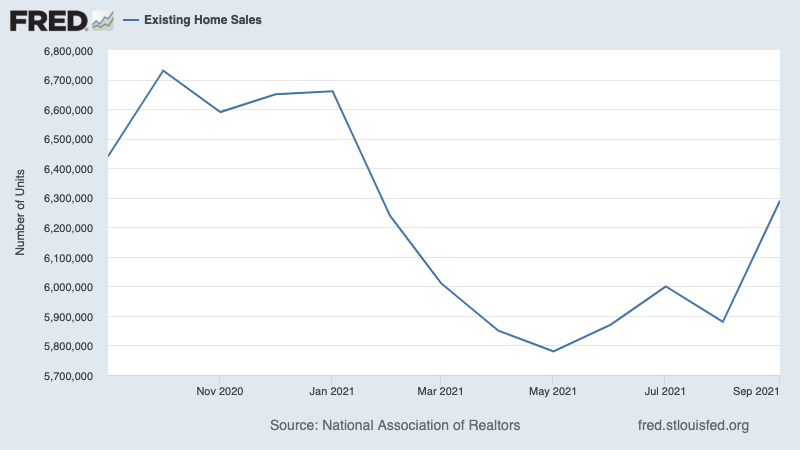
(For historical data from 1999 to 2014, click here. For historical data from 2014 to 2018, click here) Source for chart: National Association of Realtors, Existing Home Sales© [EXHOSLUSM495S], retrieved from FRED, Federal Reserve Bank of St. Louis, November 7, 2021.

September’s absolute inventory level of 1.27M homes decreased 0.8% from August. The second month-over-month decline contrasted with this surprising commentary from the National Association of Realtors (NAR): “Some improvement in supply during prior months helped nudge up sales in September.” Even if the NAR is referring to months before August, I cannot understand how a long delay in closings can explain September’s month-over-month surge. Instead, I think existing home sales have fully normalized and are settled into a range of a firming foundation that will only become clearer in coming months.
Inventory dropped 13.0% year-over-year (compare to August’s 13.4%, July’s 12.0%, June’s 18.8%, May’s 20.6%, April’s 20.5%, March’s 28.2%, February’s 29.5%, January’s 25.7%, December’s 23%, November’s 22% year-over-year declines, unrevised). “Unsold inventory sits at a 2.4-month supply at the present sales pace, down 7.7% from August and down from 2.7 months in September 2020.” The on-going year-over-year decline in inventory is on a 28-month streak and further highlights a contrast to the NAR’s claims of inventory driving increased sales.
The average 17 days it took to sell a home tied the all-time record lows in place from April through August.
The median price of an existing home fell for a third straight month and pushed further back from June’s (revised) all-time high of $362,800. Prices have increased year-over-year for 115 straight months. September’s price hike was a 13.3% year-over-year gain. The median price decreased from August by 1.4%.
First-time home buyers dropped to a 28% share of sales in September, down from 29% in July. The NAR’s 2017 Profile of Home Buyers and Sellers reported an average of 34% for 2017, 33% for 2018, 33% for 2019, and 31% for 2020. Investors did not step into the decline this time. Their share of sales dropped from 15% to 13%. These share declines are one more reason I expect existing home sales to soon decline from September’s level.
All regions increased in month-over-month sales, and three regions declined in year-over-year sales. The regional year-over-year changes were: Northeast -8.3%, Midwest -2.7%, South 0%, West -3.0%.
As usual, all regions registered robust year-over-year price gains: Northeast +9.2%, Midwest +9.1%, South +14.8%, West +8.3%.
Single-family home sales increased 7.7% from August and declined on a yearly basis by 3.1%. The median price of $359,700 was up 13.8% year-over-year.
California Existing Home Sales – September, 2021
California’s 2-track statewide housing market is normalizing ever so slightly. The divergence between the higher and lower ends of the market also narrowed just a bit. The California Association of Realtors (C.A.R.) reported that “a change in the mix of sales, once again, played a role in the change in the statewide median price, as the sales share of million-dollar continued to shrink on a month-to-month basis, and prices in the high-end market have been growing at a slower pace than the low-end market in the past two months.” Sharp divergences still exist across counties and regions. For example, 2/3 of counties continued to experience drops in inventory with 4 dropping more than 30% (all but one have substantial populations).
Overall, existing homes sales increased 5.6% month-over-month and ended a 4-month losing streak. For September, C.A.R. reported 438,190 in existing single-family home sales. Sales decreased 10.5% year-over-year. At $808,890 the median price decreased 2.3% from August’s all-time high. The median was still up 13.5% year-over-year. The $393 price per square foot was $2 off August’s all-time high. Still, 62.2% of homes sold above asking price.
Inventory remained at 1.9 months of sales for the second month in a row as the C.A.R. indicated “housing supply leveled off in September as the market transitioned into the off season.” Inventory decreased year-over-year from 2.0 months of sales.
The C.A.R. thinks that the off-season will offer buyers more options and more incentive to buy. However, without material increases in inventory and significant price declines, I see little changing in this process of normalization. Since the C.A.R. sees the housing market declining slightly next year, I think a slight cooling on all sides of the market will just continue to unfold but as a firming foundation for the California housing market.
New Residential Sales (Single-Family) – September, 2021
As expected, new home sales are maintaining the overall uptrend in place since the trough following the financial crisis. New home sales of 800,000 in August were up 14% from August but down 17.6% year-over-year. The jump from August builds a firming foundation for the overall uptrend.
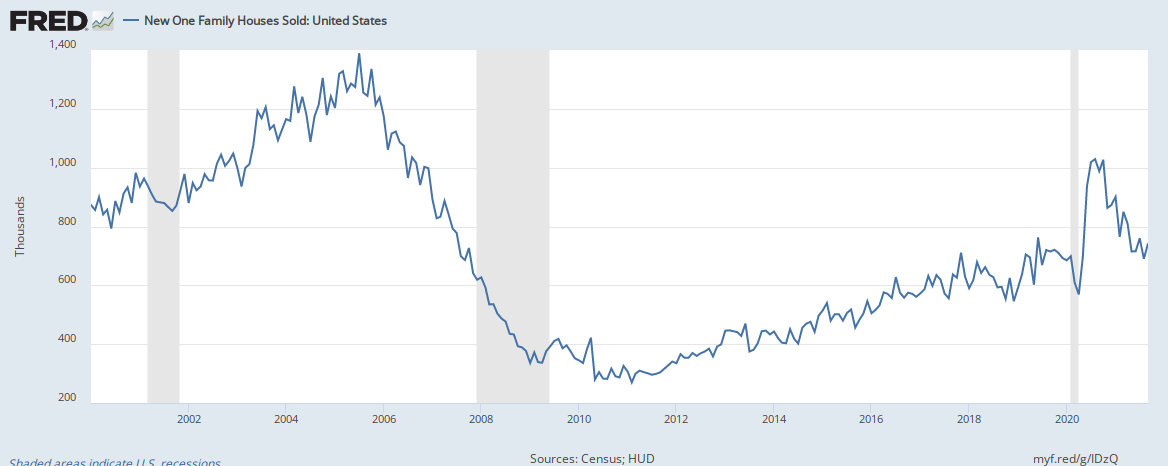
The median home price stayed set a new all-time high of $408,800. Year-over-year the median price was up 18.7% despite the large drop in sales year-over-year (or perhaps because of it!).
The monthly inventory of new homes for sale declined from 6.1 to 5.7 months of sales. The absolute inventory level of 379,000 delivered a second month of increases albeit just 0.3%.
Sales in three of four regions declined significantly year-over-year. The Northeast ended three straight months of sharp declines with a 7.9% gain. The Midwest plunged 34.0%. The South dropped 11.7%. The West declined 27.6%.
Home Builder Confidence: The Housing Market Index – October, 2021
After a 5-point drop in July, the NAHB/Wells Fargo Housing Market Index (HMI) from the National Association of Home Builders (NAHB) looked like trouble. However, I claimed that the decline simply represented some long overdue normalization. The HMI may have already hit bottom with October’s 4-point bounce to 80. Each of the components of the HMI gained in unison. Builder confidence soared despite consumer confidence remaining stuck in the doldrums at pandemic lows.
The NAHB could only point to strong demand as a driver for HMI’s revival. However, strong demand has been a core characteristic of the housing market since the early months of the pandemic. This confidence leans against “…ongoing supply chain disruptions and labor shortages that are delaying completion times and putting upward pressure on building material and home prices.” Moreover, “builders are getting increasingly concerned about affordability hurdles ahead for most buyers.”
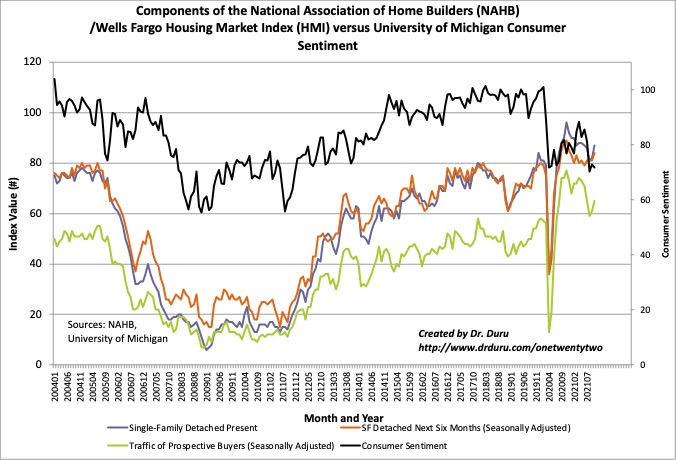
Source for data: NAHB
All four regions enjoyed significant HMI gains, especially the Northeast. The Northeast and the West bounced sharply off pandemic lows. In my last Housing Market Review, I expressed my expectation for revisions for the Northeast and the West given my surprise at the low levels. The NAHB did not revise those October numbers.
Home closing thoughts
Zillow Group Collapses
I thought that the persistent decline in the stock of Zillow Group (ZG) finally came to an end with the suspension of the Zillow Offers program. Unfortunately, that announcement was the warm-up act. In its subsequent earnings report, Zillow Group acknowledged it decided to completely abandon the 3 1/2 year old program as too risky and too expensive. The next day, ZG collapsed 23.0% AFTER a sharp 3-day decline going into earnings.
I will have a lot more to say about this calamity in a separate post. For now, I will say that I think this implosion represents the kind of buying opportunity that may only be appreciated many months later or longer. I am highly skeptical of the explanations offered by management, but I see a core business that remains strong.
Like Karen Finerman from CNBC’s Fast Money, I have been concerned about housing intermediaries doing too much heavy lifting in housing transactions. So we both see the removal of Zillow Group’s risk in Zillow Offers as a likely value-enhancing event. Hopefully management also jumps in and massively buys at these low prices like they did after a an implosion in ZG three years ago. I took a loss on recently bought shares ahead of earnings and sold put options after earnings.
Marketplace carried a good segment covering Zillow Group’s issues. Marketplace noted that competitors like Opendoor and Offerpad started out as iBuyers and remained focused on that model. Their success is another reason I am skeptical of Zillow’s explanations for its failure.
The likes of Opendoor and Offerpad have also been more cautious: “They saw market changes coming earlier this year, and they started slowing down the purchase of homes, or not paying quite as much money, or increasing their fees…Zillow didn’t, Zillow kind of missed the off-ramp.” In other words, incredibly, the failures Zillow describes in its models and forecasts likely came from over-extrapolating the pace of price appreciation in various housing markets.
No Crisis of Foreclosures So Far
While the NAR “looks forward” to foreclosures creating more inventory for home buyers, early signs are that the expiration of pandemic-related mortgage forbearance rules are not creating a swell of foreclosures. CNBC reported last month that “mortgage lenders began the foreclosure process on 25,209 properties in the third quarter.” New foreclosures typically run 40,000 per month. Foreclosures dropped as low as 3000-4000 per month during the pandemic. So the increase is large but, so far, normalization is not creating a new crisis.
Rent Control in Minneapolis
Rent control is not just an issue in expensive coastal cities. Voters in both Minneapolis and St. Paul passed rent control measures last week. In Minneapolis, the City Council was granted permission to establish the rules. In St. Paul, the vote placed a 3% cap on annual rent increases. The debate fell along familiar dividing lines. Rent control advocates want to protect housing stock for lower income renters. Rent control opponents fear a reduction in housing stock that in turn places price pressures on the remaining rental units. Either way, these measures are one more sign that the affordability crisis in U.S. housing is boiling over in many different ways.
Be careful out there!
Full disclosure: short ZG put options