
Stock Market Commentary
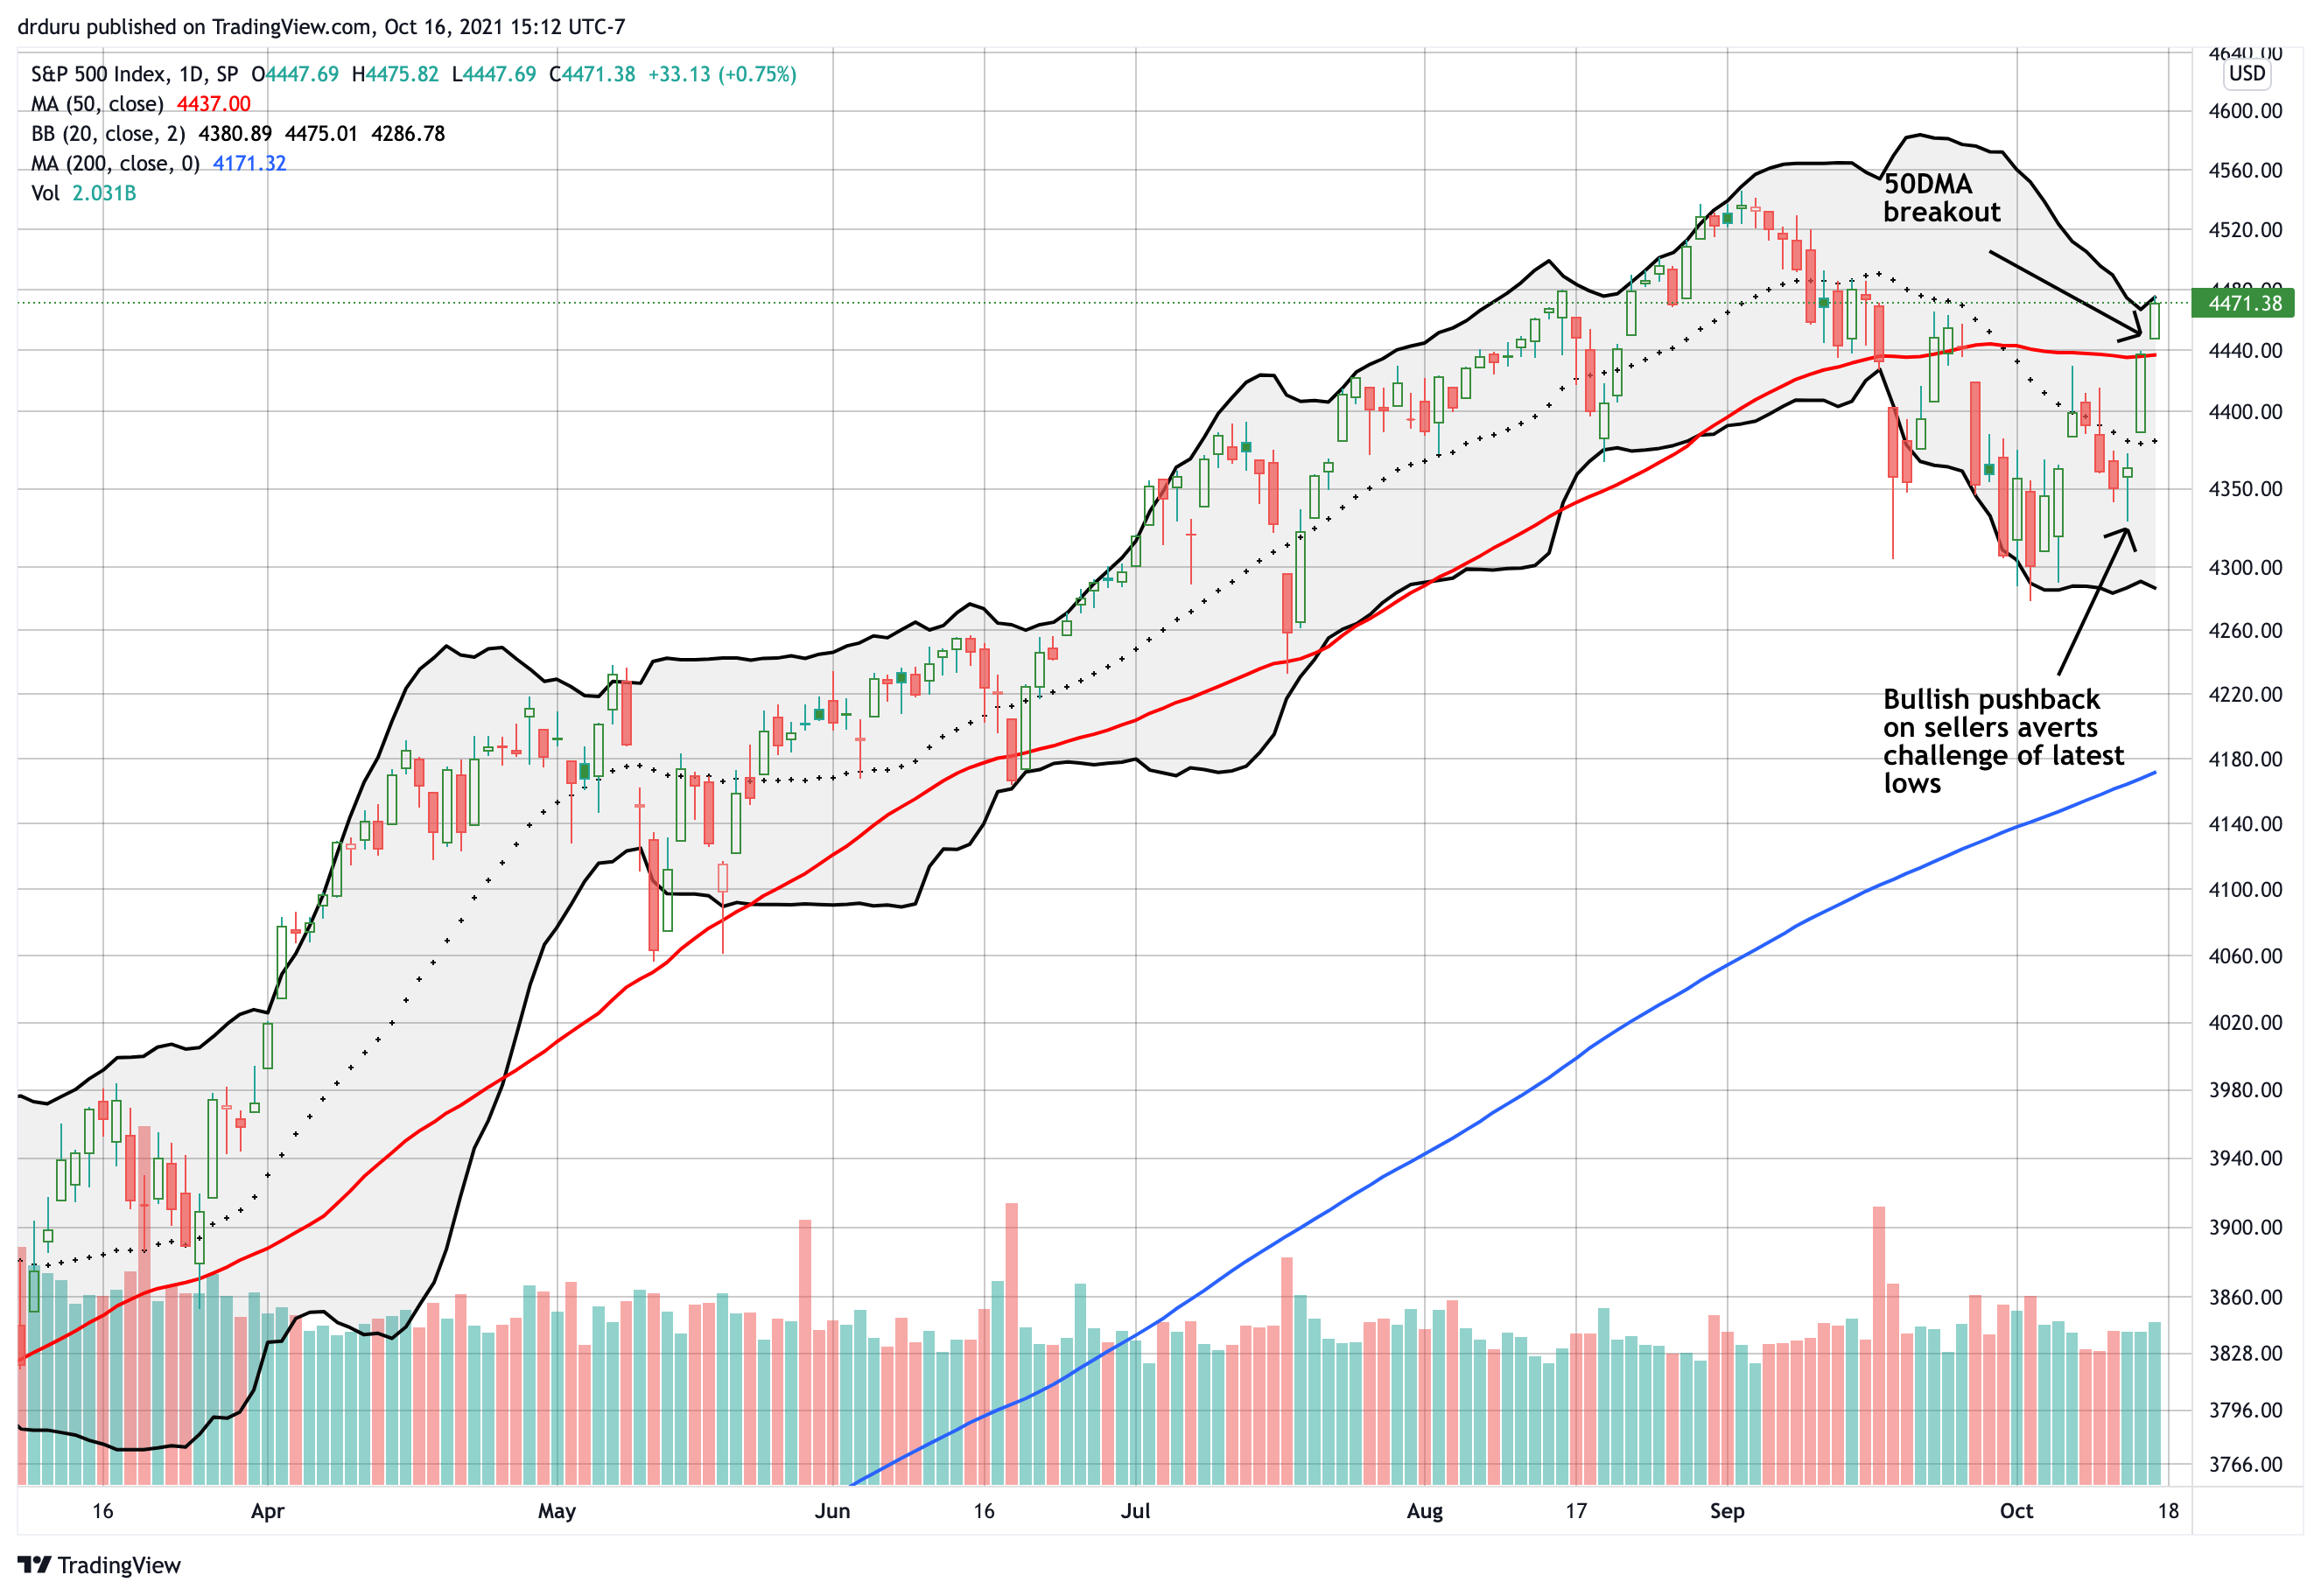
I turned bearish on the stock market over two weeks ago. Last week began with confirmation as sellers followed through on a fade from a brief rally. Mid-week, the downward momentum came to a screeching halt as buyers took over most of the trading action. I pointed out the key signs suggesting the bear cycle was likely already ending. The swing in sentiment by the end of the week cracked the back of the bear cycle particularly as the S&P 500 (SPY) executed an impressive breakout above resistance at the 50-day moving average (DMA) (see the red line in the chart below). While buyers must hit a new all-time high to re-establish bullish momentum, the bear cycle effectively came to an end with this key breakout.
The Stock Market Indices
The S&P 500 (SPY) convincingly pushed back on sellers with a hammer like pattern. A massive 1.7% gain the following day confirmed the turn-around. The S&P 500 gapped above its 20DMA (the dotted line below) and closed above the 20DMA for the first time in over a month. The index ended that day with a close right on top of its 50DMA. The S&P 500 confirmed the end of the bear cycle with a 50DMA breakout to end the week.
The NASDAQ (COMPQX) also closed the week with a 50DMA breakout. The 0.5% gain was not nearly as convincing as the move on the S&P 500. Still, the move is sufficient to crack the back of the bear cycle for tech stocks.
The iShares Trust Russell 2000 Index ETF (IWM) delivered a contrary 0.3% loss to end the week. The index of small caps looks as ready as ever to stay tucked within its 2021 trading range. The trading signals on IWM remain weak.
Stock Market Volatility
The volatility index (VIX) displayed the sudden change in sentiment with a clean break below the recent trend of higher lows. The VIX even looks ready to challenge the lows of the year in coming days.
The Short-Term Trading Call In A Survival Model
- AT50 (MMFI) = 53.8% of stocks are trading above their respective 50-day moving averages
- AT200 (MMTH) 51.2% of stocks are trading above their respective 200-day moving averages
- Short-term Trading Call: neutral
The bear cycle was clear enough to flip my short-term trading call from neutral to cautiously bearish. As the tweet above suggests, the October low had all the look of a confirmation that a deeper bear cycle was unfolding. Still, I called this a “fade the rally” trading period exactly because I had so little confidence in the follow-through ability of sellers. The failed test of of 50DMA resistance delivered a good fade the rally trade. However, that fade was short-lived. I took profits quickly on some positions and watched the rest wilt away into end of the week.
The S&P 500’s maximum drawdown for October remains a mere 0.2% from the second trading day of October. The last chance for a return to the bear cycle is a performance closer to the dangerous history of October with a 2.1% median and a 3.2% average drawdown. Accordingly, I will follow a lower low on the S&P 500 in October with aggressively bearish bets. Such bets cannot last long with the historical tendency of October sell-offs to precede rallies into or through November.
AT50 (MMFI), the percentage of stocks trading above their respective 50DMAs, was churning until the breakout to 53.9% that signaled a potential end to the bear cycle. At Friday’s open, AT50 printed a confirmation of the end of the bear cycle. Surprisingly, my favorite technical indicator faded away the rest of the way. Small caps clearly led the way downward. Even without AT50’s confirmation, I changed my short-term trading call to neutral. The sellers lost control of the narrative, but the bulls are not in complete control either.
AT200 (MMTH), the percentage of stocks trading above their respective 200DMAs, looks like it finally carved out a sustainable bottom. This move is a very important signal looking further out to the stock market’s seasonal strength that starts in November. This shift is one more reason to flip my short-term trading call away from cautiously bearish.
Stock Chart Video Reviews
Stock Chart Reviews – Below the 50DMA
Camping World Holdings (CWH)
The recreation trade slowed down this year for Camping World Holdings (CWH). CWH is up 42.0% year-to-date, but the stock peaked in May and has stayed in a trading range for most of the year. Last week, sellers stepped into the picture on high volume and confirmed a 200DMA breakdown. CWH last closed below its 200DMA in September, August, and May, 2020. As a result, I am watching CWH for a larger sell-off. I did not see any news associated with this pick-up in selling pressure.
Dicks Sporting Goods Inc (DKS)
The recreation trade continues nearly unabated this year for Dicks Sporting Goods Inc (DKS). DKS is up a startling 113% year-to-date. However, a 50DMA breakdown to end September confirmed a downtrend from the all-time high. Before this pullback, DKS only closed below its 50DMA once this year. Last week’s relief rally faded from converged resistance at the 20AMD and 50DMA so the bias for DKS remains to the downside. Note also the selling in October closed DKS’s post-earnings gap up.
Facebook (FB)
The selling in Facebook stopped cold with a picture-perfect bounce off 200DMA support. You just cannot make this stuff up. I unloaded most of my puts on that test. I anticipated a mechanical defense of this important trend line. Sellers actually showed up again on Friday for a 1.2% loss.
CNBC’s Fast Money took up what has now become a very predictable discussion about the trading and investing implications of the trials and travails at Facebook. The guests on the show essentially do not care about Facebook’s business practices as long as the company maintains its addicted audience and advertisers remain stuck on the platform without better options. There are some nuances like Guy Adami expressing his disgust for Facebook but recognizing the strong technicals. Friday’s version of “yeah but” discussion included one refreshing twist. Steve Grasso took the panel to school on ethics when he drew a line in the sand when it comes to the potential for harm to children.
I am not interested in a bullish entry on FB, so I did not take the bait on the perfect 200DMA test.
Apple Inc (AAPL)
Apple Inc (AAPL) provides its own example of how sellers lost their enthusiasm for the bear cycle. AAPL started the month on track for a test of 200DMA support. After sellers faded the relief rally, I thought the test was imminent. Instead, buyers stepped in near the October lows and never looked back. Now, Apple looks poised to challenge its 50DMA resistance. As a reminder, I put the Apple Trading Model (ATM) on hold as long as AAPL trades under its 50DMA.
Dominos Pizza Inc. (DPZ)
The tide is changing for Dominos Pizza Inc. (DPZ) as, presumably, the inflationary and staffing challenges in the restaurant industry are catching up to the juggernaut. DPZ gapped down post-earnings and buyers automatically jumped in to fill the gap. Sellers returned for a second round and took DPZ down 4.7% the next day. A 200DMA test looks imminent.
The Boston Beer Company, Inc. (SAM)
I thought The Boston Beer Company, Inc. (SAM) finally found some kind of bottom with a 2-day surge of buying. The buyers have yet to return since then. The default downtrend took over from there. I now need to see buyers defend the bottom. Otherwise, SAM will open a glide path to much lower prices (and I will have to stop out of my recent position).
iPath Bloomberg Cocoa Subindex Total Return ETN (NIB)
I am very behind on my posts on the cocoa market even as I continue the tried and true strategy of buying dips and selling rallies. Last week ended in another buyable dip for the iPath Bloomberg Cocoa Subindex Total Return ETN (NIB). The current market is roiled with numerous issues that I hope to sort through in a coming post.
Stock Chart Reviews – Above the 50DMA
Splunk, Inc (SPLK)
Last week I noticed the contrary bullish setup for Splunk, Inc. (SPLK). My calendar call spread turned out to be the wrong way to play what came next. When SPLK rushed by my $155 strike on the spread, I added a $165 call to the mix. The buying pressure was so strong that I was able to take profits on a 150% gain. Needless to say, I left a lot of money on the table. I was not able to close out the calendar call spread at an acceptable price, so I allowed assignment on the short side. If SPLK does not pull back sharply in the coming week, I will use my deep in-the-money calls to close out the short shares.
DoorDash, Inc (DASH)
DoorDash (DASH) defied most of the selling pressure this month. A brief break of 50DMA support pulled me into a put spread. Buyers took over from there for the rest of the week. Still, DASH is struggling with resistance from the highs set in January and February of this year.
Spotify Technology (SPOT)
Another contrary bullish setup showed up in Spotify Technology (SPOT). A strong push off 20DMA support allowed me to take profits on Friday. I like buying dips in SPOT, but I am waiting for an end to the lower highs to get newly confident in the bullish thesis.
First Solar, Inc. (FSLR)
First Solar (FSLR) started the week with a 3.7% gain. My last covered call position closed out the previous Friday, so I had no position to take advantage of the renewed interest in FSLR. (I hold a longer term position in Invesco Solar ETF (TAN)). Alternative energy plays returned to fashion last week as oil prices continue to surge and fears creep higher about energy crunches in the winter….oh yeah, and fresh hopes for an infrastructure bill in the U.S.
J.B. Hunt Transport Services, Inc. (JBHT)
J.B. Hunt Transport (JBHT) delivered a potential exclamation point for an end to the bear cycle. The trucking company delivered an 8.7% post-earnings pop to an all-time high. This clean breakout sets up a buy on the dip trade.
Lowes Companies (LOW)
Lowes Companies (LOW) is enjoying another of its sharp run-ups. LOW closed at or above its upper Bollinger Band (BB) three straight days. The last two closes were all-time highs. The buying surge represents a breakout above the August to September consolidation and creates a buy-the-dip setup.
Tesla (TSLA)
“Quietly”, Tesla (TSLA) has enjoyed a 5-month uptrend off the May lows. The buying pressure increased last week. TSLA ended the week with a 3.0% gain ahead of earnings coming this week. My latest trade on TSLA is an Oct 29 $880/$900 call spread. I am looking for a strong run going into earnings, and I will take profits just ahead of the news if TSLA is still well above its upper-BB.
Be careful out there!
Footnotes
“Above the 50” (AT50) uses the percentage of stocks trading above their respective 50-day moving averages (DMAs) to measure breadth in the stock market. Breadth defines the distribution of participation in a rally or sell-off. As a result, AT50 identifies extremes in market sentiment that are likely to reverse. Above the 50 is my alternative name for “MMFI” which is a symbol TradingView.com and other chart vendors use for this breadth indicator. Learn more about AT50 on my Market Breadth Resource Page. AT200, or MMTH, measures the percentage of stocks trading above their respective 200DMAs.
Active AT50 (MMFI) periods: Day #377 over 21%, Day #40 over 31%, Day #12 over 41%, Day #2 over 51% (overperiod), Day #83 under 62% (underperiod), Day #147 under 72%
Source for charts unless otherwise noted: TradingView.com
Grammar checked by Grammar Coach from Thesaurus.com
Full disclosure: long UVXY calls, long QQQ puts, long SAM, long TSLA call spread, short SPLK shares and long calls
FOLLOW Dr. Duru’s commentary on financial markets via StockTwits, Twitter, and even Instagram!
*Charting notes: Stock prices are not adjusted for dividends. Candlestick charts use hollow bodies: open candles indicate a close higher than the open, filled candles indicate an open higher than the close.
Thanks for the link about FB. My own take is that those who insist there is no place for debates about corporate ethics in a discussion of investment opportunities are ignoring the rapidly growing influence of investors who DO care about corporate ethics (as well as corporate governance), and who are demanding legislation to re-level playing fields currently dominated by Google and Facebook.
I read that Tesla is sitting on over $1 billion in crypto currency gains. If that’s true, it adds a weird new quality – and potential risk – to TSLA investments.
I have to assume a good amount of the rally in Tesla is indeed about the big pop in Bitcoin. But to talk about risks in Tesla is to miss the strong technicals when they arrive. Few have cared about the risks in Tesla ever since the company barely escaped bankruptcy and short-sellers were really going to town on the stock.