
August through October are the most dangerous months of the year for the S&P 500 (SPY). The historical drawdowns create a well-known pattern of trading that Jim Cramer of CNBC has referenced several times for at least a month. While this year’s August failed to fulfill its destiny, September delivered on its promises with heavy selling in the last two weeks of the month. This selling originally increased Cramer’s confidence in the bullish bearishness that 1) predicts a rough first half of October followed by 2) a golden buying opportunity. Such precise forecasts are fraught with danger because so much can happen to take the market off-course from its destiny. Indeed, the tantalizing buying opportunity ahead is already giving Jim Cramer October jitters. One day, Cramer warned that buying in the stock market could be a temporary relief rally. The very next day, he recommended buying into any intraday pullback.
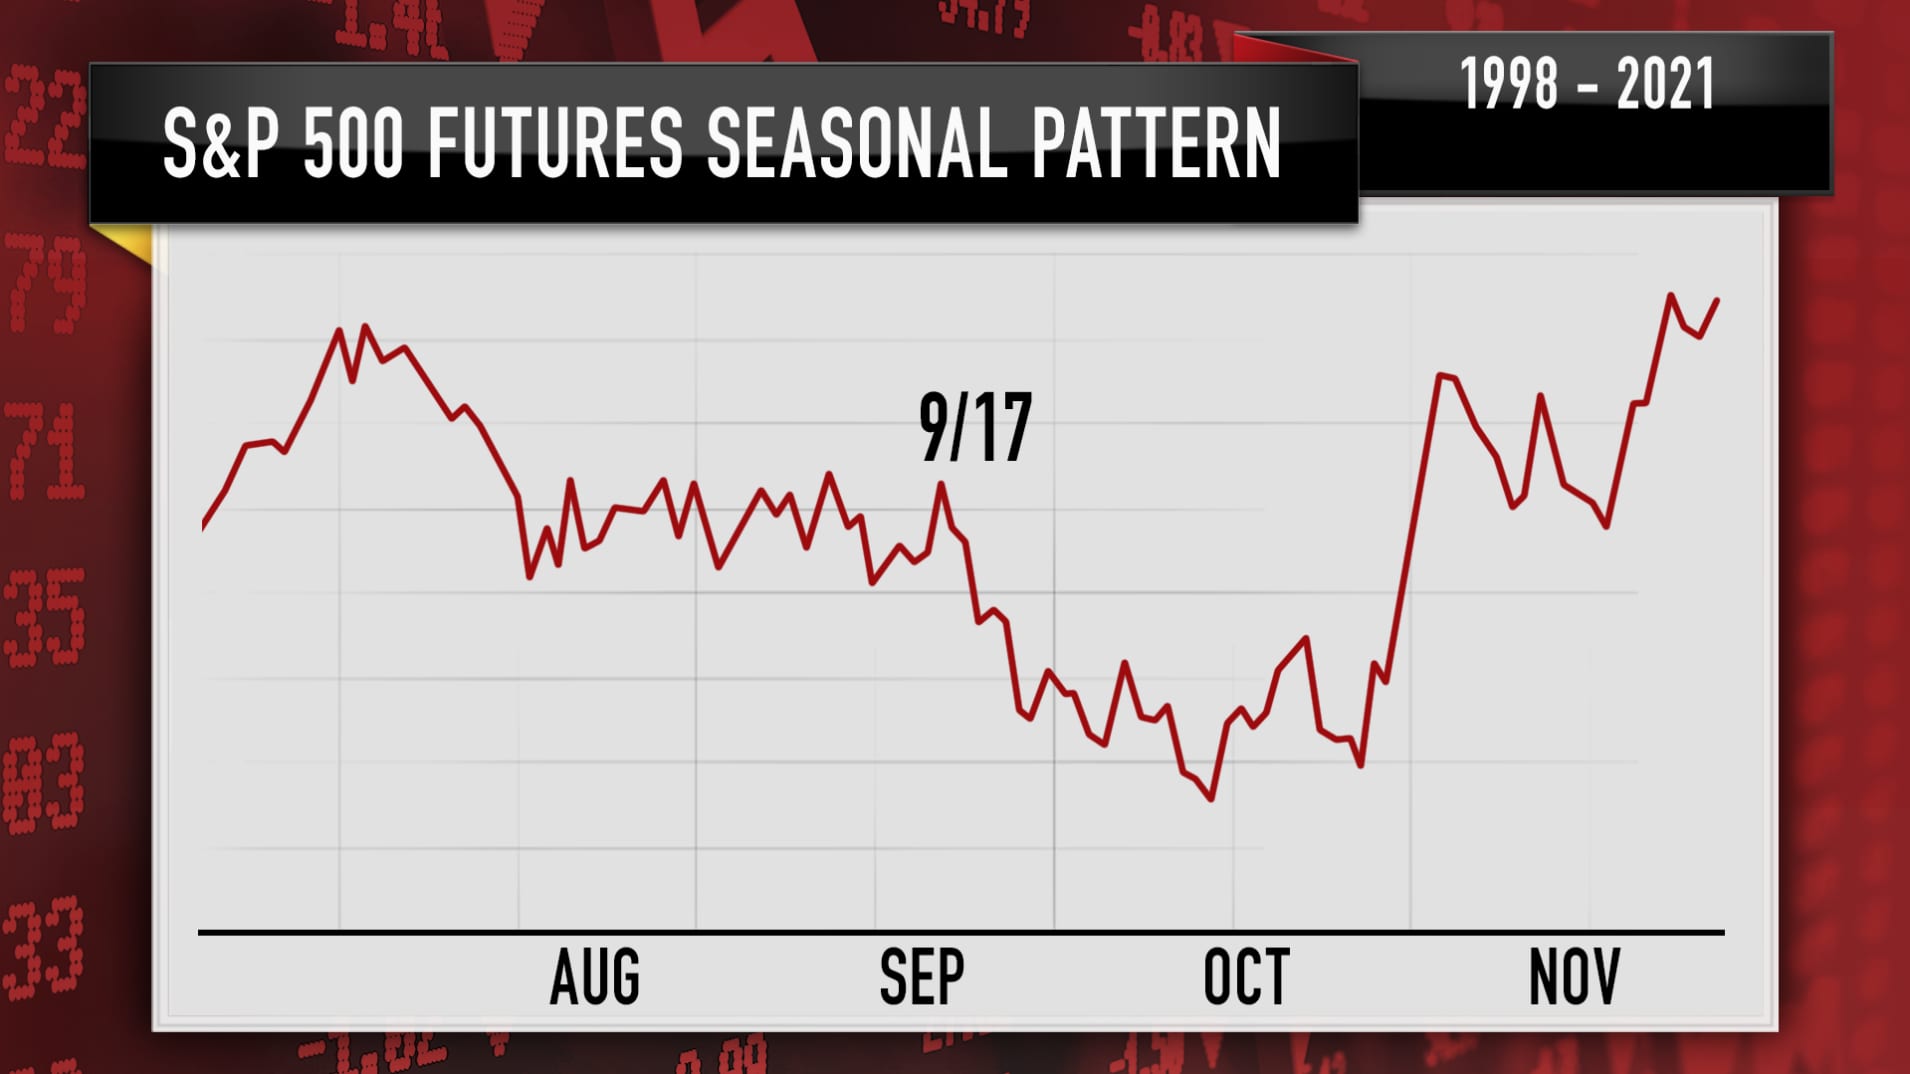
Cramer uses the above chart as a trading guide, and it explains his early October jitters. A non-precise buying strategy in the first three weeks of October is sufficient to enjoy the returns from a healthy rebound from the October lows. By late November, the S&P 500 should exceed August’s highs. While I also have a case of bullish bearishness, I avoid the jitters by following market breadth indicators.
What Does Market Breadth Say?
The percentage of stocks trading above their respective 50-day moving averages (DMAs) – what I like to call AT50 for “Above the 50DMA” – signals oversold trading conditions below 21%. I aggressively buy during oversold periods. As a result, I treat the last of the most dangerous months of the year as a potential time for bullish bearishness. I bearishly anticipate a drawdown that I want to buy when/if it happens.
AT50 has pivoted around current levels since July with three consecutive higher closing lows. So, while I anticipate oversold conditions to happen this month, I am watching to see whether AT50 comes short of breaking the September low. If so, I want to buy the rebound.
The 50DMA on the S&P 500 is the other signal I monitor here (the red line in the chart below). The same trendline that defined bearish conditions on the way down will help define bullish conditions on the way up. Specifically, a fresh close above the 50DMA invalidates the current bearish period. A second higher close confirms the breakout. (I explain the importance of confirmation in a trading video).
The Trade On Bullish Bearishness
I am currently cautiously bearish on the stock market and the S&P 500 specifically. I am holding an SPY calendar call spread with the short side expiring this Friday. Unless the position triggers my target profit level this week, I will use the position to play a sell-off to kick-off next week’s the start to earnings season. In the meantime, I am inclined to fade rallies while the S&P 500 trades below its 50DMA.
Be careful out there!
Full disclosure: long SPY calendar call spread