
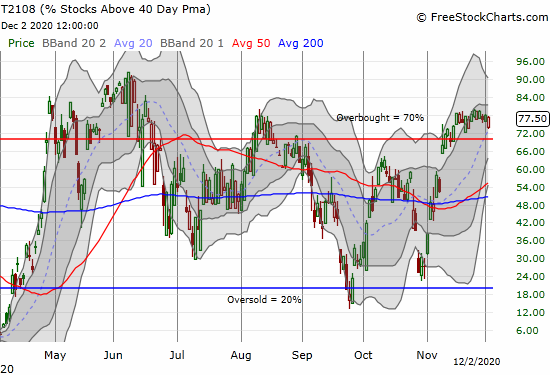
The stock market has enjoyed overbought trading conditions for the last 13 trading days and 14 of the last 15. I consider the stock market overbought when AT40 (T2108), the percentage of stocks trading above their respective 40-day moving averages (DMAs), trades above 70%. Overbought periods are times of mixed feelings. The stock market tends to look very strong, but the duration and/or the extent of the strength can evoke discomfort. A pullback seems inevitable, but the timing is very difficult to gauge. Canaccord’s Tony Dwyer appeared on CNBC’s Fast Money to express a kindred discomfort. Yet his message was a bullish kind of bearish. Dwyer expects a buyable 3-5% pullback that could follow a seasonally strong December.
Different Overbought Signals

While I scratched my head over how to interpret this message as an actionable warning, I was intrigued by Dwyer’s notions of overbought and oversold. Dwyer uses the 10DMA, a method to-date I have never seen or heard. Dwyer’s stock market hits overbought with 90% of S&P 500 stocks over their respective 10DMAs and oversold when 90% trade below. The market was at the 90% over mark on November 11th and is now at 66%. Dwyer suggested this bearish divergence with the S&P 500 indicates an eroding base. However, I think the problem is the indicator and not the market. A 10DMA indicator can subject a trader to more false signals as the short-term trend fluctuates sharply with natural market volatility.
On the other hand, AT40 (T2108) looks perfectly comfortable in the mid to high 70s and tells me that the average stock is NOT “pulling back a bit” as Dwyer says. Instead, the average stock is more milling around awaiting the next catalyst.
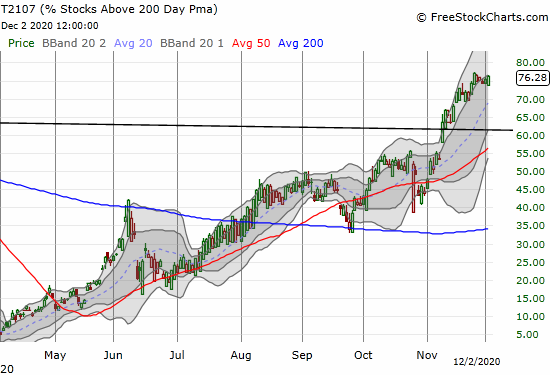
Moreover, AT200 (T2107), the percentage of stocks trading above their respective 200DMAs, is UP since November 11th and had another good day. In other words, while a few stocks are no longer smoking hot, more and more stocks are establishing bullish breakouts for the longer term. I claim that the longer-term breadth indicators more accurately reflect the market’s strength.
The S&P 500
A 3-5% pullback feels like an odd concern not only in the context of expectations for an imminent leg higher in the market but also given the overall relentless rise in the S&P 500. For example, the two-month decline in the index from September to October was only one of seven periods where the S&P 500 dropped for two or more consecutive months. Blink and we might miss a 3-5% pullback.
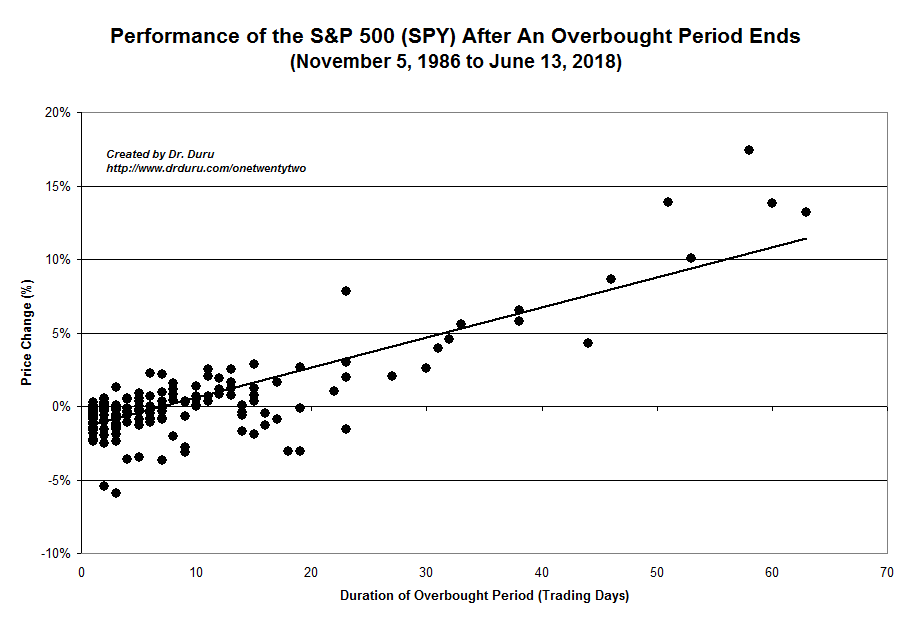
Interestingly, Dwyer’s prediction aligns well with historic S&P 500 performance after the end of an overbought period. The current overbought period started on November 13th (soon after Dwyer claims the overbought period peaked). Since then, the S&P 500 is up 2.3%. If the overbought period ended tomorrow, the chart below suggests the index could end up with roughly a flat performance of the span of the overbought period, very close to the low end of Dwyer’s 3-5% pullback scenario. If the overbought period ends in another few days, the pullback could reach the upper range of Dwyer’s prediction. After that, a 3-5% pullback might just reverse some future breakout.
The Message from Currencies
The Australian dollar versus the Japanese yen (AUD/JPY) confirms underlying strength in the stock market. While my favorite forex indicator of market sentiment has yet to surpass its high from the beginning of September, the currency pair is trending in the right direction. Indeed, the S&P 500 and AUD/JPY have been pretty solid traveling buddies.
The Trade
After having quibbled with Dwyer’s market read, I remain neutral on the stock market. I am mentally prepared to respond the moment when the market’s latest fever breaks with a breakdown from overbought conditions. Unlike Dwyer’s bullish kind of bearish positioning, I will not suddenly flip bullish at that time. Without a true close encounter with oversold conditions, I will at best flip away from bearish back to neutral.
Be careful out there!
Full disclosure: long AUD/USD, long AUD/JPY