
Stock Market Statistics
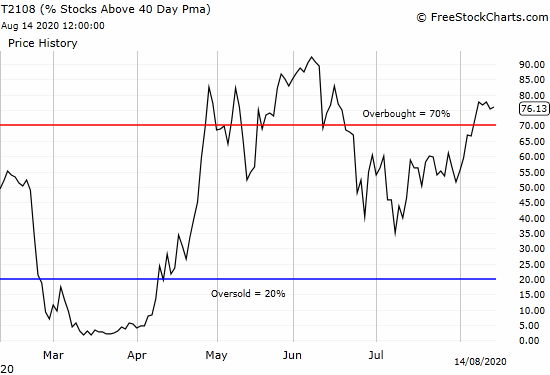
AT40 = 76.1% of stocks are trading above their respective 40-day moving averages (DMAs) (6th day overbought)
AT200 = 46.3% of stocks are trading above their respective 200DMAs
VIX = 22.1
Short-term Trading Call: cautiously bullish
Stock Market Commentary
While the politicians in Washington D.C. play a game of chicken with the economy, the stock market is merrily levitating. Investors and traders continue to enjoy the powerful combination of liquidity from the Federal Reserve, expectations of an imminent coronavirus vaccine, and the inevitability that the politicians will have to do “something” for the coronavirus economy. The slow healing in the labor market adds an extra layer of cushion for comfort.
Ironically, this ultimate comfort zone is happening right in the middle of the stock market’s most dangerous month of the year. I do not see any near-term catalysts for a major sell-off until October (outliers not withstanding of course). October is the market’s second most dangerous month which will happen just ahead of what promises to be an extremely contentious Presidential election.
The Stock Market Indices
The S&P 500 (SPY) continues its slow motion rally. The index is still toying with its all-time high after coming within 6 points last week (chart mislabeled).

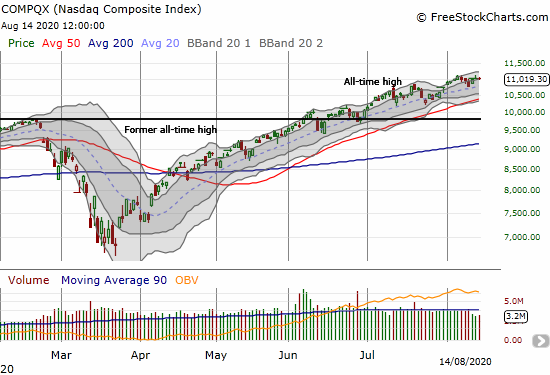
The NASDAQ (COMPQX) proved once again that buying every single dip is a winning strategy. A mild 3-day pullback was not even deep enough to drive the tech-laden index into its 20-day moving average (DMA). The NASDAQ closed the week essentially flat with the previous Friday’s close.
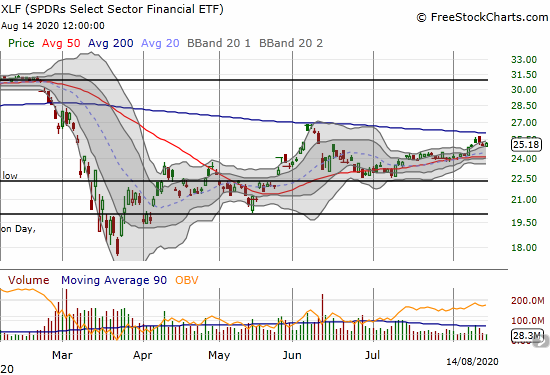
The SPDR Select Sector Financial ETF (XLF) is still a major laggard. Financial stocks are some of the biggest blemishes on the stock market recovery. XLF is yet to break out above its 200DMA and remains well below the June, 2020 high. I have to remind myself to check on financials from time-to-time just to make sure I do not miss out on some major bear/bull signal.
Volatility
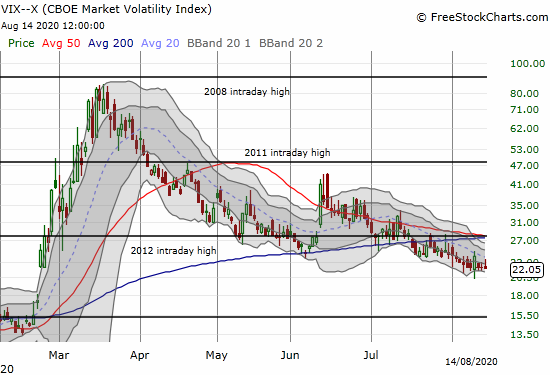
The volatility index (VIX) is essentially dead. While it remains “elevated” above 20, the VIX remains in a downtrend from the June highs. I am clinging to a small number of shares in ProShares Ultra VIX Short-Term Futures ETF (UVXY) as a small hedge on my bullishness. Volatility will be severely under-valued if the VIX remains this low going into October. At these prices, I will have to load up on put options and perhaps more UVXY shares in late September/early October.
The Short-Term Trading Call
The cautiously bullish short-term trading call is as comfy as the stock market. I am still focused mainly on buying 200DMA breakouts. I am also buying select momentum plays with covered call options – see “Nikola: Hitching A Sustainable Trade to Ride Through the Hype” for an example.
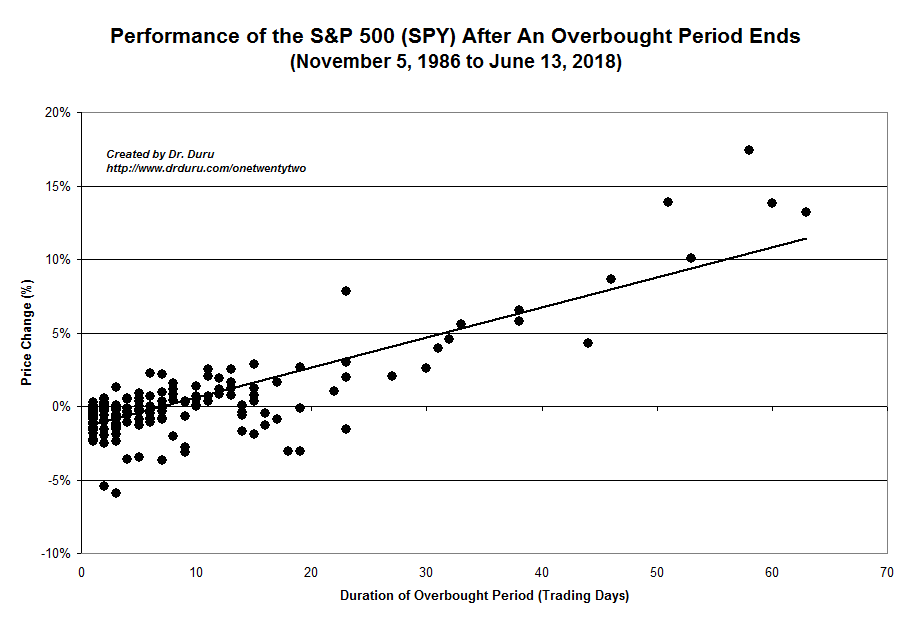
Overbought

Overbought conditions (AT40 greater than 70%) started with lagging sectors rallying. IWM surged as well as financials. Some oil patch plays also fared well. Most of these plays stalled out last week yet AT40 managed to close higher for the week. AT200 (T2107), the percentage of stocks trading above their respective 200DMAs, is also still churning higher ever so slowly. Taken together, these behaviors indicate that the rally continues to broaden – a very bullish development for the stock market….as hard as it is to believe!
Stock Chart Reviews: Video Summary
Stock Chart Reviews – Below the 50DMA
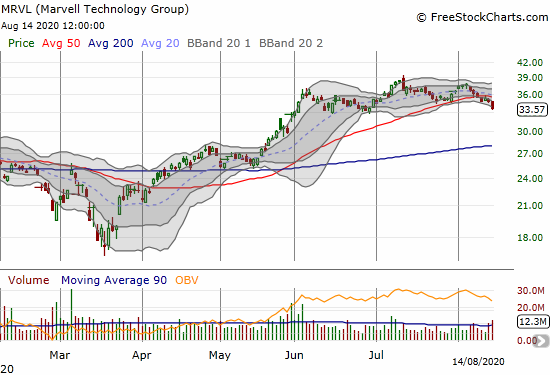
Marvell Technology (MRVL)
Semiconductor company Marvell Technology (MRVL) disappointed last week with a 50DMA breakdown. The stock now looks like it is printing a double-top. I will take the loss this week on a lower close.
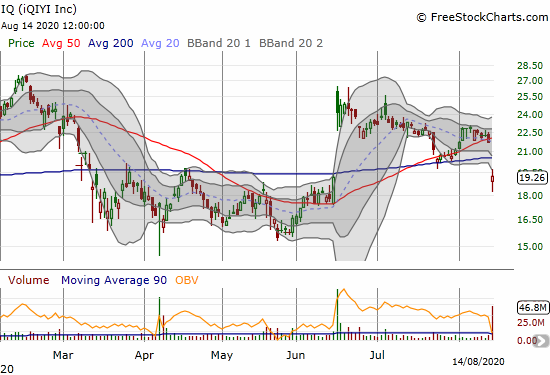
iQIYI (IQ)
iQIYI (IQ), the “Netflix of China”, finally gave up all its gains from the big one-day surge in June. The SEC investigation that rattled IQ further solidified my decision to foreswear, once again, all Chinese stocks. It was quite telling that IQ never managed a higher close after the June pop.
Stock Chart Reviews – Above the 50DMA
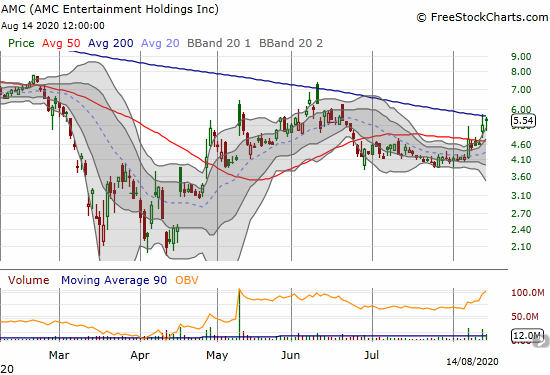
AMC Entertainment (AMC)
Cinema company AMC Entertainment (AMC) is on the move again. The repeal of a 1948 law that prevented studios from buying theaters resurrected survival hopes for AMC. I am dutifully waiting for a confirmed 200DMA breakout before getting back in.
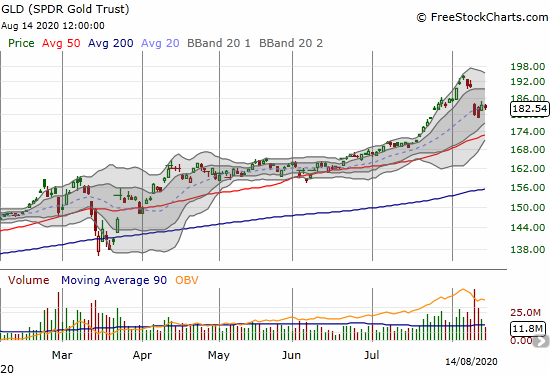
SPDR Gold Trust (GLD)
The SPDR Gold Trust (GLD) is trying to stabilize after a massive one-day drop that coincided with the 1-day (shallow) pullback in the stock market. I reflexively bought a call option to seize upon the lower prices. I am a buyer down to the 50DMA. The sell-off looks like some kind of forced or rushed profit-taking.
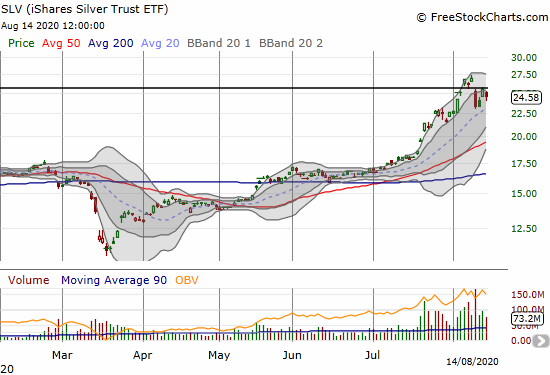
iShares Silver Trust ETF (SLV)
The iShares Silver Trust ETF (SLV) was hit even harder than GLD. SLV tends to be more volatile than GLD. I am patiently waiting on SLV since I already sold August $25 call options against my core SLV shares when SLV went parabolic. I was bracing for my SLV shares to get called away. Now it looks like the calls may expire worthless this week.
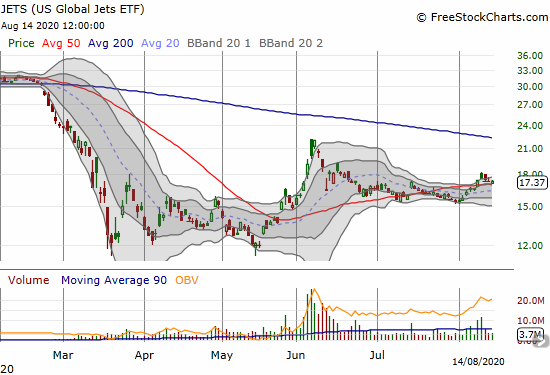
US Global Jets ETF (JETS)
US Global Jets ETF (JETS) looked ready for a new launch at the beginning of the week. The ETF waned and ended the week resting on 50DMA support. I am a buyer at the next sign of life above the 50DMA. Airlines still look like a poor investment given the high expenses, massive debt loads, and poor prospects for travel normalization. Of course, the longer-term weaknesses do not need to get in the way of short-term (technical) trading opportunities. At some point, I am expecting JETS to make another run at its overhead 200DMA resistance.
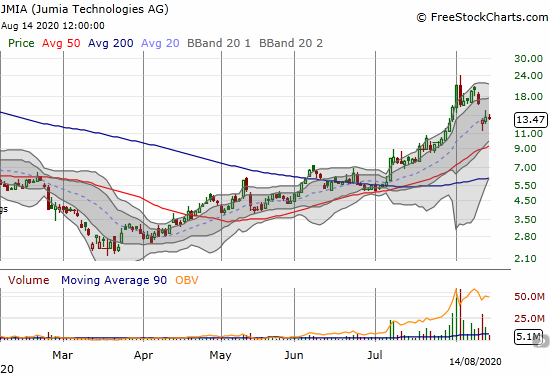
Jumia Techonologies AG (JMIA)
My plan to sell at least part of my holdings in Jumia Technologies AG (JMIA), the “Amazon.com of Africa”, turned out to be timely. The stock went from parabolic to hyperbolic going into earnings. I sold half of my position and sold calls against the rest. The post-earnings sell-off took those calls to near zero, and I quickly covered them. Now I am looking for the next entry point to rebuild my position. I am content waiting for a test of 50DMA support – if it happens. I reviewed Jumia’s earnings and concluded that the company still has a good shot at surviving the pandemic. However, I also expect the company to go to the capital markets to raise more funds before the company gets to sustainable profitability.
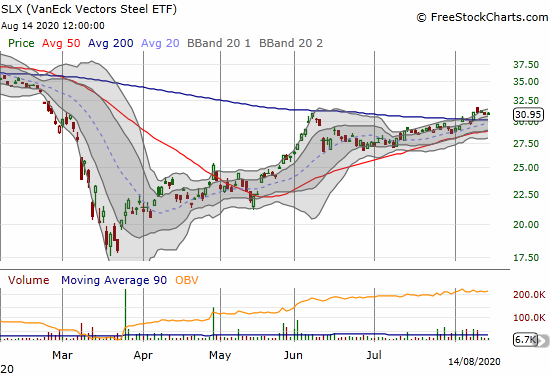
The VanEck Vectors Steel ETF (SLX)
Steel caught my eye the previous week as the VanEck Vectors Steel ETF (SLX) peeked over its 200DMA resistance. Last week SLX confirmed a 200DMA breakout and put steel plays on my buy list. I already flipped a position in Timkensteel (TMST) as the stock surged into its 200DMA resistance when SLX broke out.
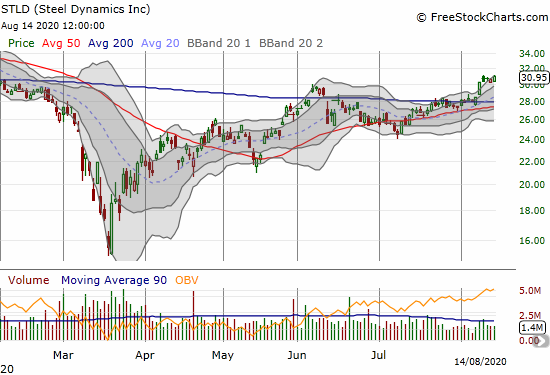
Steel Dynamics (STLD)
Steel Dynamics (STLD) confirmed a convincing 200DMA breakout. This stock is at the top of my buy list this week. STLD reported earnings July 20th and has traded higher ever since.
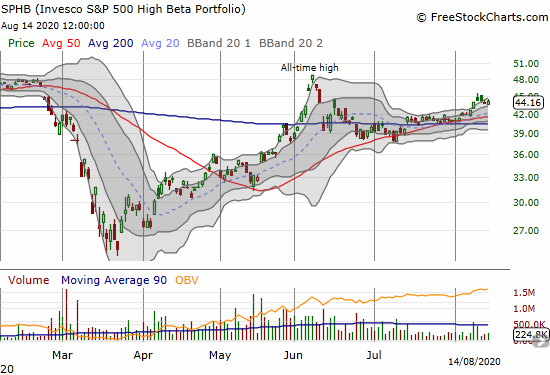
Invesco S&P 500 High Beta Portfolio (SPHB)
I made the case for Invesco S&P 500 High Beta Portfolio (SPHB) a month ago. While my profit target was the all-time high, I decided to withdraw early. SPHB looked over-extended trading above its upper Bollinger Band (BB) so quickly after being stuck in a holding pattern for over a month. I am content to leave SPHB alone unless it makes a successful test of 50DMA support.
Stock Chart Spotlight – Bullish Breakout
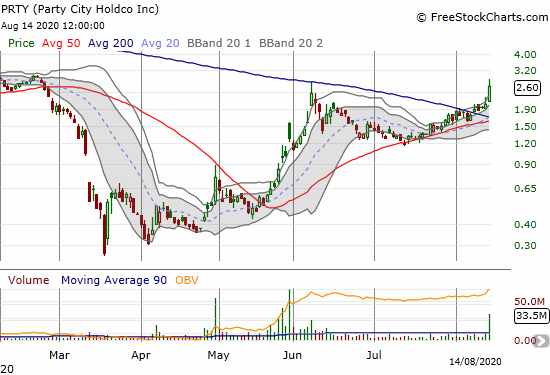
Party City Holdco (PRTY)
So far, entertainment services company Party City Holdco (PRTY) is the most speculative 200DMA breakout making this spotlight. PRTY caught my attention on Friday with shares up almost 30% on high volume. I noticed the stock has been trading higher ever since earnings on August 6th, and I decided to buy with the herd. PRTY closed at a 6-month high.
Party City is exactly the kind of business that is not likely to survive the pandemic: a high debt load and a business dependent upon large gatherings of people should be a recipe for disaster. According to Yahoo Finance, Party City holds $2.79B in debt against just $154.1M in case and $100.8M in operating cash flow. In other words, I do not expect this trade to last long. Either I will end up stopping out on a close below 50DMA support or I will clock out at $4.00 or above – bust or boom.
— – —
FOLLOW Dr. Duru’s commentary on financial markets via email, StockTwits, Twitter, and even Instagram!
“Above the 40” uses the percentage of stocks trading above their respective 40-day moving averages (DMAs) to assess the technical health of the stock market and to identify extremes in market sentiment that are likely to reverse. Abbreviated as AT40, Above the 40 is an alternative label for “T2108” which was created by Worden. Learn more about T2108 on my T2108 Resource Page. AT200, or T2107, measures the percentage of stocks trading above their respective 200DMAs.
Active AT40 (T2108) periods: Day #87 over 20%, Day #81 over 30%, Day #26 over 40%, Day #22 over 50%, Day #8 over 60%, Day #6 over 70% (overbought)
Daily AT40 (T2108)
")
Black line: AT40 (T2108) (% measured on the right)
Red line: Overbought threshold (70%); Blue line: Oversold threshold (20%)
Weekly AT40 (T2108)

*All charts created using FreeStockCharts unless otherwise stated
The T2108 charts above are my LATEST updates independent of the date of this given AT40 post. For my latest AT40 post click here.
Be careful out there!
Full disclosure: long UVXY, long GLD shares and call option, long SLV and short calls, long PRTY, long MRVL; long NKLA shares, short call and long puts
*Charting notes: FreeStockCharts stock prices are not adjusted for dividends. TradingView.com charts for currencies use Tokyo time as the start of the forex trading day. FreeStockCharts currency charts are based on Eastern U.S. time to define the trading day.