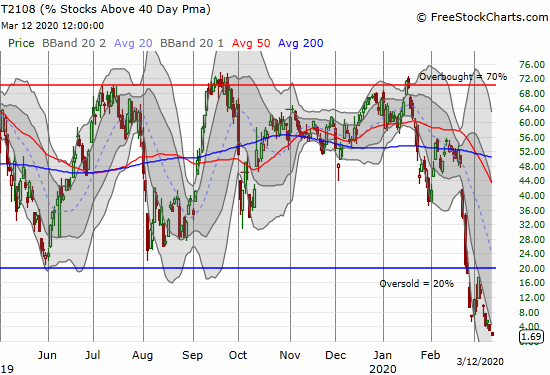
AT40 = 1.7% of stocks are trading above their respective 40-day moving averages (DMAs) (12th oversold day)
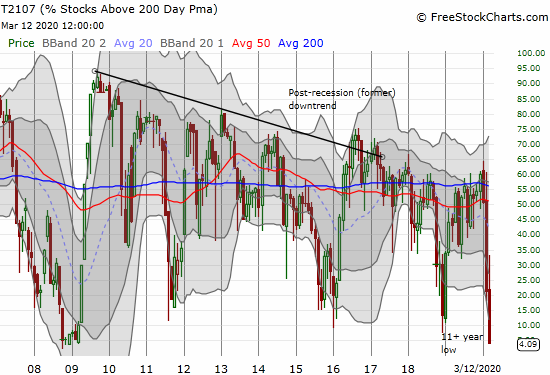
AT200 = 4.1% of stocks are trading above their respective 200DMAs
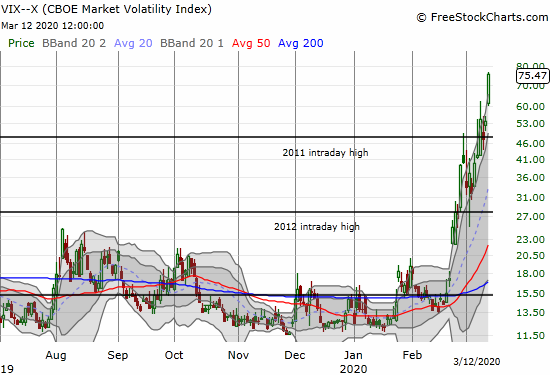
VIX = 75.5 (just short of financial crisis all-time high of 90)
Short-term Trading Call: bullish
Stock Market Commentary
When I said a persistently elevated volatility index (VIX) warned us that anything and everything was possible, I STILL could not imagine the rolling crashes this week accompanying the accelerating shutdowns of events, venues, and institutions across the country. The stock market reflects a blooming panic and very real risk as economic activity grinds toward a halt.
The NBA’s shutdown announcement yesterday was very symbolic. While plenty of shutdowns occurred ahead of the NBA, this one stuck out because just one basketball player tested positive for coronavirus (COVID-19) and suddenly a multi-billion industry shut down in an instant. Thousands of jobs are now on the line and the economic livelihood of many more are threatened. The NBA’s shutdown brought home for me the non-linearity of this latest economic crisis: one small event can trigger a collapse many more times the magnitude of the single event. It is the kind of relationship not envisioned in the AT40 trading strategy of market extremes.
Financial and fiscal authorities are scrambling to figure out a fix. Unfortunately the economic lever of getting companies to invest and consumers to spend is breaking down. Companies that are shutting down for health reasons have nothing to invest in. Workers who are taking shelter at home are not going out to spend and entertain just because loans are cheaper. Yet and still, here is part of what the New York Federal Reserve said to describe the significant monetary actions taken on the day:
“These changes are being made to address highly unusual disruptions in Treasury financing markets associated with the coronavirus outbreak. Reserve management purchases into the second quarter will continue to be conducted with this maturity allocation. The terms of operations will be adjusted as needed to foster smooth Treasury market functioning and efficient and effective policy implementation.”
The Federal Reserve is not even talking yet about the “unusual disruptions” in the stock market. The bond markets are a lot more important and their stress is everyone’s stress. Yet one more reason to be uncomfortable in my bullishness for buying into this historic oversold period.
Oversold
AT40 (T2108), the percentage of stocks trading above their respective 40-day moving averages (DMAs), stretched into its 12th oversold day after closing at a rock bottom 1.7%. This level is so extreme that it no longer conveys new information. The stock market is as oversold as it can get with the stock market acting out in very bearish form. AT40 has hit these depths only TWICE before: during the 2008/2009 financial crisis and in the wake of the 1987 stock market crash.
AT200 (T2107), the percentage of stocks trading above their respective 200DMAs, has delivered the signature of a bear market for several days. Today’s collapse to 4.1% was just the exclamation point. The monthly chart below shows how the stock market’s narrowing breadth has characterized nearly the entire post-recession stock market. Most concerning was AT200’s inability to get above 60-65% since the end of 2017. I have often marveled at this chart trying to grasp its potentially bearish implications. This latest selling cycle once again convinced me that the dangers implied in the lower highs are (were?) real.
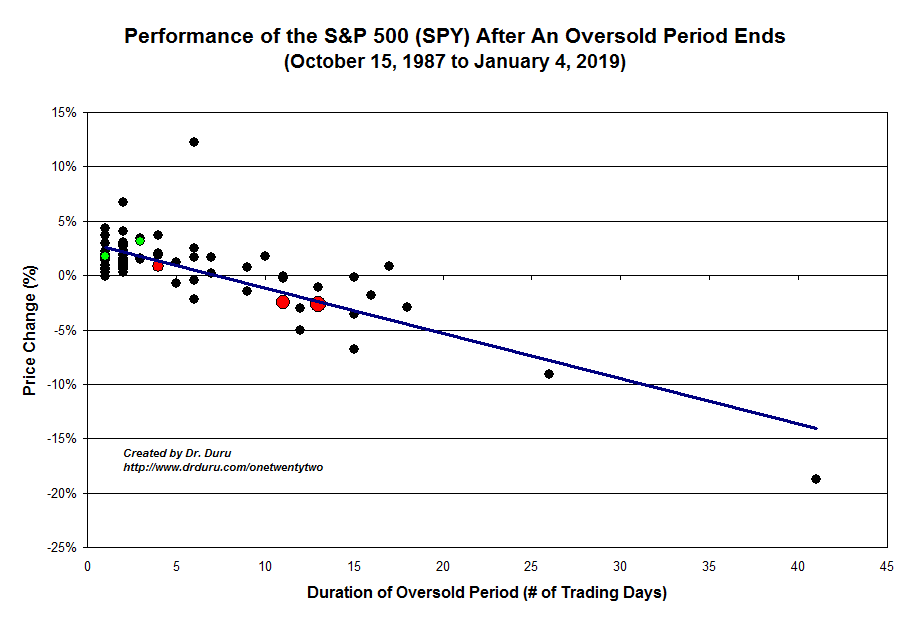
At 12 days in duration, this oversold period has hit historic levels. Only 10 other oversold episodes since 1987 have lasted longer. The S&P 500 is now down 20.4% since going oversold on February 26th. On that basis alone, the index is in bear market territory. The index is down 26.7% since hitting an all-time high just 16 trading days ago! The S&P 500 will almost surely exit this oversold period at a loss, but history says the sooner it can emerge, the more upside exists in riding out the selling.
The Stock Market Indices
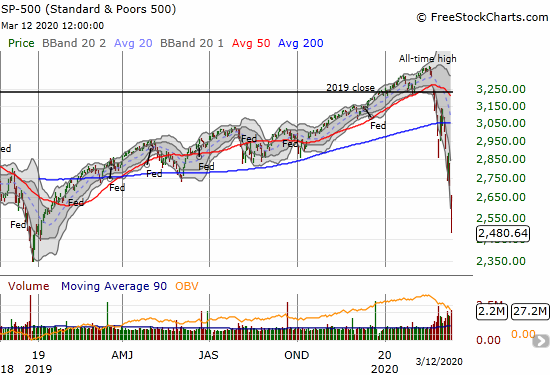
The S&P 500 (SPY) chart still says it all. The 9.5% loss and close near the lows of the day decisively left behind a lot of churn. Circuit breakers once again kicked in to slow down the selling pressure. The index is approaching the lows of the big 2018 sell-off. My mind cannot right now even wrap itself around the prospect of even THAT support giving way. Yet, in a bear market with a persistently high volatility index (see below), supports are made for breaking.
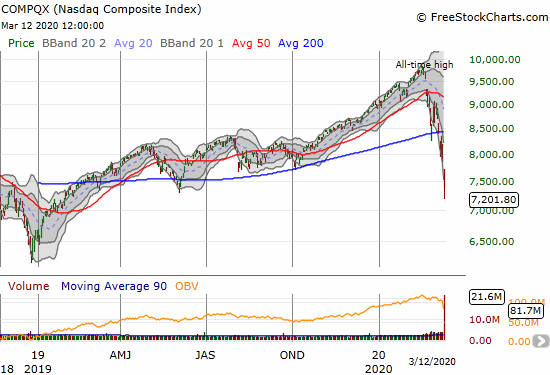
The NASDAQ (COMPQX) finally gave up its 200DMA support this week and sellers were not satisfied. The tech-laden index lost 9.4% on the day and closed at a 13-month low. The NASDAQ just barely slid by the June, 2019 low. I shudder to contemplate that the index’s next destination could be the late 2018 low. That level is the next “natural” support.
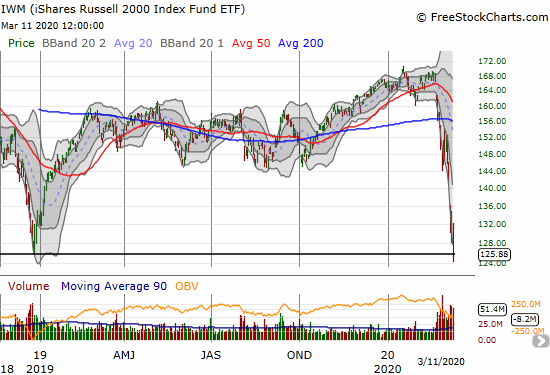
The iShares Russell 2000 Index Fund ETF (IWM) continued its relative under-performance with a whopping 11.1% loss and close to a 4-year low. IWM was last this low BEFORE the November, 2016 election. This major milestone has me back on watch for “Trump reversal” trades. These are equities and sectors which both scar the current economic record, but also present a lot of potential upside for the next upturn.
However, I learned/remembered that IWM is full of financial and energy names. Energy is particularly toxic right now, so I am done with trying to use IWM as a “catch-up” trade to the other major indices. IWM is lagging for good reason.
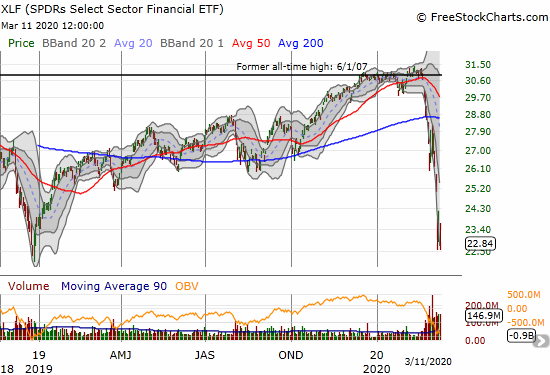
The SPDRS Select Sector Financial ETF (XLF) lost 10.8%. Like IWM, XLF’s under-performance has generated a major milestone: the financial index has nearly reversed all of its gains since President Trump’s election. Again, it is hard to wrap my mind around the historic moves that have happened in just the last 3 weeks.
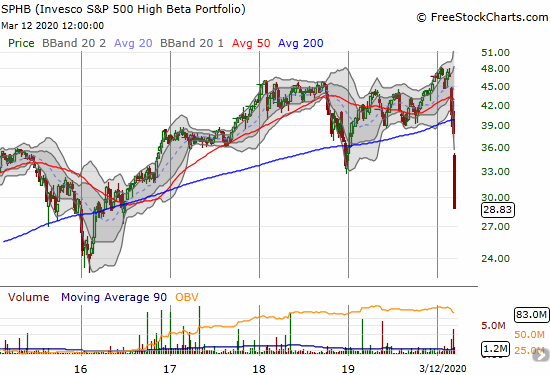
The Invesco S&P 500 Low Volatility ETF (SPLV) was again not spared the carnage (I believe only ONE S&P 500 stock managed a gain today!). SPLV lost 9.4%. At the intraday lows, SPLV tested the 2018 lows but rebounded. The Invesco S&P 500 High Beta ETF (SPHB) lagged SPLV once again. SPHB’s 12.3% loss took the higher risk list of stocks passed, you guessed it, the November, 2016 election. SPLHB was last this low in July, 2016!
Volatility
The volatility index (VIX) continues to stair-step higher and defy gravity. Even if I imagined the VIX getting as high as 75.5, I would have pictured a 1-2 day surge followed by a rapid implosion. The intraday highs from 2011 and 2012 are distant memories. The 90 intraday high from the financial crisis is now in sight. I have stopped trying to bet against this trend and will just have to wait for more convincing and confirmed topping patterns.
The Short-Term Trading Call
This oversold period is now at historic levels from many angles. My bullish short-term trading call looks out of step with this awful look. The AT40 trading strategy is good for extreme trading conditions, but it has its limits during true outlier trading conditions like these.
One adjustment I made this week was to slow down my buying. The AT40 trading rules essentially recommend getting more and more aggressive the more extreme the oversold period gets. This approach makes plenty of sense in a bullish market, but not so much in a bear market. As I noted above, supports are made to be broken in bear markets. So now, I am adding slowly for my long-term accounts, and I am taking select shots with call spreads, vertical and calendar, in the short-term account. With the market gapping down and driving hard and fast toward intraday lows, the call options give me a confronting cap on my potential losses. I will return to aggressive mode once the VIX prints a convincing topping pattern.
The conservative strategy for trading oversold periods is to wait to buy until AT40 exits oversold. For this episode, the conservative strategy helped avoid a LOT of loss, but it may also miss out on a lot of upside. Moreover, at this rate, by the time the stock market exits oversold conditions, buyers may be too tired to press on. The bears will pounce on such a moment.
Stock Chart Reviews – Below the 200DMA
iShares MSCI Brazil Index Fund (EWZ)
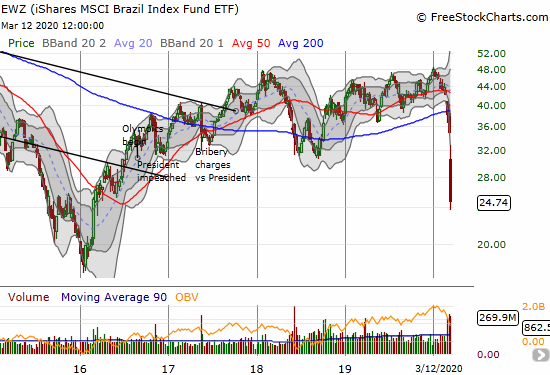
Years ago, I established a trading rule to buy the iShares MSCI Brazil Index Fund (EWZ) whenever it loses at least 20%. Today it finally occurred to me to trigger this rule. I looked at EWZ for the first time in many months and was blown away to see it down 42.2% in just three weeks! This trade to me is at the same time a no-brainer and an example of how I have to fight through my discomfort and unease to just execute on a rule. Of coruse, EWZ has risk back to at least its 2016 low. At THAT point, EWZ becomes an outright steal.
iShares Dow Jones US Home Construction Index Fund ETF (ITB)
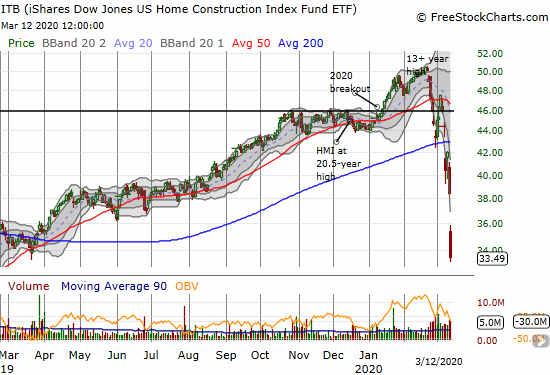
The rolling market crash has blown up the seasonal trade on home builders. The iShares Dow Jones US Home Construction Index Fund ETF (ITB) fell a whopping 12.9% and closed at a 13-month low. This economically-sensitive ETF went from riding high on strong housing data to plunging with the rest of the despair in the stock market. At a 33% discount from the 13+ year high, I feel like I am getting a major bargain even as this damage will leave a lasting footprint in the sector’s behind.
Lennar (LEN)
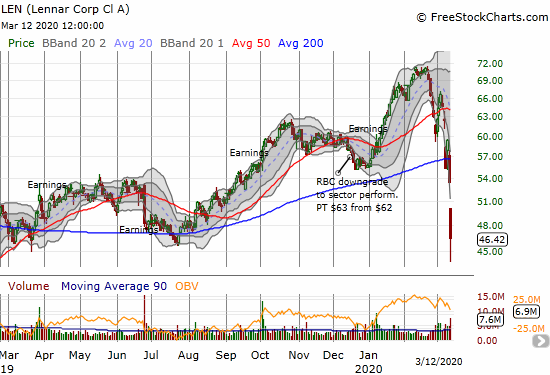
I just finished touting Lennar (LEN) as an example of a strong home builder stock that was diverging from the weaker members in the ITB. Strength quickly turned into weakness with today delivering a 13.1% blow. The market is clearly preparing for a major slowdown ahead.
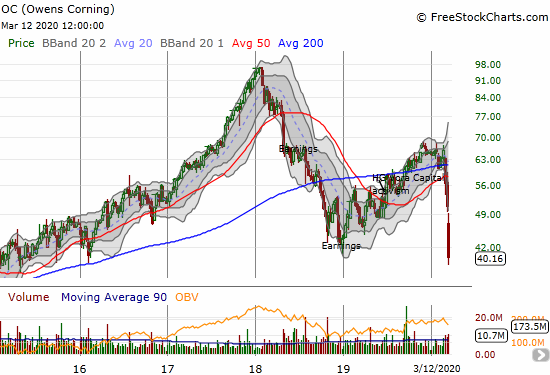
Owens Corning (OC)
Ownes Corning (OC) makes construction and building materials. The company is a proxy indicator for the health of the sector. OC went from an example 200DMA breakout to leading the way downward. An 8.5% loss plunged OC to a near 5-year low. The weekly view shows how OC came far short of the major peak in early 2018 and flashed its own warning signal for the sector.
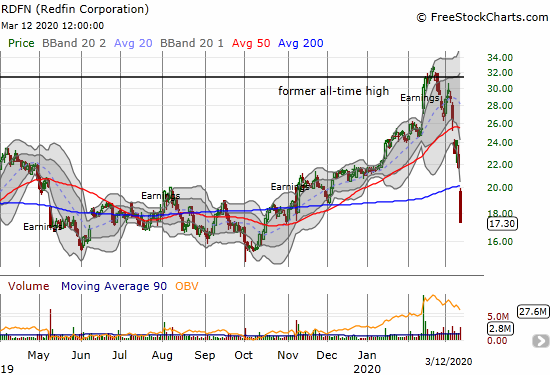
Redfin (RDFN)
Redfin (RDFN) is one of many examples of the quick and brutal turn of events. Just last month, RDFN reported a bullish earnings report that included executives staking a claim to a robust future. The market took down RDFN by 20.4% and returned the stock right back to last year’s consolidation range. I plan to double down on RDFN for good measure.
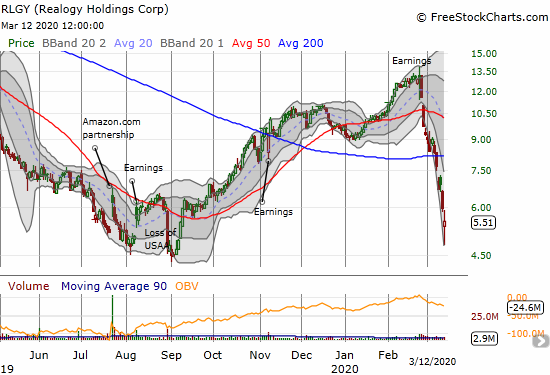
Realogy Holdings (RLGY)
Realogy Holdings (RLGY) is almost the mirror opposite of RDFN. The stock is back to the area of churn below its 50MDA last year. That was the moment RLGY first caught my interest…and skepticism.
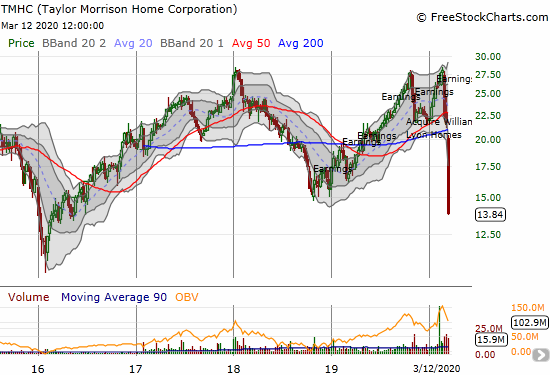
Taylor Morrison Home Corporation (TMHC)
Taylor Morrison Home Corporation (TMHC) has become a major laggard among home builders. I am not surprised because I thought its recent acquisition of another builder was timed poorly. Now it turns out the company invested in more capacity at a time when they may need to throttle growth plans. TMHC also used up much needed balance sheet strength on this relatively large acquisition.
Toll Brothers (TOL)
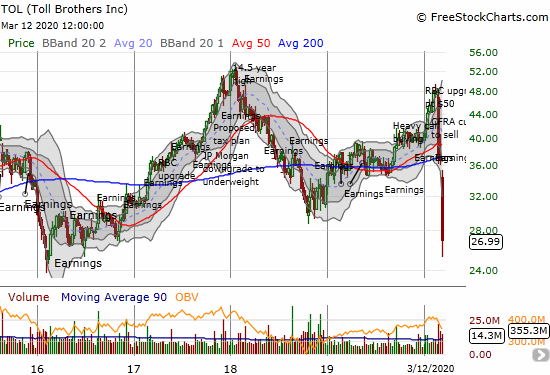
I now wish I had not read the earnings report from Toll Brothers (TOL) in the early part of this sell-off. That earnings news is practically irrelevant given the current economic turmoil. Yet, my bullish interpretation of those results made me rush into the stock. The weekly chart shows both the danger sign of TOL failing to challenge the former 2018 high and also the significant discount in the stock now at levels last seen in 2016.
Whirlpool (WHR)
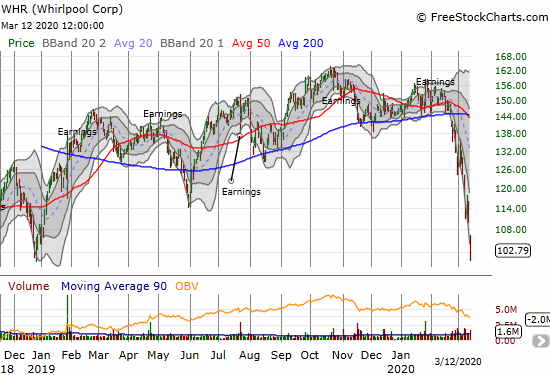
Sellers have pushed Whirlpool (WHR) nearly straight down since late February. The stock lost 7.0% and challenged its major low from late 2018.
Stock Chart Reviews – Above the 200DMA
Apple (AAPL)
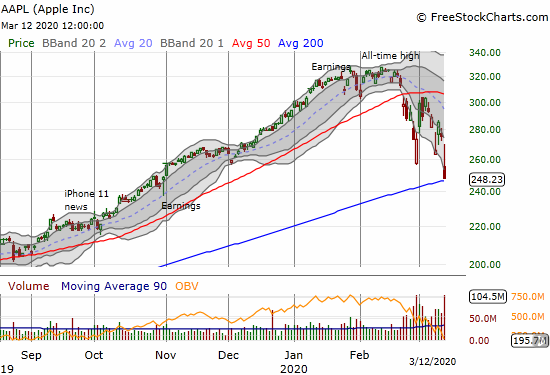
Looking for one of the 4% of stocks still trading above their respective 200DMAs? Apple (AAPL) is one of those lucky few. If sellers break AAPL, I foresee two binary possibilities: 1) buyers will finally see enough bargains to go on a buying spree, or 2) buyers give up all hope and the resulting rush to lock in remaining profits in AAPL ignites a fresh wave of selling in the stock market. Regardless of the outcome, I still see AAPL staying stuck in a trading range with its 50DMA as the cap.
— – —
FOLLOW Dr. Duru’s commentary on financial markets via email, StockTwits, Twitter, and even Instagram!
“Above the 40” uses the percentage of stocks trading above their respective 40-day moving averages (DMAs) to assess the technical health of the stock market and to identify extremes in market sentiment that are likely to reverse. Abbreviated as AT40, Above the 40 is an alternative label for “T2108” which was created by Worden. Learn more about T2108 on my T2108 Resource Page. AT200, or T2107, measures the percentage of stocks trading above their respective 200DMAs.
Active AT40 (T2108) periods: Day #12 under 20% (oversold day #12), Day #13 under 30%, Day #24 under 40%, Day #15 under 50%, Day #34 under 60%, Day #38 under 70%
Daily AT40 (T2108)

Black line: AT40 (T2108) (% measured on the right)
Red line: Overbought threshold (70%); Blue line: Oversold threshold (20%)
Weekly AT40 (T2108)

*All charts created using FreeStockCharts unless otherwise stated
The T2108 charts above are my LATEST updates independent of the date of this given AT40 post. For my latest AT40 post click here.
Be careful out there!
Full disclosure: long IWM calls, long QQQ calls and shares, long SSO, short UVXY, long ITB shares and call options and spread, long RDFN, long LEN calls, long TOL shares and calls, long EWZ,
*Charting notes: FreeStockCharts stock prices are not adjusted for dividends. TradingView.com charts for currencies use Tokyo time as the start of the forex trading day. FreeStockCharts currency charts are based on Eastern U.S. time to define the trading day.

I have been silent for a long time, but I read every post. Your methodology is spot on. I still follow the ole 3 day rule which dictates no action in the face of historic events/elevated VIX. SSO is the place to begin to nibble while this bottom forms.
“This level is so extreme that it no longer conveys new information. The stock market is as oversold as it can get with the stock market acting out in very bearish form.”
Unless Friday’s ‘relief rally’ is the beginning of a V-shaped recovery, I would respectfully disagree with your position that the market is as oversold as it can get. It can get worse. Just because T2108 is at 1.7% doesn’t mean it can’t go fractional. The CNN “Greed and Fear Index” has recently hit 1 (Extreme Fear), but that doesn’t mean it can’t go lower. It just means that it pegs the meter. The VIX could go higher. It’s possible.
Longer term, these conditions are simply not sustainable. Short and intermediate term, better have your tranquilizers ready.
Thanks for checking in Richard and sticking by the blog! After we are through this episode I will need to update the oversold trading strategy to take into account even more extreme possibilities.
I’ll accept that correction. To be more precise, I meant that an even lower AT40 does not provide new information to trade on. However, the VIX increases in importance the lower AT40 goes and the longer the oversold period lasts. I will be more precise in future posts. I also need to update my AT40 rule book to more precisely reflect these kinds of scenarios.