
Housing Market Intro/Summary
In my last Housing Market Review, I finally conceded to a sustained rally in the stocks of home builders. I noted how this stubborn rally moved counter to unimpressive data. In September, several data points finally came together to support the strong sentiment in financial markets. Low interest rates dominate the story in the housing market and buyers are still stepping up to take advantage of these low rates even home prices march higher.
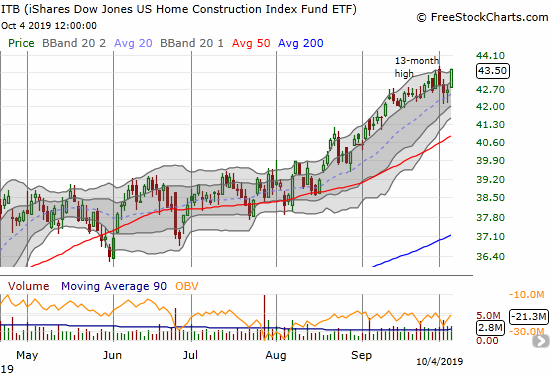
The strong performance of home builders was really on display in August when the iShares Dow Jones Home Construction ETF (ITB) ended the month with a gain and more home builders broke out to new highs even as the stock market struggled. In September, ITB rallied nearly straight up for an impressive 6.3% gain that far outpaced the 1.7% gain in the S&P 500 (SPY). Of course, ITB is still playing catch-up on a longer timescale. For example, ITB is still 5.6% off from the 10-year high it recorded in January, 2018. The S&P 500 is just 2.4% below its all-time high set last July. In other words, home builder stocks are still largely recovery stories.
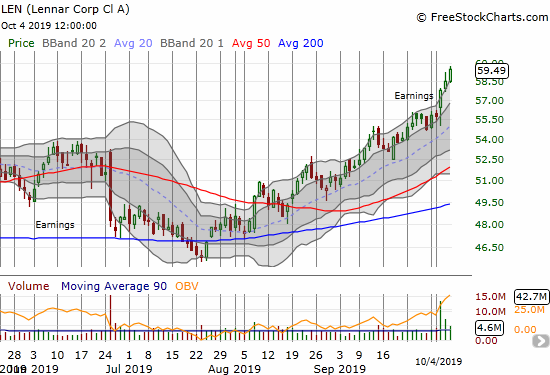
Individual home builders tell impressive stories. Lennar (LEN) soared to an 18-month high after posting well-received earnings last week. This move validates my assessment after July earnings that the market misunderstood the story and created a unique buying opportunity. LEN now trades above the top of my call spread, so I will be looking to take profits soon and reposition. The stock looks quite stretched right now after closing three days in a row above its upper Bollinger Band (BB).
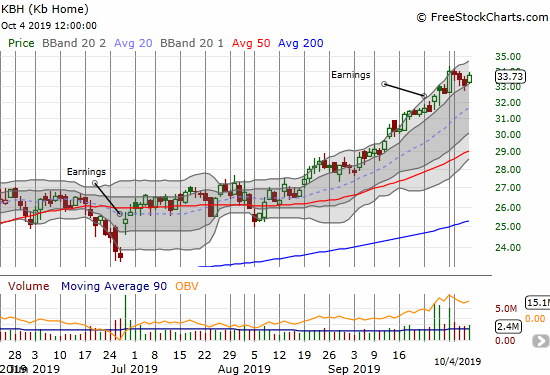
KB Home (KBH) is also benefiting from a well-received earnings report. KBH participated in the September run-up for home builders and is still running. KBH last traded this high back in January, 2018.
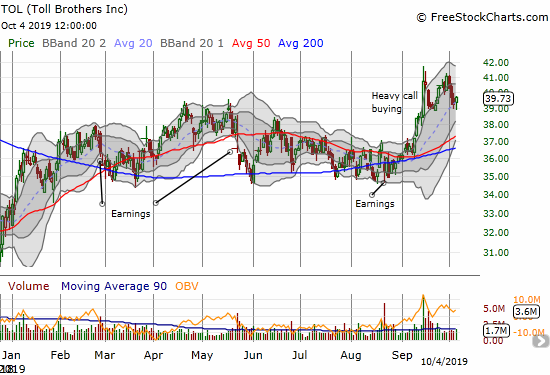
Toll Brothers (TOL) pulled back sharply last week along with the stock market sell-off. I decided to hold my call options in anticipation of a continuation of the recovery from the last pullback. That “patience” cost me all my profit, so now I am back to waiting for the next bounce. Thursday and Friday’s double bounce off the low of the previous pullback increases the chances for a fresh upward push.
New Residential Construction (Single-Family Housing Starts) – August, 2019
After a sudden burst of activity to start the year, housing starts cooled from February to June, 2019. The last two months delivered a notable pickup.
Single-family housing starts for July were revised upward from 876,000 to 880,000. August starts increased month-over-month by 4.4% to 919,000. On an annual basis, single-family housing starts increased by 3.4%. From October, 2018 to May, 2019 the year-over-year percentage gains were negative except for January’s 9.4% gain. The last three months have delivered low single-digit year-over-year gains. This small change in trend is encouraging but still far below the level of activity that I think would be commensurate with the on-going optimism of home builders. The line of support in 2019 for starts at 800,000 looks like it will hold solidly for the rest of the year.
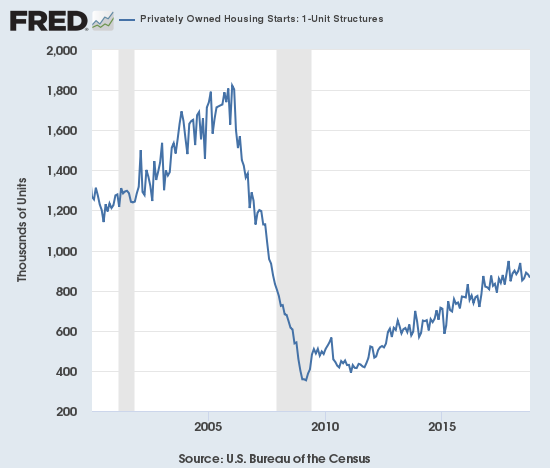
Source: US. Bureau of the Census, Privately Owned Housing Starts: 1-Unit Structures [HOUST1F], retrieved from FRED, Federal Reserve Bank of St. Louis, September 30, 2019.
On a regional basis, the Northeast was the lone loser which marks a fourth straight month of year-over-year losses. The West seems to be leaving its streak of declines behind now. The Northeast, Midwest, South, and West each changed -10.6%, +16.1%, +1.3%, and +5.3% respectively. I previously expected fresh weakness in new home sales later in the year but the stabilization in the West provides greater reason for optimism even as the Northeast experiences a notable slowdown.
Existing Home Sales – August, 2019
The 16-month streak of year-over-year declines for existing home sales came to an end, just barely, in July. I clung to the notion of an on-going downtrend since last year. This month’s increase over the February, 2019 surge finally ends that downtrend. This juncture is important as a potential turning point where the housing data finally catches up with the rally in housing related stocks. Still, I only reluctantly acknowledge an end to the downtrend because the path to get here was so slow and incremental that the move looks unconvincing and vulnerable.
The seasonally adjusted annualized sales in August of 5.49M were up 1.3% month-over-month from the unrevised 5.42M in sales for July. Year-over-year sales increased 2.6%. Existing home sales are at their highest level of the year.

(As of the March, 2018 data, the NAR further reduced historical data to just 13 months. For historical data from 1999 to 2014, click here. For historical data from 2014 to 2018, click here) Source for chart: National Association of Realtors, Existing Home Sales© [EXHOSLUSM495S], retrieved from FRED, Federal Reserve Bank of St. Louis, October 3, 2019.

The National Association of Realtors (NAR) celebrated May sales as delivering the numbers it “expected.” For June, the NAR admitted to a bit of astonishment (or bewilderment?) at the current market dynamics even as sales finally broke their 16-month losing streak. Given earlier concerns, I would expect the NAR to celebrate a new high for 2019 in existing home sales, but the NAR surprisingly failed to note the achievement. This month’s focus of concern was the Federal Reserve; the NAR believes the Fed is not moving fast enough on easy money monetary policy: “The Federal Reserve should have been bolder and made a deeper rate cut, given current low inflation rates…” The NAR also made its now regular plea to home builders to do more to add to the inventory of available homes.
The median price of an existing home hit $278,200, a jump of 4.7% and the 90th straight year-over-year gain. July had the same year-over-year gain. This relentless ascent in price has not changed much whether inventories happen to drop or gain in any given month.
Absolute inventory levels of 1.86M homes declined 2.1% from the 1.89M homes for sale in July and down 2.6% year-over-year. Based on months of supply, inventory also declined: “Unsold inventory is at a 4.1-month supply at the current sales pace, down from 4.2 months in July and from the 4.3-month figure recorded in August 2018.”
After impressive year-over-year share gains in March and June, July’s share of first-time home buyers dropped to 32%. August’s share dropped another percentage point. This share was flat year-over-year, same as July’s year-over-year change. This is a second surprise month given home builders consistently report a larger share of sales going to entry-level buyers. The average share for first-time homebuyers for 2016 was 35%. The NAR’s 2017 Profile of Home Buyers and Sellers reported an average of 34% for 2017 and 33% for 2018.
Investors purchased 14% of homes in August, significantly up from July’s 11%. Investors purchased 13% of homes a year ago. This surge helps explain the drop in share of entry-level buyers; this dynamic is now something to watch. Investor sales averaged a share of 15% in 2017 and 14% in 2016. The NAR has yet to release the average for 2018.
The highlight for regional sales is the end of a 13-month streak of declines for year-over-year sales in the West. Here are the regional changes: Northeast +1.4%, Midwest +6.6%, South +3.6%, West +1.8%.
The regional year-over-year changes in median prices delivered another surprise. The Northeast declined for a second straight month. The changes are small, but they stand out given the relentless price increases for existing home sales overall and in other regions. Here are the regional year-over-year changes in median home prices: Northeast -0.3%, Midwest +2.3%, South +5.4%, West +5.7%.
Single-family sales increased 1.2% from June and increased on a yearly basis by 2.9%. The median price of $280,700 was up a healthy 4.7% year-over-year, slightly higher than June and July’s 4.5% and May’s 4.6% year-over-year gains.
California Existing Home Sales – August, 2019
The California Association of Realtors (CAR) reported sales of existing Californian homes at a 10-year low in January. July sales were at a 15-month high and the 1.1% year-over-year gain ended a 14-month losing streak. August sales continued the recovery from January’s plunge with a 1.6% year-over-year gain. Sales were down 1.3% from July.
Unlike June when sales declines were stark and region-wide, July delivered sales gains in all regions except the San Francisco Bay Area. Surprisingly, sales fell both monthly and year-over-year in all major California regions; meaning that gains came from outlying areas.
February’s median price was the lowest in 12 months. Poor sales numbers did not prevent June’s median price from hitting a new record for the third month in a row. The median price increased in August by 1.5% from July to $617,410, a 3.6% year-over-year gain. CAR acknowledged a 3-year low in mortgage rates helped boost sales in California while at the same time fueled strong price impacts. In other words, on net, affordability remains a major challenge as the price response to demand is very inelastic.
New Residential Sales (Single-Family) – August 2019
The Census Bureau revised May sales of new single-family homes downward from 602,000 to 598,000. Last month, the Census Bureau made an extremely large upward revision for June from 646,000 to 728,000. This month, the revision was only an additional 1,000 sales. The upward revisions continued with July going from 635,000 to 666,000. After July’s cooling, August sales heated things back up with a 7.1% month-over-month gain and a startling 18.0% year-over-year increase. August’s year-over-year pop marginally beat out June’s large year-over-year gain. These kinds of percentage gains last occurred in late 2017. If new home sales are being pulled forward as I suspect then a major air pocket would have to appear in the next few months based on the current torrid pace of sales.
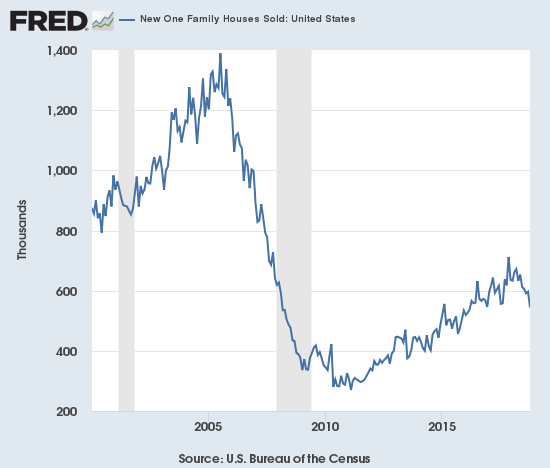
Source: US. Bureau of the Census, New One Family Houses Sold: United States [HSN1F], retrieved from FRED, Federal Reserve Bank of St. Louis, September 30, 2019.
Since hitting a post-recession peak in November and December, 2017, the median price of a new single-family home has trended downward based on a series of new lows. July’s median price matched January’s $305,400 which was a 2-year low. The lower prices during the Spring Selling season are consistent with the stories from home builders of experiencing their strongest business at lower price points. However, the median price shot upward in August to $328,400. The average price also shot up to $404,200, a new post-recession high.
The August price surge was clearly driven by a sudden and broad shift back toward higher priced homes. The share of homes sold at the two lowest price tiers dropped by one percentage point each. The share of sales to homes priced from $200,000 to $299,999 and from $300,000 to $399,999 each dropped three percentage points. Sales in the $400,000 to $499,999 range jumped from 10% to 14%. Sales in the $500,000 to $749,999 range jumped from 11% to 15%. The highest price range increased from 6% to 8%, the highest share since April, 2018. This shift means the surge in sales for August was driven by a rush back to the market for higher-end buyers. These dynamics clearly work against my expectations for a sales air pocket later this year! However, these dynamics also bear watching in case they are the prelude to (price) exhaustion from lower-end buyers.
Ever since the inventory of new homes for sale jumped to 6.0 months of sales in June, 2018, inventory has pivoted around the 6.0 level. Last June’s inventory sat at 6.3 days of sales. July increased ever so slightly to 6.4. However, sales in August were high enough to send inventory plunging back to 5.5 days of sales.
The Northeast sales numbers continued their volatility. After a 47% drop (revised) in June, sales soared 36.0% year-over-year in July (revised). August sales stayed flat with the previous year’s August. The Midwest fell again 7.2%. The South soared 24.9%. The West increased a healthy 17.9%. Clearly, August’s surge in sales was heavily region-driven.
Home Builder Confidence: The Housing Market Index – September, 2019
The Housing Market Index (HMI) drifted along for much of the year. In September, HMI finally broke out to a new high for the year and defied my expectations for no further gains for the year. The National Association of Home Builders (NAHB) attributed this optimism to “low interest rates and solid home buyer demand.” Yet, the U.S. versus China Trade War is tempering demand in manufacturing-oriented parts of the country and raising the costs of construction.
“NAHB’s latest Home Building Geography Index shows that home construction in manufacturing areas started weakening in the last quarter of 2018.”
The Single-Family Detached Present component of the HMI drove all the gains for HMI. So while the HMI looks good, the forward-looking components may be signaling reasons for caution. In particular, the SF Detached Next Six Months component peaked in April and has drifted slightly lower since then.
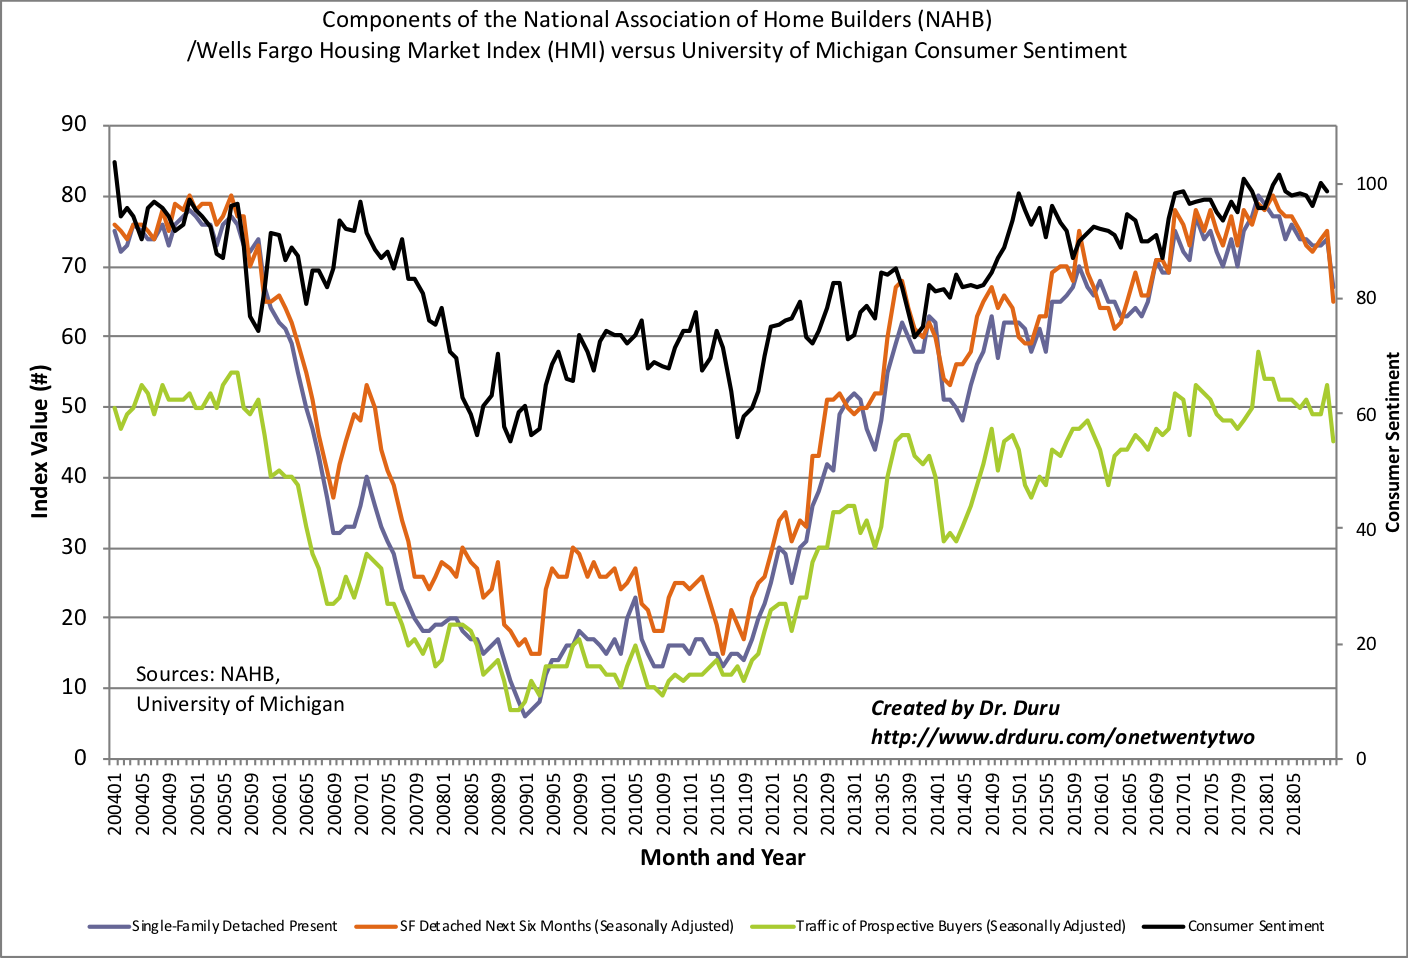
Source: NAHB
The regional results were strong again. I am actually surprised the overall HMI only gained a point with the Northeast soaring from 57 to 65 to tie its high for the year, the South gained 3 points from 69 to 72, and the West gained a point from 75 to 76. Only the Midwest failed to gain and stayed flat from August’s 59 reading.
Parting thoughts
Nightly Business Report (NBR) did a segment on a “housing mismatch” between housing demand and housing supply (video below starting at the 13:00 mark). “Move-up” buyers have been most able to buy homes. This segment looked like a premature reaction to the latest month of housing data showing a spike in the share of investors purchasing existing homes and the abrupt shift in sales to higher-priced homes. Until this latest month of data, the main theme for the year has been the strength in new home buyers and entry-level homes.
The segment provided a key data point that 25% of home buyers want a home priced at $150K or below, yet only 3% of builders are constructing homes in that price range. These data need to be contextualized by regions given the wide spread of prices across the country. For example, almost no one in California should expect to buy a home for $150K; the media price for an existing home is $617K. Californian buyers are lucky to find something reasonable for $300K in lower-priced parts of the state. Still, this NBR segment provides more hints on why the housing market remains extremely sensitive to small moves in interest rates.
Be careful out there!
Full disclosure: long ITB call spread, long LEN call spread, long TOL calls