
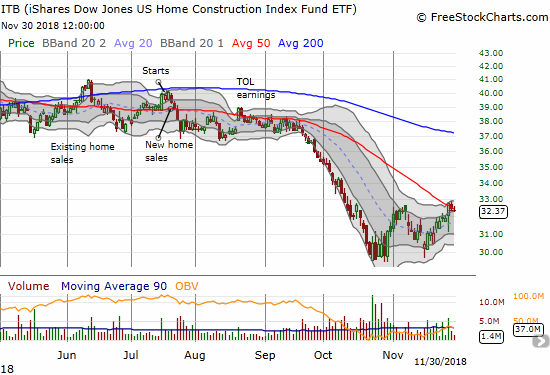
I saw a flicker of hope for home builders in the May Housing Market Review. Traders decided to snuff that flicker out very quickly afterward. When I wrote June’s housing market review and described a “struggling flicker,” the iShares US Home Construction ETF (ITB) was once again bouncing off the bottom of 2018’s trading range. By the time of the September Housing Market Review, ITB was precariously holding onto its trading range. October ushered in a complete collapse that was very plunge-worthy. ITB gained 3.8% in November in a small sign of stabilization that looked like a successful test of the October low. The declining 50-day moving average (DMA) held as resistance and led to a resumption of the sell-off in December. ITB at one point hit a new 23-month low on Christmas Eve last week.
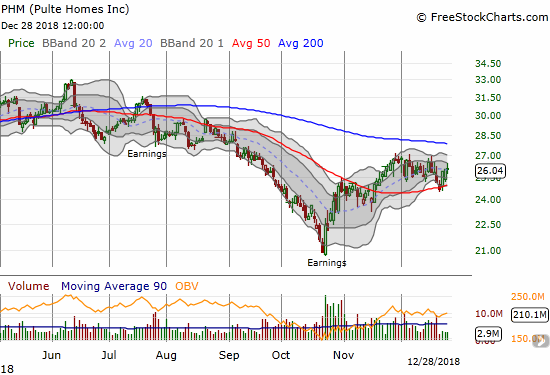
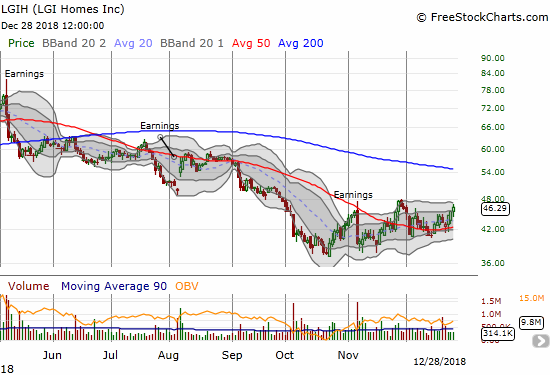
Two of the better performing home builder stocks are Pulte Homes (PHM) and LGI Homes (LGIH). PHM has recovered well from a 20-month low in October. The stock out-performed in December as the rest of the stock market sold-off. also printed a low in October and, like PHM, even trades above its 50DMA. Both stocks form part of the seasonal trade I expanded in November.
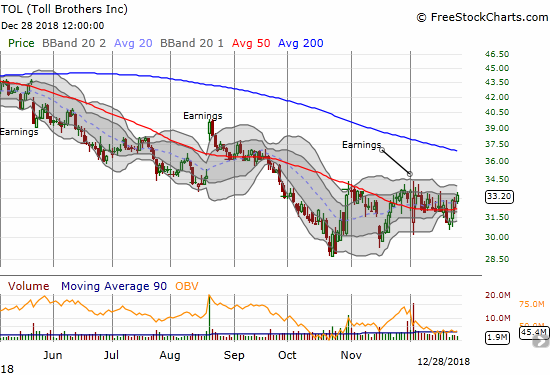
Toll Brothers (TOL) is actually UP 0.7% in December and looks like it is trying to stabilize after sharply rebounding from a large post-earnings gap down to start the month. I will buy the stock if it can close above its post-earnings intraday high.
The deteriorating conditions in the housing market caught the notice of the Federal Reserve per the minutes from the November meeting. However, surprisingly, the Fed had nothing to say about housing in its December statement on monetary policy. During the press conference, only ONE person asked about housing. Federal Reserve Chair Jerome Powell clearly avoided even saying the word “housing.” From the transcript:
“STEVEN BECKNER….The 10-year note yield has gone down pretty steeply, roughly 50 basis points, I think, in recent weeks. I wonder what you make of it. Is it a worrisome sign for you in terms of the outlook for growth, for inflation? On the other hand, could it be a positive, in terms of presumably bringing down mortgage rates and helping the housing sector?
CHAIRMAN POWELL. Again, we do focus on a broad range of financial indicators, and I—really, we don’t obsess about any particular one. You know, we look at a whole range of them, and we ask ourselves, what’s really going on in the broad picture out there?…As I mentioned, our forecast for next year is—I think, in keeping with most other forecasts—is that we’ll still have solid growth next year, declining unemployment, and a healthy economy.”
In the last Housing Market Review, I stated “I am sure the wording will be carefully crafted to avoid creating panic about the housing market.” THIS kind of omission goes too far in trying to avoid panic; this approach is borderline negligence. Prices must not yet be low enough to get the Fed’s focus. I eagerly await the minutes of the December meeting to see whether Fed members have advanced their thinking on the health of the housing market but have just not made that health a core part of policy or economic forecasting.
New Residential Construction (Single-Family Housing Starts) – November, 2018
While housing starts surged in May and left no doubt that home builders were confident as ever, the subsequent plunge in housing starts in June appeared to temper that enthusiastic interpretation. From July to October, housing starts seemed to stabilize. However, November’s decline likely confirmed that housing starts have topped out for the foreseeable future.
Single-family housing starts for October were revised slightly downward from 865,000 to 864,000. November starts decreased month-over-month by 4.6% to 824,000. On an annual basis, single-family housing starts plunged by 13.1%. This decrease is the fourth in the last six months. The depth of this decline confirmed the rapid drop in home builder sentiment (see below) and is the worst since starts were regularly dropping double-digit percentages in 2011. This sharp decline is also a natural conclusion to the deceleration in housing starts I noted through much of 2018.
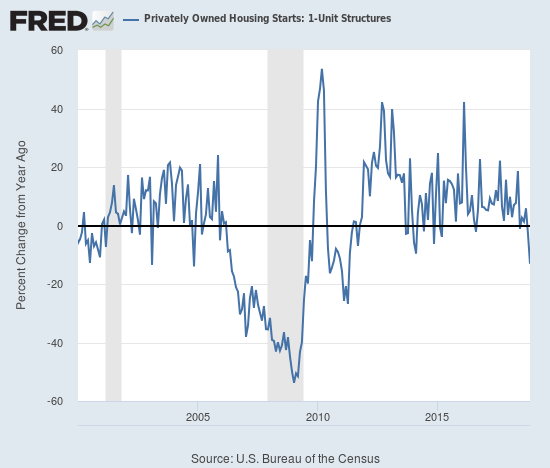
Source: US. Bureau of the Census, Privately Owned Housing Starts: 1-Unit Structures [HOUST1F], retrieved from FRED, Federal Reserve Bank of St. Louis, November 20, 2018.
June’s year-over-year decline was the first for housing starts since August, 2016, and June’s level sat as the lowest of the year until November’s plunge. In the last Housing Market Review I ascertained that the recent annual declines were relatively significant. I concluded that a fundamental change had arrived. I am no longer correct about a slow motion breakdown; the breakdown is now break neck in speed.
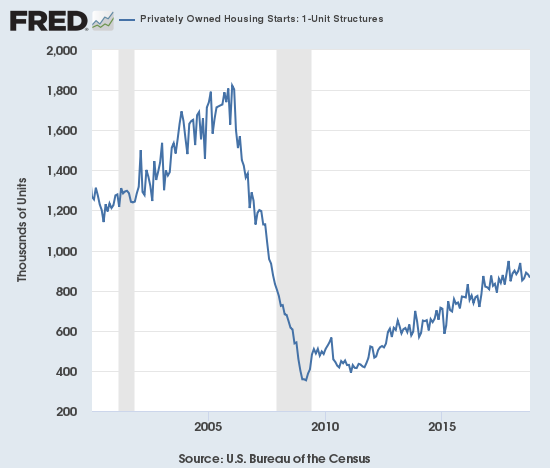
Source: US. Bureau of the Census, Privately Owned Housing Starts: 1-Unit Structures [HOUST1F], retrieved from FRED, Federal Reserve Bank of St. Louis, December 26, 2018.
Over the 8 months prior to May, regional year-over-year changes in starts exhibited wide dispersion. For May, housing starts were very strong across the board. The dispersion returned in July. In November, three of the four regions experienced sharp declines led by the West. The Northeast, Midwest, South, and West each changed 8.1%, -13.0%, -11.3%, and -22.7% respectively.
The bump up in July housing starts was less impressive than it appeared given it was mainly driven by the Midwest. For August, only a second month of gains for the West prevented housing starts from looking worse. In September, the regions delivered solid performances outside of the Northeast. The West out-performed for two months with double-digit year-over-year gains and helped prevent the overall starts numbers from looking worse. So no surprise that the West’s sharp decline in November coincides with a plunge in overall starts; the West may have been the classic light bulb shining brightest right before it blows out.
From the last Housing Market Review: “Assuming a housing slowdown is in full swing, the West could suffer significant drops in home builder sentiment in coming months as these strong starts turn into over-supply and/or lower prices.” It looks like builders are already getting the message and sharply pulling back on their plans.
Existing Home Sales – November, 2018
Existing home sales ended a 5-month losing streak with a small month-over-month increase for October sales. However, sales continued its losing streak for year-over-year changes with an eighth annual decline in a row. That streak reached nine in November. For August sales, the National Association of Realtors (NAR) chose to celebrate headlines about a stabilization of sales and the end of the decline, but I countered with my skepticism. For September sales, the NAR seemed to finally acknowledge a sinking reality. The NAR perked back up in reporting the October sales with mixed messaging that failed to highlight the fundamental realities of a slowing market. Similarly, for November sales, the NAR strained to find some positive messaging even as increasing inventory continues to fail to stem the (year-over-year) declines in sales.
The seasonally adjusted annualized sales in November of 5.32M were up 1.9% month-over-month from the unrevised 5.22M in sales for October. Year-over-year sales decreased 7.0%, the largest annual decline since 2011.

Source for chart: National Association of Realtors, Existing Home Sales© [EXHOSLUSM495S], retrieved from FRED, Federal Reserve Bank of St. Louis, December 29, 2018.
The NAR’s routine explanation for changes in existing sales has usually blamed sales declines on a shortage of inventory and celebrated sales increases in spite of inventory shortages. In the November report the NAR strained to paint a story of increasing demand. The NAR used the monthly gain in sales to celebrate: “After six consecutive months of decline, buyers are finally stepping back into the housing market…” Yet another substantial year-over-year decline means that the more meaningful trend remains downward. In the November report the NAR celebrated a year-over-year increase in inventory: “increasing housing inventory has brought more buyers to the market.” Again, I am skeptical: the rising inventory is more representative of declining demand and NOT the action of sellers offering inventory to meet rising demand.
Absolute inventory levels increased from 1.67M a year ago to 1.74M in November. For the second month in a row, inventory FELL month-over-month as sales increased. Inventory was 1.85M homes in October. On a basis of months of supply, inventory followed the trend in the absolute numbers: “Unsold inventory is at a 3.9-month supply at the current sales pace, down from 4.3 last month and up from 3.5 months a year ago.”
In November, the NAR claimed that “as more inventory enters the market and we head into the winter season, home price growth has begun to slow more meaningfully…This allows for much more manageable, less frenzied buying conditions.” This description was a good positive spin on slowing price growth, but the November data demonstrated that prices are stubbornly staying too high and have yet to sustain deceleration. The median price of an existing home increased BOTH month-over-month and year-over-year. The 1.0% monthly increase was the first monthly increase since June. The 4.2% year-over-year increase was the 81st straight annual increase and exceeded October’s 3.8% annual increase. Note I do fully expect price gains to trend downward going forward: prices are simply too high maintain healthy demand.
The share of sales going to first-time buyers continues to just bounce around with November’s increases once again defying the NAR’s claims that first-timers are hurt the most by affordability issues. For November, the share sat at 33%, an increase from 31% the previous month and the previous year’s November at 29%. This share was 32% in September, 31% in August, 32% in July, 31% in May and June, 33% in April, 30% in March, 29% in February and November was 33%. September, 2017 was the first time in the previous two years where the share dropped below 30% and has not dropped below since. In other words, the share has been relatively stable over the past year.
The average share for first-time homebuyers for 2016 was 35%. The NAR’s 2017 Profile of Home Buyers and Sellers reported an average of 34% for 2017 and 33% for 2018. These yearly drops by one percentage point are not remarkable. Investors purchased 13% of homes in November, a return to the 13% share over previous months, and down from October’s 15% and 14% a year ago November. Investor sales averaged a share of 15% in 2017 and 14% in 2016.
For the second month in a row, existing home sales decreased across all four regions year-over-year and told an even more stark story of continued decline. In particular, the West suffered a fifth consecutive substantial drop. Here are the regional numbers with October and September’s year-over-year changes in parentheses respectively listed for comparison: Northeast -2.6% (-6.8%, -5.6%), Midwest -4.3% (-3.1, -1.5%), South -5.6% (-2.3%, -0.5%), West -15.4% (-11.2%, -12.2%). As usual, regional sale fluctuations had no relationship to the on-going price run-ups. The year-over-year price changes for November were stubbornly high with only the West showing declining price appreciation (October, September in parentheses): Northeast 6.5% (3.0%, 4.1%), Midwest 2.6% (2.4%, 1.9%), South 3.2% (3.8%, 3.0%), West 1.8% (1.9%, 4.1%).
Single-family sales were up on a monthly basis by 1.9% and decreased on a yearly basis by 6.7%. The median price of $260,500 was up 5.0% year-over-year.
New Residential Sales (Single-Family) – November, 2018
(In the original post, these data were unavailable due to the shutdown of the Federal government. The Census Bureau was finally able to publish the data on January 25, 2019)…
New home sales were resurgent in March. April sales did not keep pace on a monthly basis but delivered a strong year-over-year performance. In a surprisingly stark contrast to existing home sales, new home sales from May to August increased in each month on a year-over-year basis. September finally unleashed a “pent-up” decline in new home sales that may actually be easing. November, 2017 still looks like a substantial and sustained peak in new home sales, but the latest data offer the prospect of stabilization.
The Census Bureau revised October sales of new single-family homes upward from 544,000 to 562,000. New home sales for November soared 16.9% month-over-month and declined 7.7% year-over-year to 657,000. So while sequential sales have sharply rebounded, a parallel surge in 2017 means that the year-over-year picture remains one of substantial decline. Year-over-year gains regularly hit double digits starting in 2012; last November’s 26.6% jump was the highest since February, 2015 when new home sales soared 29.8% year-over-year. This year has yet to deliver a double-digit year-over-year gain, so the current declines are consistent with a slowdown in new home sales.
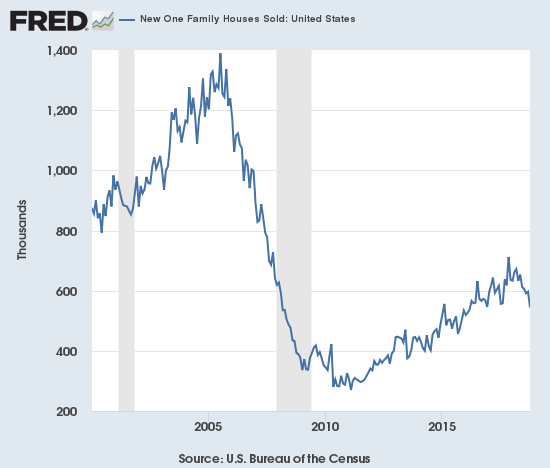
Source: US. Bureau of the Census, New One Family Houses Sold: United States [HSN1F], retrieved from FRED, Federal Reserve Bank of St. Louis, February 2, 2019.
In June, the inventory of new homes for sale jumped to 6.0 months of sales, a perfect balance. Inventory has continued to increase from there. September’s inventory surged to 7.2. October’s inventory increased further to 8.1. November inventory plunged back to 6.0 given the surge in sales. In September’s Housing Market Review I wondered whether new homes might move too far to an over-supply condition; sure enough that over-supply happened for two months. The balance at 6.0 may become a new pivot or floor. An over-supply of new homes detracts from the abiding optimism expressed by the NAR over higher supplies of existing homes. The swell in inventory is likely contributing to the decline in housing starts.
May’s median price of $316,700 was a year-over-year decline. June delivered a second straight decline. July’s prices bounced back: the median price increased 1.6%. August’s median price of $321,400 (revised) was also a year-over-year increase of 2.3%. With sales plunging in September, prices remained essentially flat with a -0.4% decline (revised). For October, the median increased by 1.8% (revised). The recent revisions have reversed what were earlier reported as declines. For November, the median sales price hit its lowest level of the year at $302,400, a 11.9% year-over-year plunge. Prices were last this low February, 2017. The price declines look like they are a function of a significant shift in the distribution of sales from the high-end to the middle and low-end of the overall market. The regional data further suggest that plunge in the median price was driven by a plunge in sales in the expensive West.
The Northeast ended its 4-month streak as a notable laggard. Sales in the region increased 15.0% year-over-year. All other regions experienced declines. The Midwest dropped 2.5%. The South dropped 0.8%. The West plunged an eye-popping 25.9%. A year ago the West surged 22.8% year-over-year. The chart below suggests that a general jump in sales between March, 2017 and March, 2018 may represent an aberration and/or sustained peak in sales activity.
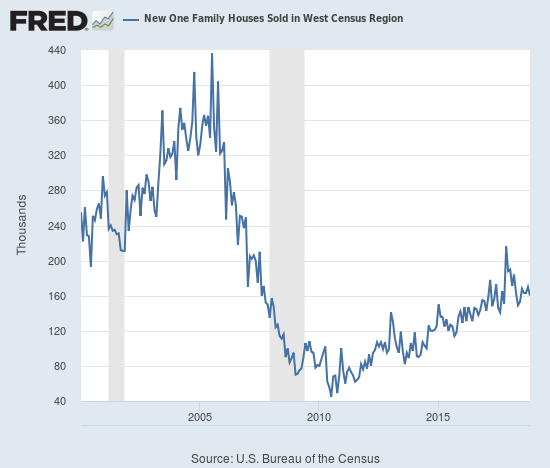
Source: US. Bureau of the Census, New One Family Houses Sold in West Census Region [HSN1FW], retrieved from FRED, Federal Reserve Bank of St. Louis, February 2, 2019.
Home Builder Confidence: The Housing Market Index – December, 2018
In the April housing market review, I explained why I would not have thought much of March’s slight decline in the Housing Market Index (HMI). At 70, the HMI was still higher than it was for most of 2017. For July, the HMI stayed at 68 for the second straight month. However, the HMI dropped another point in August and stayed at 67 for September. For two straight months, the NAHB cleverly called 67 a “solid reading.” I was circumspect about this reading given it was the low for 2018, and I stayed skeptical in the October Housing Market Review even with the HMI increasing by one point at that time. As a reminder, I took a NAHB quote as evidence that a housing slowdown was underway (emphasis mine):
“Favorable economic conditions and demographic tailwinds should continue to support demand, but housing affordability has become a challenge due to ongoing price and interest rate increases. Unless housing affordability stabilizes, the market risks losing additional momentum as we head into 2019.”
For the second month in a row, the NAHB highlighted affordability issues as a driver of the downward pressure on builder confidence although, of course, affordability has been a long-standing problem in the market. The accompanying housing slowdown shows up in the HMI which dropped from 68 in October to 60 in November to now 56 in December, the lowest reading since May, 2015. November’s reading was the lowest since June, 2016, so HMI is essentially in freefall. The last time the HMI hit lows of the year in November and December was in the depths of the financial crisis in 2008. The HMI dropped enough to drive the average HMI for the year to 67.1 which is just below 2017’s HMI of 67.8. Sentiment is so weak that the NAHB openly discussed poor economic conditions (emphasis mine):
“The fact that builder confidence dropped significantly in areas of the country with high home prices shows how the growing housing affordability crisis is hurting the market…This housing slowdown is an early indicator of economic softening, and it is important that builders manage supply-side costs to keep home prices competitive for buyers at different price points.”
In other words, prices are still too high.
The components of HMI earlier revealed the clearest warning on sentiment, and reminded me of the benefits of analyzing the components rather than the composite. The traffic of prospective buyers soared to a remarkable peak in December, 2017 and declined sharply from there. November’s drop to 45 and December’s drop to 43 likely confirm a lasting top. Similarly, the other two components of the HMI, single-family detached present and single-family detached six months, have steadily declined for 12 months. A lasting peak in those components also appears at hand.
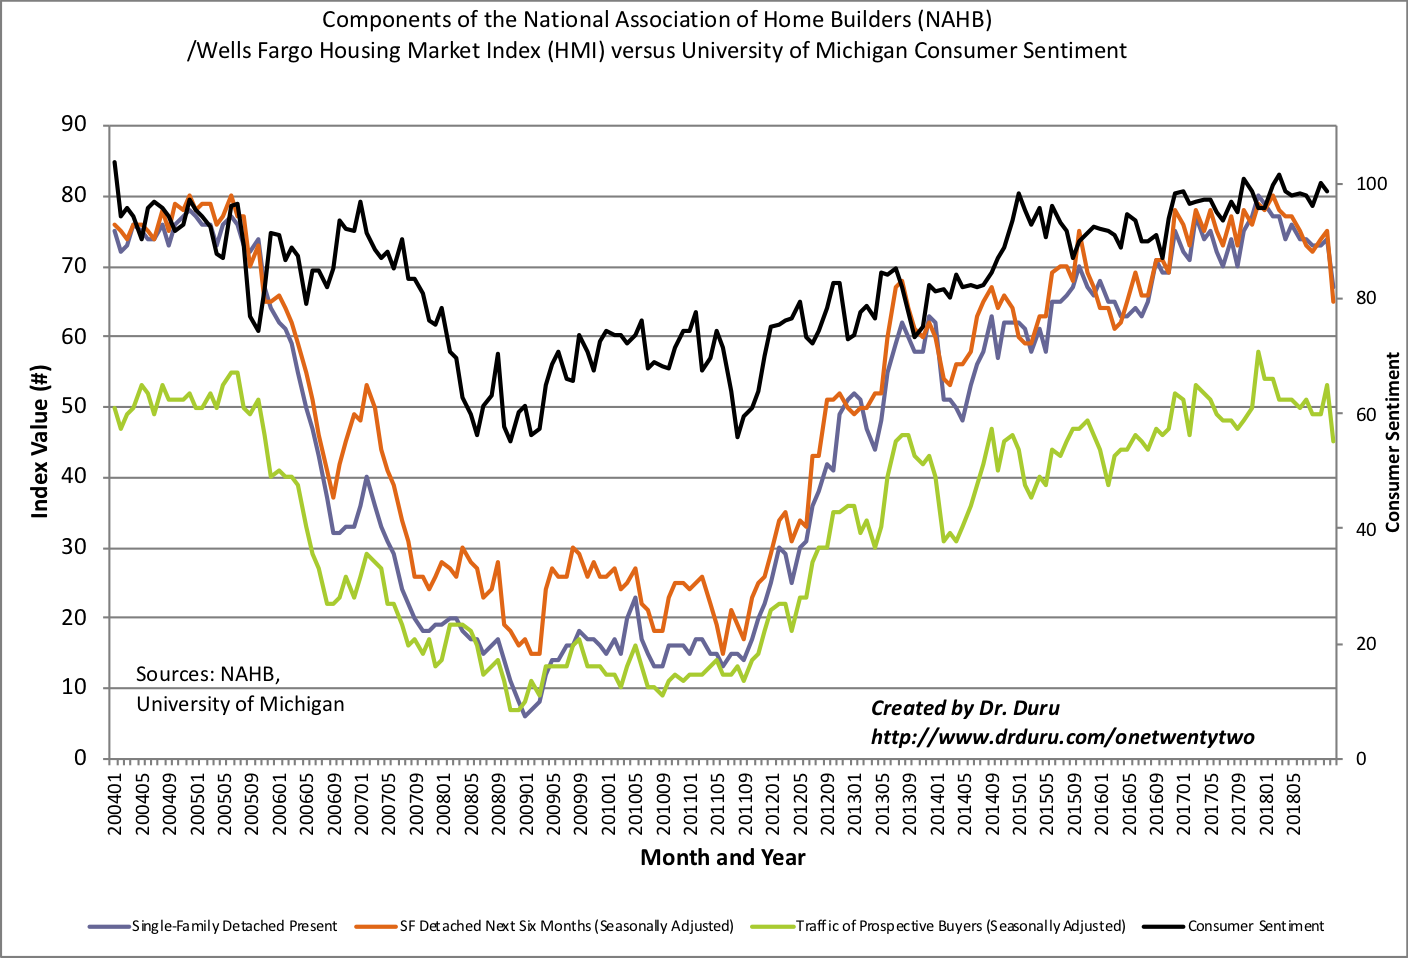
Source: NAHB
The NAHB repeated its commentary from November characterizing consumer demand, but this time placed hope on lower interest rates to get buyers to pull the trigger:
November: “Builders report that they continue to see signs of consumer demand for new homes but that customers are taking a pause due to concerns over rising interest rates and home prices…”
December: “We are hearing from builders that consumer demand exists, but that customers are hesitating to make a purchase because of rising home costs…However, recent declines in mortgage interest rates should help move the market forward in early 2019.”
Three of four regional HMIs declined; all four ended the year at multi-year lows. The Northeast went from avoiding a new low for the year in November to plunging to 37, its lowest level since May, 2016. The Northeast is now the one region with negative sentiment (below 50). At 52, the Midwest sits at a 3 1/2 year low. The South hit a 2 1/2 month low. The West managed to stay flat at its worst reading since September, 2015.
In the September Housing Market Review, I concluded that HMI had to begin a recovery in October for me to look forward more optimistically to the seasonally strong period for home builder stocks (November through March/April). Unfortunately, I concluded that “…home builder sentiment still looks like a breakdown in slow motion.” The brakes failed in November, and the breakdown is in full effect. In November’s Housing Market Review, I asked whether the iShares US Home Construction ETF (ITB) finally priced in the worst of the coming news for the housing market. This bottoming could be the case for the strongest builders, but the ITB overall remains vulnerable given it broke through October’s low. I have no current plans to further expand my existing bet on the seasonal strength in home builder stocks.
Parting thoughts
With housing adding to the forces steadily boxing in the Fed, I am surprised the Fed is not speaking more directly about it. Home builder stocks and decelerating housing data gave us the early signals this year that “something” was wrong. The Fed will be remiss in continuing to underplay these warning signals.
Marketplace produced an interesting segment titled “Divided Decade: How the financial crisis changed housing.” This piece focused on the transformation of a population from owners to renters and the parallel attempt of Americans to reduce their housing costs. Given these forces, I am amazed at the near relentless surge in housing prices for so many years. With housing affordability down to a 10-year low, prices are clearly too high. A Federal Reserve that decides to stop hiking interest rates will not be enough to restart the demand for homes.
Be careful out there!
Full disclosure: long ITB calls, long PHM, long LGIH