
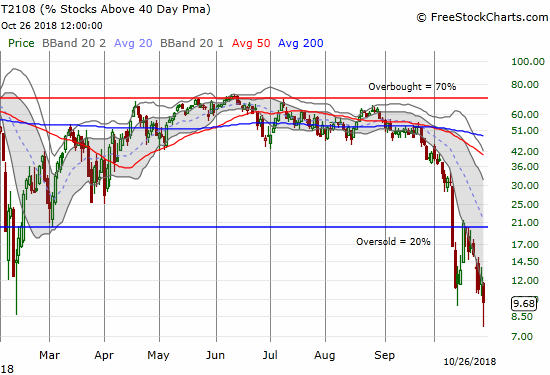
AT40 = 9.7% of stocks are trading above their respective 40-day moving averages (DMAs) – (as low as 7.6%) 8th day of oversold period following 4-day oversold period
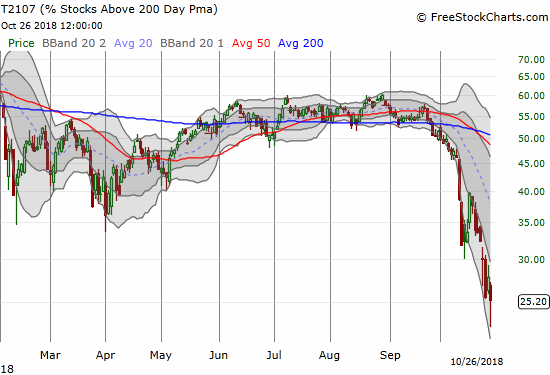
AT200 = 25.2% of stocks are trading above their respective 200DMAs (as low as 22.5%)
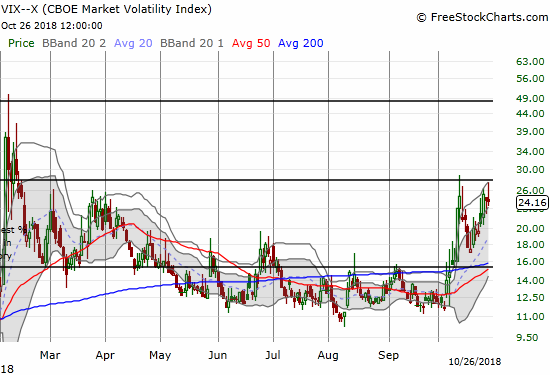
VIX = 24.2 (as high as 27.5)
Short-term Trading Call: bullish
Commentary
The stock market was all over the place on Friday. The S&P 500 (SPY) gapped down, made a low around 11am Eastern, rallied to an intraday high two hours later, sold off for two hours but did not make a new intraday low, and then churned higher into the close. It was true head-turning, yo-yo action.
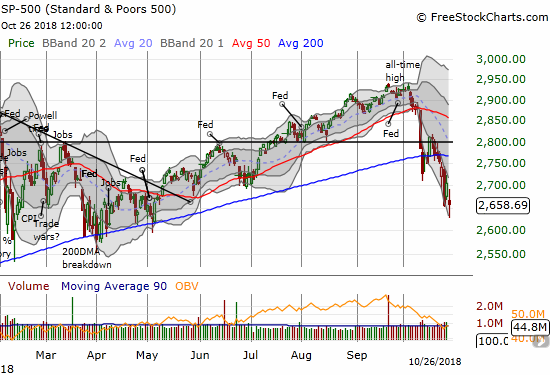
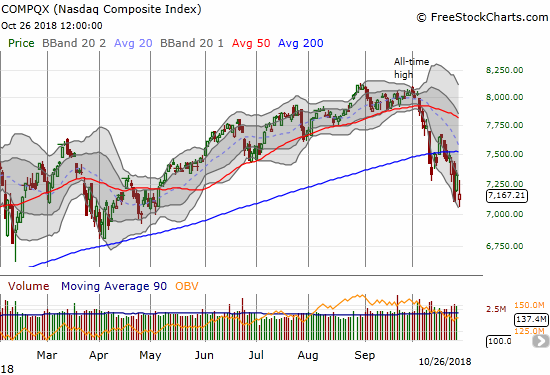
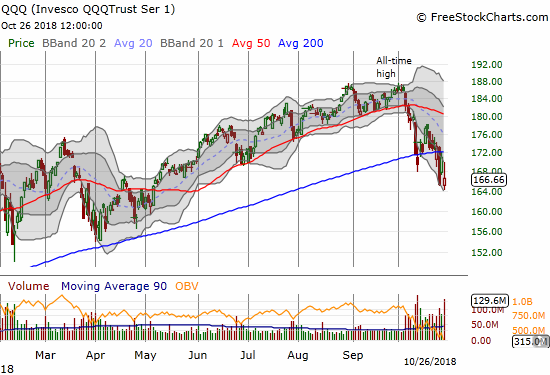
In the end, the stock market demonstrated more deterioration even as the volatility index, the VIX, stayed flat with Thursday’s close. The S&P 500 (SPY) gapped down enough to almost wipe out the entire rally from the previous day. The index just barely missed a new closing low for this selling cycle although it did print a new intraday low. The NASDAQ exhibited similar trading action, but it was able to close higher than its open. The intraday high almost got flush with the previous day’s close. The Invesco QQQ Trust (QQQ) acted the same as the NASDAQ as both were driven by the post-earnings action of index giants Alphabet (GOOG) and Amazon.com (AMZN).
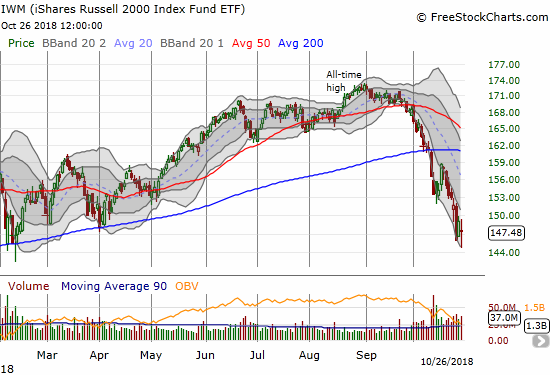
The iShares Russell 2000 ETF (IWM) gapped down just like the other major indices, but its intraday high DID close the entire gap before sellers took IWM to a 1.1% loss on the day.
AT40 (T2108), the percentage of stocks trading above their respective 40-day moving averages (DMAs), dropped as low as 7.6% before closing at 9.7%. The majority of stocks in the stock market are broken in the short-term. The damage is now so thorough I am afraid that the oversold period will only end after 40DMAs catch up with price…that is, 40DMAs will decline to meet the pricing action. AT200 (T2107), the percentage of stocks trading above their respective 200-day moving averages (DMAs), underlined the technical damage with a low of 22.5% before rebounding to 25.2%. The majority of stocks have cracked their long-term uptrends. Like the S&P 500 (SPY), some of these stocks are starting to suffer declining 200DMAs.
Overnight Thursday (October 23rd), the currency markets were flashing new dangers in the form of the Australian dollar (FXA) versus the Japanese yen (FXY). Overnight, AUD/JPY plunged and broke the important September low and hit a near 2-year low. It happened to bounce back sharply from that low and thus pulled back the alarms for Friday’s trading in the U.S. market. That rebound also guided my trading actions for Friday.
Once again, the market opened up an opportunity for me to execute the oversold trading strategy as the VIX spiked along with a plunge in the S&P 500 (SPY). I bought call options on SPY and prepared to hold over the weekend. However, the rebound from the intraday lows was fast enough to give me a quick double on those call options. Per the rule to take profits on a quick double in options, I sold. The yo-yo action gave me another opportunity to buy SPY calls which I took albeit in a smaller tranche (preparing for the potential to buy even lower).
I did not add to my ProShares Ultra VIX Short-Term Futures (UVXY) put options as the bid/ask never dropped low enough. I am looking for a fresh spike in the VIX to a new (intraday) high over the last oversold period as my next fade point. I know it seems odd to keep trying to fade the VIX when it still has an upward bias, but I have my rules in place for a reason. Buying put options is a sufficient hedge for further VIX increases because of the double benefit of a drop in the price of the underlying stock and the increase in implied volatility that drives the puts’ premium higher. For example, I quickly sold my Goldman Sachs (GS) put option at the open. My other bullish hedge going into Friday’s expiration was going short a call spread on Netflix (NFLX); that position expired harmless. My current partial hedge is a fist full of put options on Roku (ROKU) which confirmed a 50DMA breakdown, is working on closing its gap up from August, and is still almost 10% above its 200DMA.
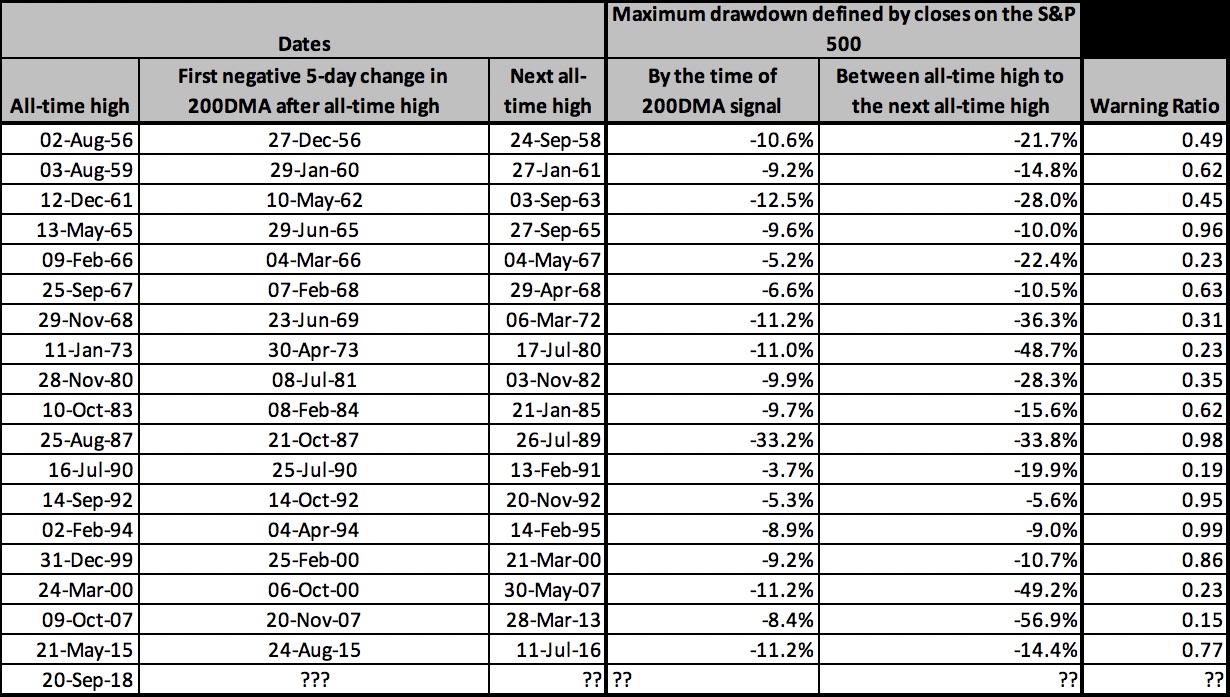
With the oversold period stretched into essentially 12 days, the second derivative of the stock market is picking up yet more momentum. My desire to hedge is so active that I am building a “fade on rally” list in parallel with my growing buying list for the oversold period. The 200DMA for the S&P 500 (SPY) has fallen for three straight days. This is an increasingly bearish sign that takes the market to two days away from triggering the “200DMA Signal.”
Source of data: Yahoo Finance. Source of analysis: downloadable Excel spreadsheet
First of all, this table shows how important, and RARE, it is for the 200DMA on the S&P 500 to decline for five or more days. This kind of decline has only happened ONCE since the big top ahead of the financial crisis, and it took the flash crash of August, 2015 to set things off. The S&P 500 went on to recover all its losses only to descend into a steeper sell-off in early 2016. From there, the index recovered enough to set a new all-time high in July, 2016 and was off to the races from there after one more bump during the 2016 Presidential election. Just as the 200DMA Model predicts, most of the pain of the 2015 to 2016 selling happened at the point of the first 5-day decline in the 200DMA. Until I see contradicting evidence, I am assuming the S&P 500 is about to follow a similar pattern.
For reference, the S&P 500 is down 9.2% from its all-time high. If the 200DMA Signal triggered at current levels, the index would trade about one percentage point below the average 10.4% drawdown by the time of the trigger.
CHART REVIEWS
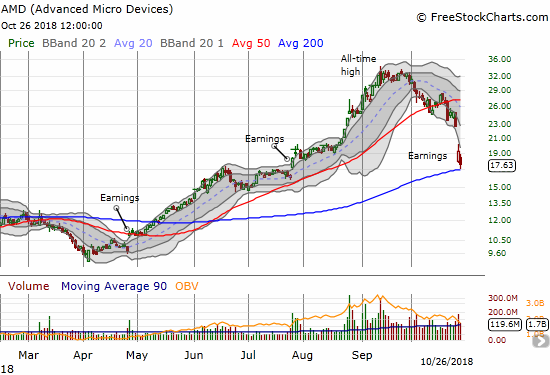
Advanced Micro Devices (AMD)
Sellers continued to take chunks out of AMD post-earnings. The stock lost another 8.5% after an intraday low that tested 200DMA support. The stock also finished reversing all the gains from the massive July, 2018 breakout. The whopping 46.1% collapse from the 52-week high forms what is a lower high on the longer-term chart; the first (all-time) high occurred in 2000 around $47 and the second (lower) high occurred in 2006 in the low 40s.
These kinds of dramatic collapses after parabolic moves makes me go back and examine the narrative the allowed people to justify the higher prices. I think an August 23rd segment where CNBC’s Jim Cramer explained why AMD is a better investment than Intel (INTC) could be one of the classics for studying the exuberance of parabolic moves: “CEO Dr. Lisa Su is a miracle worker.” Since then, AMD is down 21.9%; INTC is down 2.7%. AMD is still up 71.5% year-to-date. INTC is down 1.0% year-to-date with a 2.7% dividend yield. I like AMD for a buy if it can confirm the 200DMA support with a new post-earnings closing high.
Cramer: AMD is a better semiconductor pick than Intel from CNBC.
“We’re pretty happy with how the business is shaping up, especially around new products…the product story is doing quite well.”
AMD’s Lisa Su on quarterly earnings and her forecast for next year from CNBC.
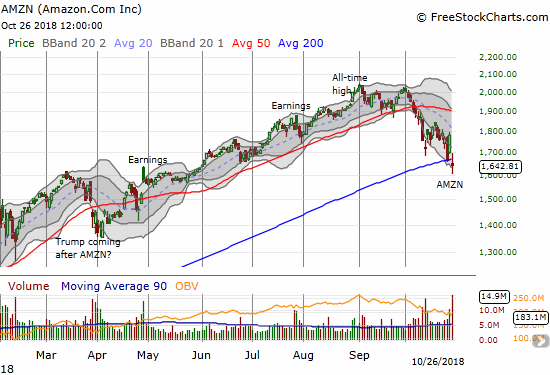
Amazon.com (AMZN)
AMZN had a rough post-earnings trading day, but there is room for hope for a short-term bounce. The stock gapped down but bottomed in about 5 minutes. It bounced later from that intraday bottom and rallied into its gap down. Still, the stock lost a whopping 7.8% and closed below its 200DMA for the first time in 2 1/2 years. I recalled my AMZN post-earnings trading model which triggers a buy at the open and a hold for as long as two weeks. Accordingly, I bought a calendar call spread with the short side expiring this coming Friday and the long side closing the following Friday.
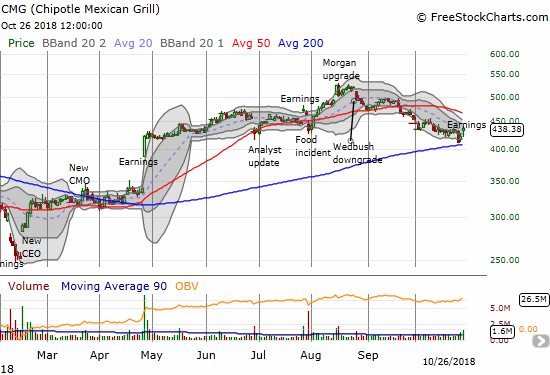
Chipotle Mexican Grill (CMG)
CMG surprised me. I was bracing for a large post-earnings 200DMA breakdown given what I assumed is an environment of higher input costs and labor shortages. Instead, the stock likely confirmed 200DMA support with its 3.4% post-earnings gain. The stock could be good for at least a rally to 50DMA resistance.
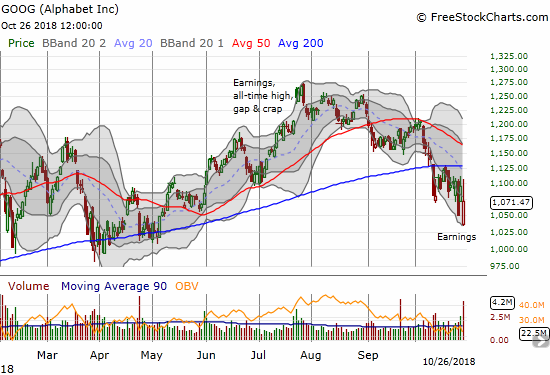
Alphabet (GOOG)
GOOG had an astounding post-earnings trading day. The stock gapped down 5.6% at the open and then buyers stepped in with force. A 5-minute surge was faded back to the intraday low before buyers managed to take GOOG as high as a 0.8% GAIN. Still, the stock is still working on a confirmed 200DMA breakdown.
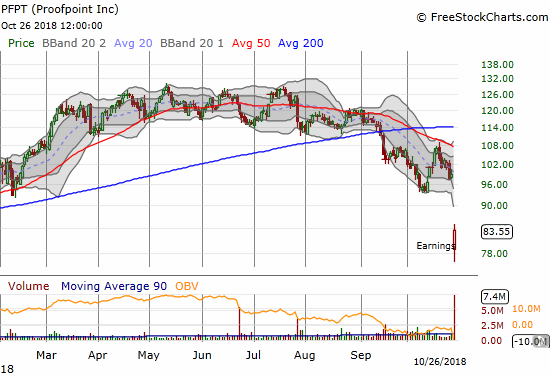
Proofpoint, Inc. (PFPT)
I want to take advantage of this sell-off to rebuild positions in cyber security stocks. The post-earnings selling in PFPT may have initiated the attractive discounts that I want. I duly noted how buyers immediately took PFPT off its intraday low and closed the stock near its high of the day.
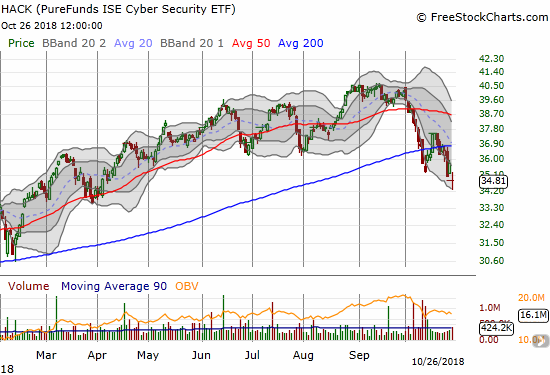
ETFMG Prime Cyber Security ETF (HACK)
My first return to cyber security stocks will likely be through HACK. PFPT was a handy reminder of the substantial single stock risks still involved with trying to pick through this space. HACK still has a 10.0% year-to-date gain.
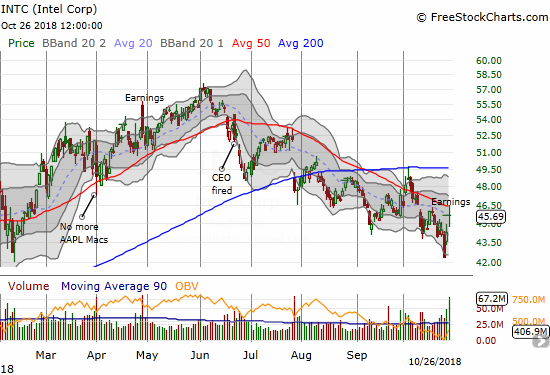
Intel (INTC)
I thought I would be able to start my next between earnings trade in INTC at lower prices. Much to my surprise, INTC rallied post-earnings. This pop runs counter to the abiding narrative of a slowdown in the semiconductor industry, so I am not in a rush to chase INTC higher. My last between earnings play fizzled thanks to the October sell-off.
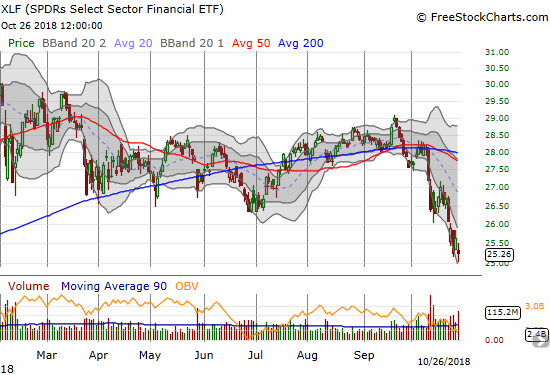
Financial Select Sector SPDR ETF (XLF)
The stubborn weakness in financials must concern investors now that the general stock market is also weakening. Last week, XLF closed at a fresh 13-month low.
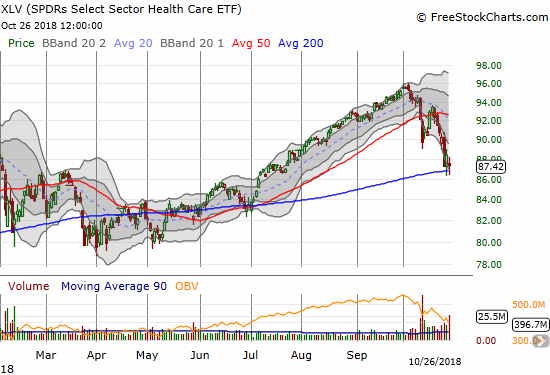
Health Care Select Sector SPDR ETF (XLV)
XLV is one of the few indices/ETFs valiantly maintaining 200DMA support. I might try a trade above Friday’s intraday high under the assumption that such a move confirms 200DMA support.
— – —
FOLLOW Dr. Duru’s commentary on financial markets via email, StockTwits, Twitter, and even Instagram!
“Above the 40” uses the percentage of stocks trading above their respective 40-day moving averages (DMAs) to assess the technical health of the stock market and to identify extremes in market sentiment that are likely to reverse. Abbreviated as AT40, Above the 40 is an alternative label for “T2108” which was created by Worden. Learn more about T2108 on my T2108 Resource Page. AT200, or T2107, measures the percentage of stocks trading above their respective 200DMAs.
Active AT40 (T2108) periods: Day #8 under 20% (oversold), Day #13 under 30%, Day #20 under 40%, Day #25 under 50%, Day #41 under 60%, Day #94 under 70%
Daily AT40 (T2108)
")
Black line: AT40 (T2108) (% measured on the right)
Red line: Overbought threshold (70%); Blue line: Oversold threshold (20%)
Weekly AT40 (T2108)

*All charts created using freestockcharts.com unless otherwise stated
The charts above are my LATEST updates independent of the date of this given AT40 post. For my latest AT40 post click here.
Related links:
The AT40 (T2108) Resource Page
You can follow real-time T2108 commentary on twitter using the #T2108 or #AT40 hashtags. T2108-related trades and other trades are occasionally posted on twitter using the #120trade hashtag.
Be careful out there!
Full disclosure: long UVXY puts, long SPY calls, long AMZN calendar call spread,
*Charting notes: FreeStockCharts.com stock prices are not adjusted for dividends. TradingView.com charts for currencies use Tokyo time as the start of the forex trading day. FreeStockCharts.com currency charts are based on Eastern U.S. time to define the trading day.