
{editing note 10/28/18 – this is a restored version of this post after I accidentally over-wrote it in preparing for the next edition of Above the 40}
AT40 = 12.3% of stocks are trading above their respective 40-day moving averages (DMAs) – 7th day of oversold period following 4-day oversold period (as low as 10.3%)
AT200 = 27.8% of stocks are trading above their respective 200DMAs
VIX = 24.2 (as low as 22.1)
Short-term Trading Call: bullish
Commentary
The stock market soared, but AT40 (T2108) and AT200 (T2107), respectively the percentage of stocks trading above their 40 and 200-day moving averages (DMAs), only gained a few percentage points and failed to reverse the previous day’s loss. This combination is a sign of just how much technical damage has been done to the market.
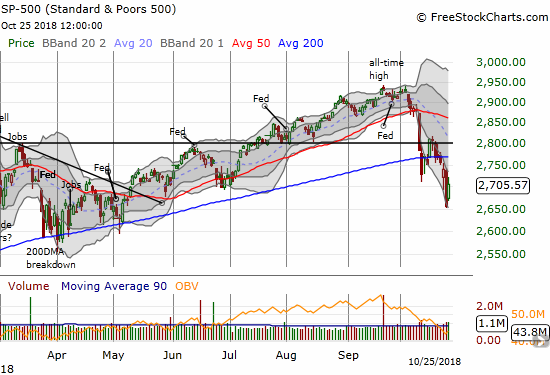
Also note that the S&P 500’s 200DMA turned downward for the second straight day. As a reminder, this critical long-term trendline last declined on a daily basis in May, 2016.
The volatility index, the VIX, dropped just 4.0% after a rebound off its low. The fear gauge still looks poised to go higher before the next volatility implosion.

The currency markets are flashing new dangers in the form of the Australia dollar (FXA) versus the Japanese yen (FXY). Overnight, AUD/JPY plunged and broke the important September low and hit a near 2-year low. At the time of writing, AUD/JPY bounced just enough to recover that low. As a reminder, AUD/JPY can provide an important tell on the market’s current risk tolerance. Right now, it looks like that tolerance just got a lot lower.
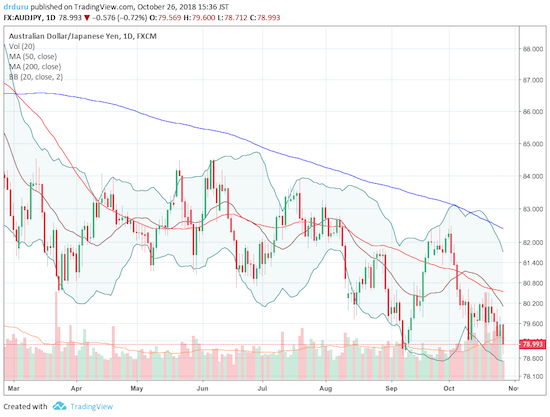
Source: Trading View
Focusing on the bullish opportunities is still paying off with call options on SPY. I expected to hold the two tranches I bought into Wednesday’s sell-off until next week, but the S&P 500 soared enough to move me to take profits (in other words, I did not want to risk losing the profits to another swoosh lower that fades the day’s strong rally). I will continue to exercise oversold trading rules in buying SPY call options (essentially buying when the S&P 500 plunges along with a surge/spike in volatility).
With the oversold period stretched into essentially 11 days, the second derivative of the stock market is in full swing. As I prepare for a more extended oversold period of churn and 200DMA resistance levels holding firm, I am back to hedging in small bits. Per the strategy I laid out on Netflix (NFLX), I faded its rally today. I sold a call spread expiring Friday. With Alphabet (GOOG) and Amazon.com (AMZN) earnings pulling down big cap tech in after hours, it looks like my trade will work out. I also wanted to buy a calendar put spread on NFLX, but my order never filled. As another hedge, I bought a single put option on Goldman Sachs (GS) expiring Friday. To avoid swinging myself to the bearish side, I added call options on Splunk (SPLK) expiring next week.
CHART REVIEWS
Apple (AAPL)
AAPL is still the north star for tech stocks. The calamity in the rest of the market has yet to hit AAPL much. With earnings next week, I was bracing for a major test for the stock and the rest of the stock market. The poor response to GOOG and AMZN earnings may deliver the test ahead of schedule.

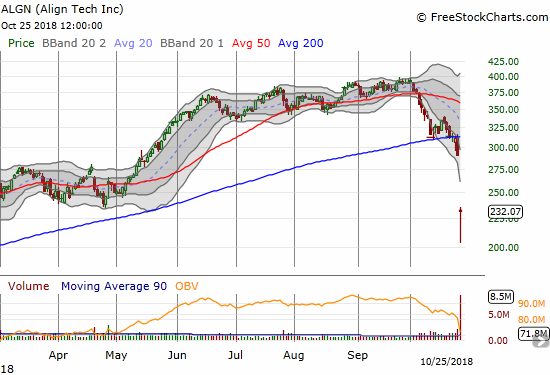
Align Technology (ALGN)
ALGN collapsed in the wake of its earnings on extremely high trading volume (a 16-month high). The loss of 20.2% took ALGN to an 8-month low. In less than a month, ALGN lost its entire gain for 2018. This kind of punishment for high-flying, high valuation stocks is more technical damage to add to the growing carnage.
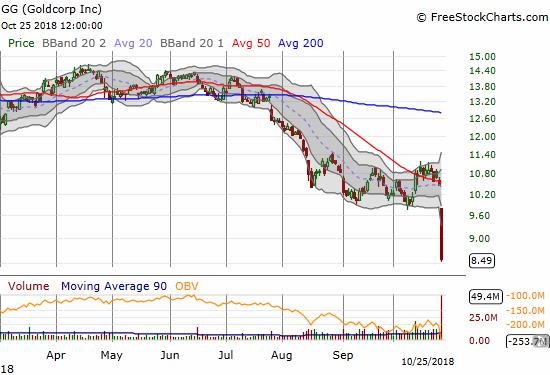
Goldcorp (GG)
GG took me aback with a 18.7% post-earnings loss that took the stock all the way back to early 2002 levels. My whole experience on miners has taught me to just stick with the yellow metal itself. The miners just add unnecessary operational risk. I am dumping my position soon. When (if?) the stock closes this post-earnings gap down, I will reconsider my positioning.
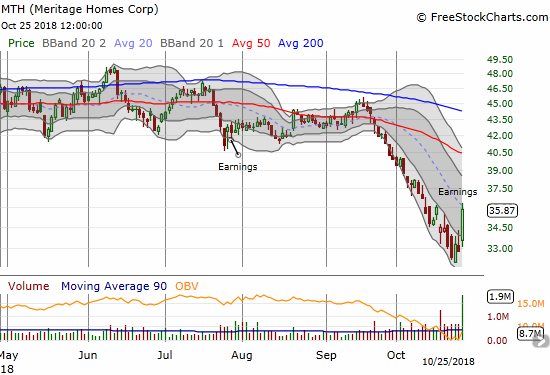
Meritage Homes (MTH)
MTH reported earnings on the right day. The stock received some serious tailwinds to the tune of a 9.5% gain. The next test for the stock is resistance from its steeply downtrending 20DMA. If sentiment is truly turning around, buyers will soon slice right through this resistance. Otherwise, it will be back to the same ol’ fade.
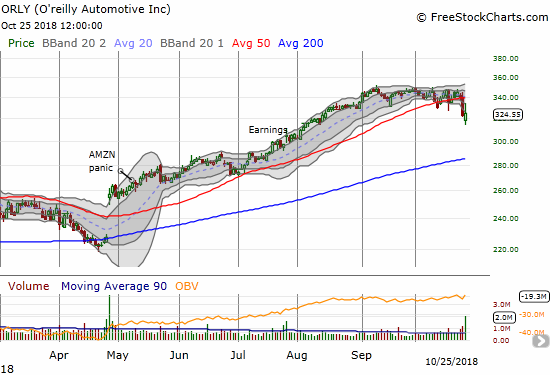
Oreilly Automotive (ORLY)
ORLY printed an intriguing pattern going into earnings. It slowly sagged as its 20 and 50DMAs converged. The stock dropped 5.1% ahead of earnings and gapped down following earnings. This trading action looks too much like topping action, so this is a dip I will NOT buy this time around.
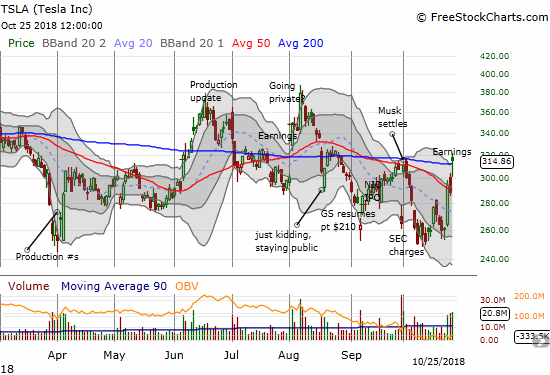
Tesla (TSLA)
Another week, another whacky set of events for TSLA. While the stock market sank this week, TSLA soared. A dramatic pop of 14.2% occurred on the heels of TSLA announcing it would deliver earnings a week earlier than originally planned. Even Citron caught on to the bullish implications.
$TSLA dropping earnings on top of $F tomorrow might be a bad sign for shorts. After reviewing all recent info on $TSLA dominating its categories, Citron is LONG Telsa for this quarter. Full report https://t.co/eZLSbtL0kg
— Citron Research (@CitronResearch) October 23, 2018
Sure enough, TSLA delivered earnings results that pleased the market. The stock finished with a 9.1% gain and a 200DMA breakout. However, sellers did manage to push the stock back to the previous day’s intraday high at one point. The drama caught me flat-footed as I was positioning for a bullish pre-earnings play the NEXT week. While things worked out OK, I could have easily been caught with a pre-earnings warning. This drama just reminded me of the whacky (upside and downside) risks inherent in trading this stock. Going forward, the stock still has major overhead resistance in the mid-300s. I am also still not interested in holding the stock for an extended period until I see what happens after TSLA’s next funding round.
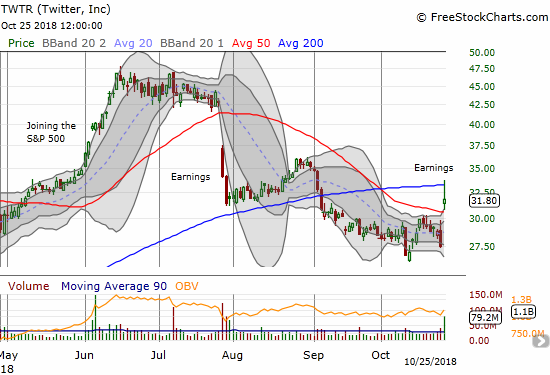
Twitter (TWTR)
After seeing TWTR pop 15.5% post-earnings, I heaved a major sigh of relief. The bullish case remains intact for TWTR, and I will certainly use weakness from general stock market malaise to add to my position.
— – —
FOLLOW Dr. Duru’s commentary on financial markets via email, StockTwits, Twitter, and even Instagram!
“Above the 40” uses the percentage of stocks trading above their respective 40-day moving averages (DMAs) to assess the technical health of the stock market and to identify extremes in market sentiment that are likely to reverse. Abbreviated as AT40, Above the 40 is an alternative label for “T2108” which was created by Worden. Learn more about T2108 on my T2108 Resource Page. AT200, or T2107, measures the percentage of stocks trading above their respective 200DMAs.
Active AT40 (T2108) periods: Day #7 under 20% (oversold), Day #12 under 30%, Day #19 under 40%, Day #24 under 50%, Day #40 under 60%, Day #93 under 70%
Daily AT40 (T2108)
")
Black line: AT40 (T2108) (% measured on the right)
Red line: Overbought threshold (70%); Blue line: Oversold threshold (20%)
Weekly AT40 (T2108)

*All charts created using freestockcharts.com unless otherwise stated
The charts above are my LATEST updates independent of the date of this given AT40 post. For my latest AT40 post click here.
Related links:
The AT40 (T2108) Resource Page
You can follow real-time T2108 commentary on twitter using the #T2108 or #AT40 hashtags. T2108-related trades and other trades are occasionally posted on twitter using the #120trade hashtag.
Be careful out there!
Full disclosure: long UVXY puts, long GG shares, long GS put, short NFLX call spread; long TSLA shares, short a call, long put spread, long call spread; long TWTR
*Charting notes: FreeStockCharts.com stock prices are not adjusted for dividends. TradingView.com charts for currencies use Tokyo time as the start of the forex trading day. FreeStockCharts.com currency charts are based on Eastern U.S. time to define the trading day.
TSLA, Duru? You’re still thinking about playing with that bomb? And in this environment? Can’t you find something safer, like a roulette wheel in Las Vegas? 🙂
In any case, some interesting data from Ryan Detrick:
“SPX closed higher in April, May, June, and July. In the 11 times this has happened since 1935, the index closed higher 5 months later (i.e., at year -end) EVERY time by a median of 12%”
Of course, this time could be the exception….
People are getting very negative about the market. This should help put in a bottom, whenever that bottom happens to appear. Usually that takes longer than everyone thinks it should, in order to make even more people negative.
I don’t think the bull market is over, for a variety of reasons, but it certainly is damaged, and because of interest rates, probably has limited upside. So the strategy is to buy good stuff during the correction (and I wouldn’t, er, include Tesla in that category), and sell it on rallies, exactly as you’ve noted.
LOL. Yeah. That TSLA setup was a bit of the corner of my mind that gets crazy ideas. Thank goodness it worked out.
Detrick’s data is what I like to call “fun with numbers.” Since we cannot explain why that correlation exists, we have to assume that it is very possible that THIS year the correlation fails to hold. But it’s a nice footnote to keep in the back of my head.
The VIX tells us the market has yet to truly panic. Given the on-going duration of this oversold period, I am afraid it will take true panic to form that bottom.
When you say the bull market is not over are you saying that in due time we will catch new all-time highs? I don’t see THAT happening for quite some time. Maybe we can get there by Spring, 2019. Or do you mean the bull market is not over in the sense that this correction will not hit the 20% threshold that is traditionally used to define a bear market?
Ralph Acampora seems to share your opinion concerning the VIX. He thinks that a market bottom won’t be reached until the VIX is at least over 40, if not higher.
But the market does its best to fool everyone, so he could be wrong, as could all of us.
Personally, I think the economy is still doing fairly well (at least that’s what current statistics say), which is good for the market, and earnings for most companies. But monetary policy has shifted to a much less accommodating mode, and it’s hard to believe we can get new highs with rates going up. So my take is that this is a correction which probably won’t lead to a bear market (not yet, anyway), but will probably put it in a trading range.
So while caution (i.e., position sizing) is indicated here, the higher the VIX goes, the more interesting it gets. I was a big buyer in 2008/2009, and for some things I was early. But eventually it worked out. So I’m a nibbler here, in the event we have further down to go. Should the VIX get to the level you and Ralph think it’s going to , I’ll take bigger nibbles. But once there’s a rally, I’m probably going to significantly lighten up. And there will be a rally….the question is …..from where?
The million dollar question – a rally from where?!
The market does do its best to fool us. That’s why sticking to a rule is helpful and to make trades/investments without assuming that we know the bottom is indeed here.
I think the market is going through another rate hike adjustment. Assuming the market in general does not conclude that these higher rates are not placing an undue drag on the economy, the rally will come after the adjustment is done. But it still looks to me as a new all-time high is not on the table in the short-term.