
AT40 = 49.3% of stocks are trading above their respective 40-day moving averages (DMAs)
AT200 = 53.7% of stocks are trading above their respective 200DMAs
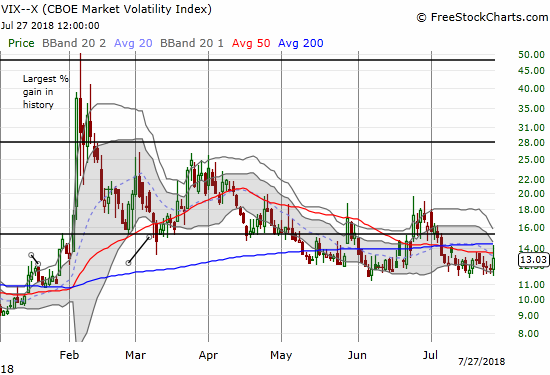
VIX = 13.0
Short-term Trading Call: neutral
Commentary
The S&P 500 (SPY) managed to gain on the week, but it was not easy.
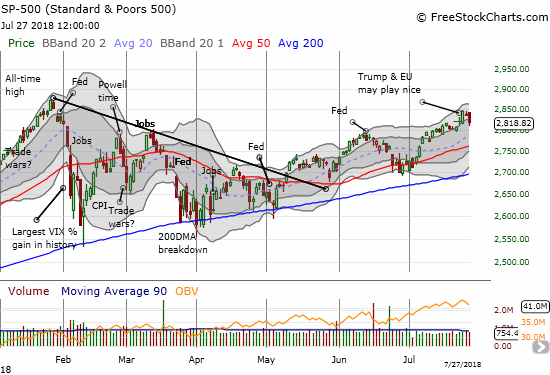
Each day of the week delivered new and meaningful technical signals.
The index started the week modestly with buyers just barely saving it from heading toward uptrending support at the 20-day moving average (DMA). At the same time, AT40 (T2108), the percentage of stocks trading above their respective 40DMAs, lost another few percentage points. The combination looked like more confirmation of the bearish divergence I described the previous week. The next day the index gapped up in a breakout move but failed to make progress from the day’s open. Again, AT40 lost two points – the bearish divergence deepened.
When the S&P 500 soared on the third day of the week on news that President Trump decided to make nice with the European Union (EU) in working toward completely free trade, the index’s move confirmed the breakout. Even though the bulk of the day’s gains were made near the close in the wake of Trump’s announcement, the S&P 500 still looked positioned for the long-awaited challenge of its all-time high. Yet, AT40 STILL refused to cooperate and quickly nailed down my skepticism; my favorite technical indicator did not even gain a point. My disbelief in the market’s rally was complete at that point.
AT40 finally woke up on Thursday by rallying back to where it closed the previous week. Ironically, buyers on the S&P 500 failed to follow-through on Wednesday’s move. While AT40 diverged to the upside away from the S&P 500, I do not consider such a move a bullish divergence because it is not contradicting weakness. A bullish divergence is meaningful, for example, when the S&P 500 is in the middle of a sell-off and trying to bottom. Friday’s steep reversal provided confirmation of the market’s underlying weakness as the index lost 0.7% and finished the reversal of Wednesday’s gain.
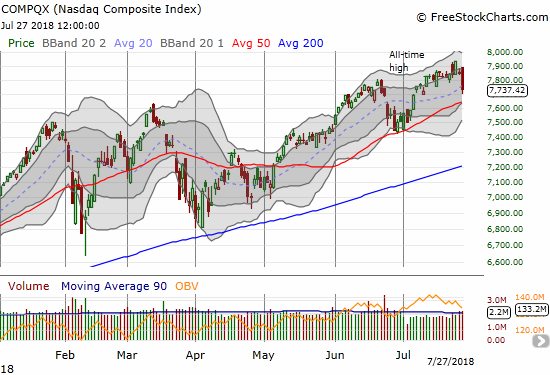
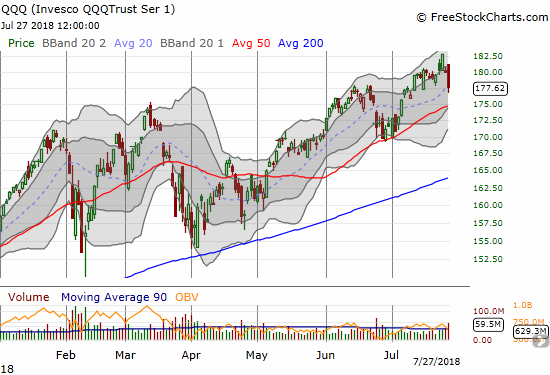
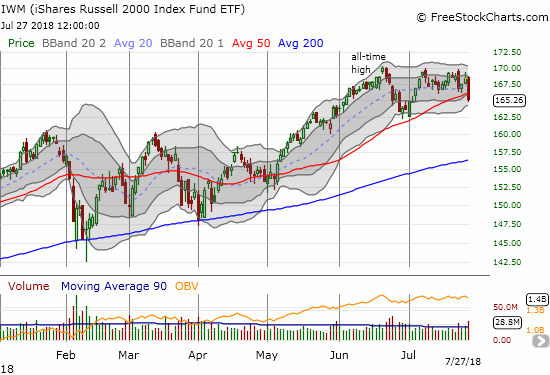
In a reversal of fortunes that likely presages more weakness ahead, the NASDAQ, Invesco QQQ Trust (QQQ), and the iShares Russell 2000 ETF (IWM) sold off steeply enough on Friday to record a losses for the week. This relative underperformance versus the S&P 500 was telling as it showed how aggressive selling in the market’s leaders can quickly damage the overall tone of the market. The NASDAQ and QQQ made 2-week closing lows while IWM logged a 3-week closing low. IWM closed below 50DMA support for the first time since early May and now looks ready to reverse all its gains for July.
The volatility index, the VIX, remained relatively calm. The VIX drifted lower ever so slowly until Friday’s selling popped it as high as 14.3. The fear gauge settled all the way back to 13.0 at the close of trading, almost in-line with the previous week’s close.
My short-term trading call remains at neutral even though last week’s trading action confirmed my skepticism in the market’s rally. With AT40 already at a 3-week low, a switch to bearishness might last just a few days as the NASDAQ and QQQ test 50DMA support. If THAT test fails, then I might find it worthwhile to go aggressively bearish for a few days as the S&P 500 (presumably) dives for its own test of 50DMA support. Such a move could actually push AT40 toward oversold levels for the first time in over 110 trading days. August is stacking up to be a very interesting month.
For now, I am sticking with a small fistful of put options on SPY, two fists full of call options on ProShares Ultra VIX Short-Term Futures (UVXY), and other selective short positions.
Earnings news last week made the biggest headlines, especially among big-cap tech stocks. From historical implosions to poor follow-through, key stocks revealed weakness uncharacteristic of the casual creep higher in prices that accompanied much of the trading action prior to last week. The charts below include brief explorations into the implications of some of these important moves. As always, there are bullish setups even when a lot else is crumbling around the setups.
CHART REVIEWS
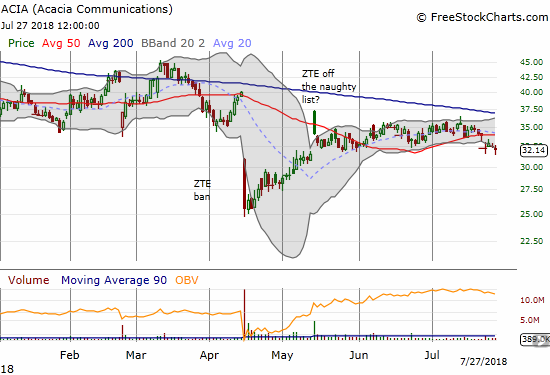
Acacia Communications (ACIA)
I keep eyeing ACIA for the next round of weakness. Last week’s 50DMA breakdown may be the signal. My last round of puts went out with a whimper as I got caught in sideways churn. Earnings are coming after market on August 2nd, so I will have to wait on my next position.
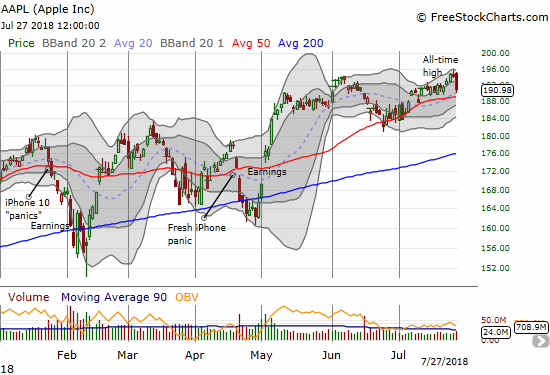
Apple (AAPL)
AAPL earnings after-market on Tuesday are coming at a critical moment that I am sure is well-recognized. Big cap tech has under-performed relative to the usual enthusiasm for these market leaders. With overall market performance so heavily skewed to these giants, a good performance from AAPL could turn the tide back in favor of the bulls. For now, AAPL looks weighed down by a quick escape from these magnets of money. AAPL closed the week right back in the middle of the last region of sideways churn. With earnings coming up, I did not pull the trigger on the weekly call option play.
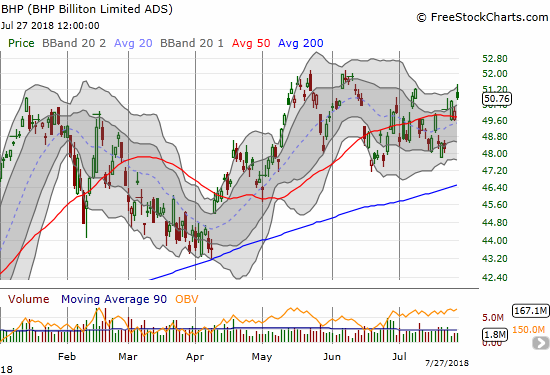
BHP Billiton (BHP)
BHP returned quickly to bullishness. Per my strategy, I faded the large gap up over 50DMA resistance by buying put options. I tried to double down on Friday but my limit order was left unfilled as the stock faded from its last peak.
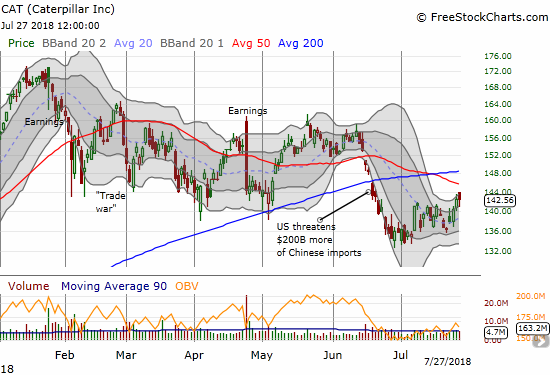
Caterpillar (CAT)
CAT is still under important 50DMA resistance. Still, last week it showed consistent strength. The bias higher blew up the long side of my calendar call spread. With earnings before the market opens on Monday, I have to assume a good amount of the push higher came from shorts covering positions in an abundance of caution.
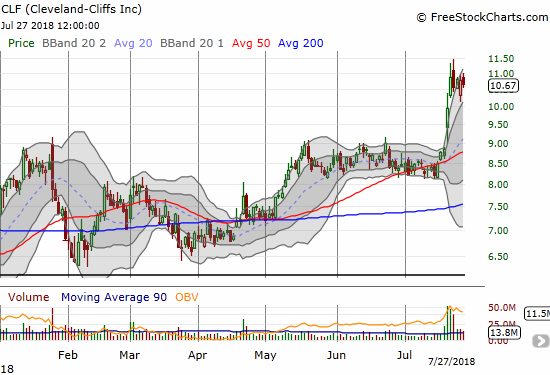
Cleveland-Cliffs (CLF)
CLF captured my attention two Fridays ago with a very bullish post-earnings breakout. Buyers followed through the next trading day. The stock is now stalled. I am hoping to get some time to review the earnings report before the next big move! Until I get reacquainted with the fundamental drivers, I do not feel prepared to fade or hop on the bandwagon.
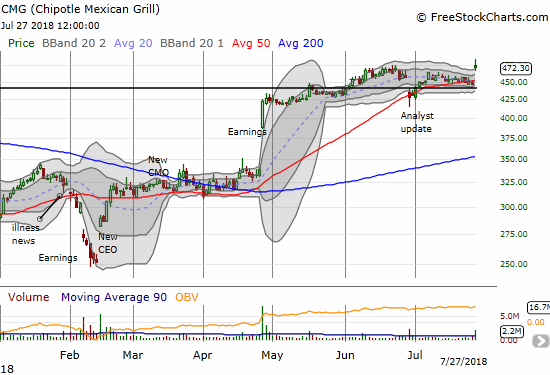
Chipotle Mexican Grill (CMG)
I gave up on the CMG bullish trade after the company’s analyst update was so poorly received. My disappointment proved premature. CMG quickly reversed that gap down, and on Friday a post-earnings gap up took the stock to new heights. I will look for new entries on pullbacks to/toward the lower part of the upper-BB trading channel.
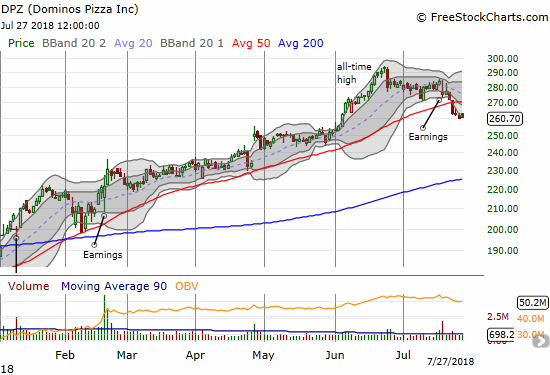
Dominos Pizza (DPZ)
DPZ is looking toppy again as post-earnings weakness continues. Last week the stock cracked 50DMA support on a big move downward. I will be trying to fade the stock on the next bounce.
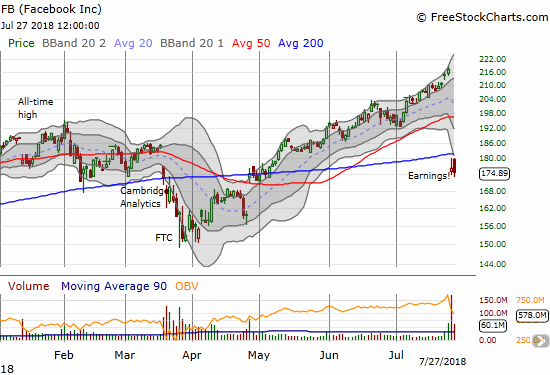
Facebook (FB)
FB was perhaps the biggest story of the week. The stock closed with a 19% post-earnings loss on what headlines heralded as the largest one-day drop in dollar value in U.S. stock market history. Such history seems significant except that perhaps all the buying setting up the collapse is the true headline. The stock was given a major pass after selling off in the wake of the Cambridge Analytics scandal. The screaming negative headlines receded into the background of a near relentless rally that almost went parabolic ahead of earnings. Trading volume ahead of earnings even surged above the 90-day rolling average as FB made another all-time high. Buyers were promptly rewarded with a fresh collapse that should mark a lasting top. I also expect more weakness ahead given the 200DMA breakdown. The 169.8M shares traded was the 10th largest in FB history and easily surpassed the heavy daily trading volume from March’s sell-off.
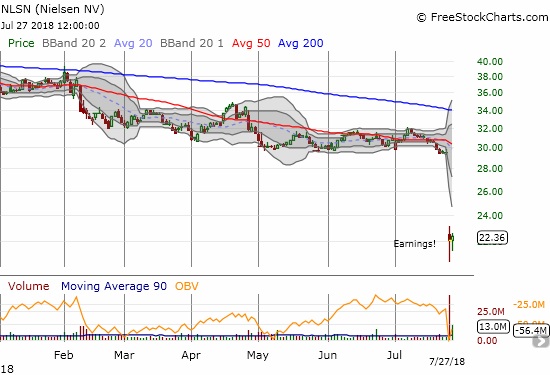
Nielsen (NLSN)
While Facebbok (and then Twitter) captured the negative headlines on the business of monetizing digital data on users, NLSN “quietly” collapsed to a new all-time low. The ratings and measurement company essentially confirmed how much more difficult this business has become. From the Seeking Alpha transcript of the earnings call:
“…we are seeing some short-term pressure from GDPR and privacy changes that are impacting our second quarter results and our 2018 outlook…Our results are significantly below our expectations as revenues were impacted by GDPR and changes to the consumer data privacy landscape. We have several hundred clients and data partners in this space and market changes have been disruptive.”
The following details are very telling:
“There are a few dynamics that caused us to have a more conservative outlook for 2018. First, the digital advertising ecosystem saw a disruption in the second quarter as large digital platforms made changes to their offerings to increase security for consumer data. Second, we expect operational and policy changes on third-party targeting to contribute to a slowdown in the back half of the year. Third, GDPR and changes in the consumer data privacy landscape is a near-term challenge that has clients and data suppliers working towards compliance as it relates to targeting and data usage rights. Now, this is a short-term disruption, but it may take some time before the market stabilizes. As such, we’re moderating our second half outlook in Marketing Effectiveness accordingly.”
Clearly the market did NOT believe these disruptions are merely short-term blips. Of course, if NLSN’s stubborn optimism is warranted, then this sell-off is one major buying opportunity!
“Regarding our 2020 plan, we remain focused on all of the same initiatives to drive growth and margin expansion over time for both Watch and Buy. Given our 2018 forecast, the growth and margin trajectory will obviously change, but we’re committed to the same goals to return to mid-single digit top-line growth and annual margin expansion over time.
So to wrap up, look, this is a difficult and disappointing result, but we remain committing to turning around our performance. We’ve worked appropriately to de-risk the back-half forecast and we’re focused on delivering our revised guidance.”
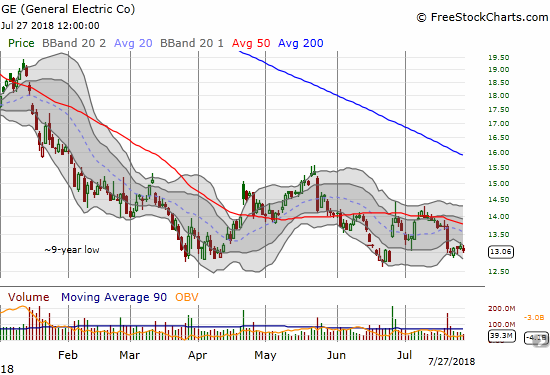
General Electric (GE)
Fresh optimism was building in GE. Unfortunately, the company disappointed yet again. The post-earnings selling triggered my next buy of GE call long-term call options. I described the trade in “A Low Risk Way to Play Cramer’s Call for A Bottom In General Electric.”
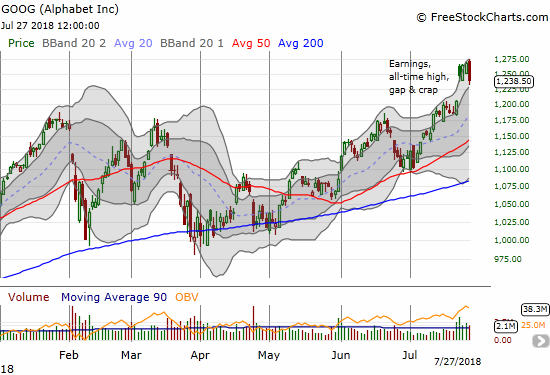
Alphabet (GOOG)
Suddenly GOOG is vying for position as one of the remaining leaders for the market. The stock gapped up impressively post-earnings only to fade back to its upper-BB. Buyers swarmed right back over the next two days. Friday’s selling eliminated those incremental gains and set a new post-earnings low. The stock still has a lot of post-earnings cushion. A full reversal would be bearish.
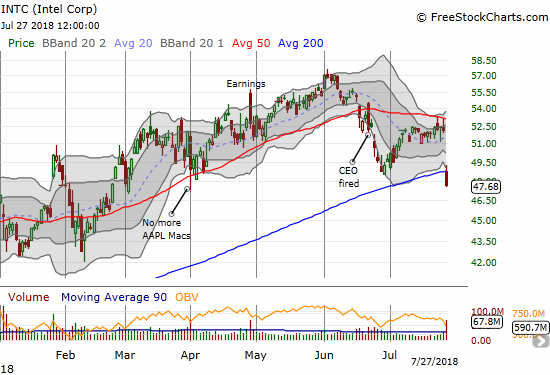
Intel (INTC)
Friday’s post-earnings disaster was another reminder of why I prefer to play INTC between earnings. The stock made a 5-month low and crashed through uptrending 200DMA support. I am now on the hunt for the next entry point: either a point where the stock looks like it is stabilizing and/or a close back above the 200DMA.
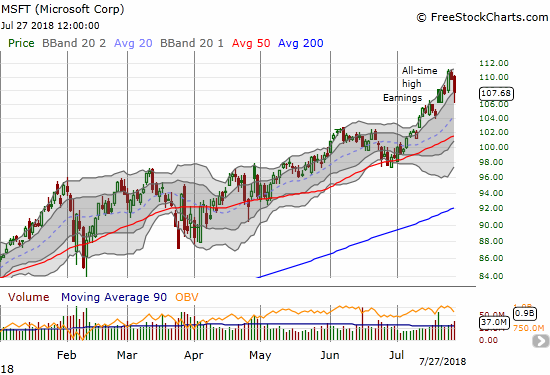
Microsoft (MSFT)
I give “Mr. Softee” credit. I thought the fade on the post-earnings gap and crap flagged a likely top. Instead, MSFT quickly invalidated the topping signal so much so that Friday’s selling did not re-establish a bearish topping pattern. The selling was of course still ugly though with a 1.8% loss and strong selling volume.
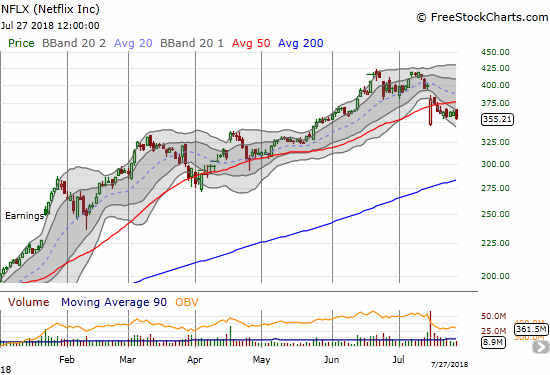
Netflix (NFLX)
NFLX further confirmed its topping action with new post-earnings lows this week.
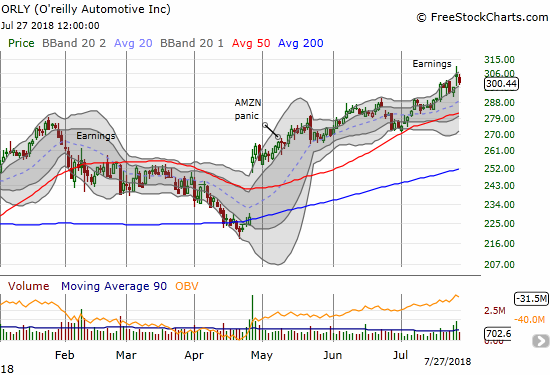
O’reilly Automotive (ORLY)
ORLY continues to shine in the wake of two past Amazon Panics. Last week it made more all-time highs and got a small pop out of earnings. I took profits on the post Amazon Panic trade a while back.
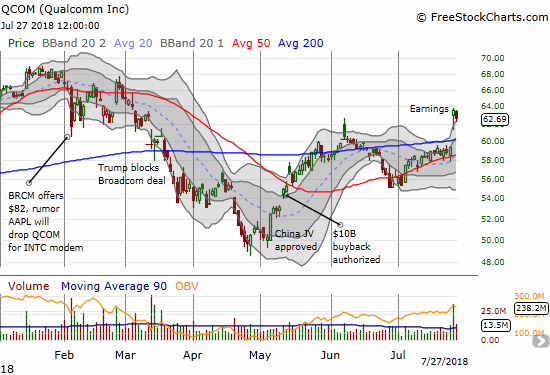
Qualcomm (QCOM)
I made the case for buying QCOM over 4 months ago and re-asserted the case 2 months ago. Last week’s post-earnings breakout was a major validation of the strategy.
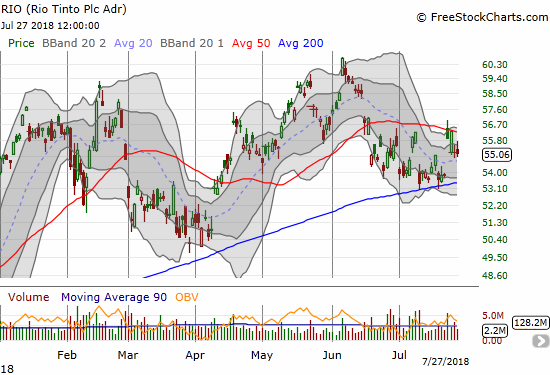
Rio Tinto (RIO)
I did well to hold onto my RIO call option left over from the last BHP vs RIO pairs trade. I was quickly rewarded with a gap up to start last week. I promptly took profits. I will not likely go long RIO again as part of the current pairs trade until/unless RIO closes above 50DMA resistance.
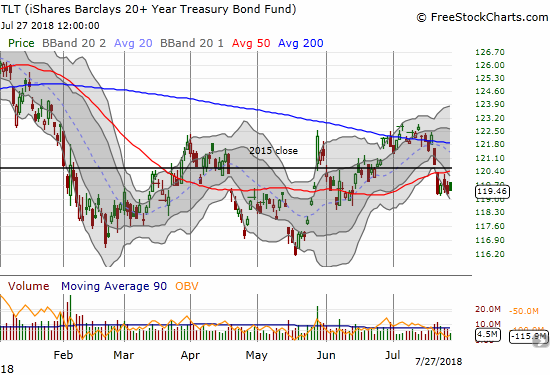
iShares 20+ Year Treasury Bond ETF (TLT)
My TLT put options quickly got “close enough” to my price target with last Monday’s 50DMA breakdown so I took profits. I am eagerly looking for the next relief rally to fade. I am guessing bond yields will likely go lower (TLT higher) before going higher (TLT lower) in the face of current stock market weakness.
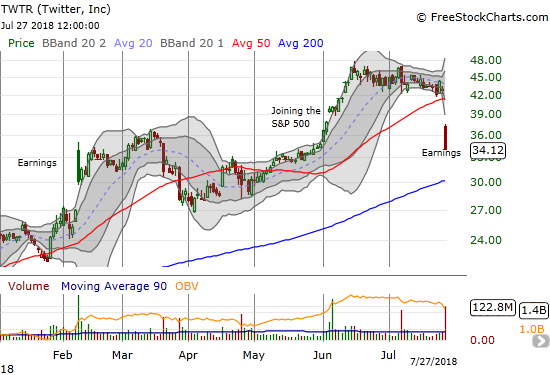
Twitter (TWTR)
TWTR got slammed post-earnings with a 20.5% loss. Unlike other players in the space, I look at this selling as a buying opportunity. The technicals are clearly ugly even with the stock over-stretched well below its lower-BB, so I was not aggressive on Friday. I will double down at or near 200DMA support. I have a soft spot for TWTR because it has firmly established itself as the world’s major public square. President Trump has underwritten Twitter’s foundation at least in spirit (or is that in demonstrative outbursts?).
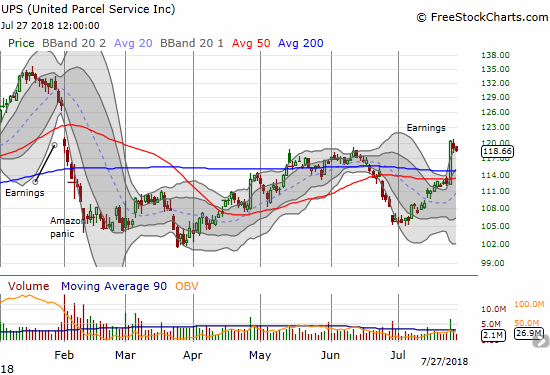
United Parcel Service (UPS)
I had to wait a LONG time for this Amazon Panic play. Last week’s post-earnings breakout validated the strategy. Granted, I was initially wary, and I thought May’s breakout and June’s confirmation already validated the strategy…
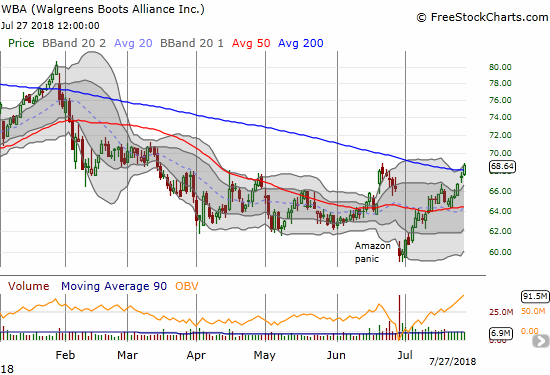
Walgreens Boots Alliance (WBA)
The Amazon Panic trading strategy turned out to work wonders for WBA. While I feel like I am playing in my own irony by accumulating a short position, I am sticking by the claims I made in outlining the drivers of what looks like a secular decline for the major pharmacies.
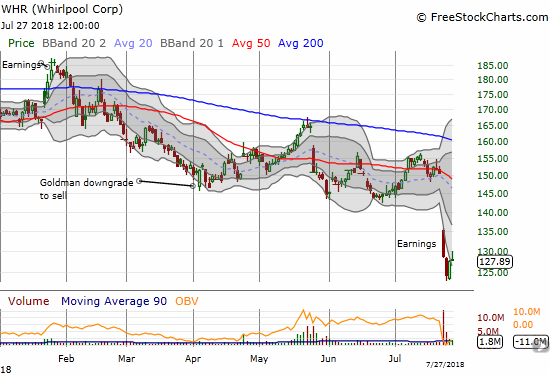
Whirlpool (WHR)
WHR made new major lows in the wake of earnings. The stock never quite recovered from 2018’s early February swoon. The failure at 200DMA resistance was a death knell. The stock carries poor tidings for the global (retail) economy.
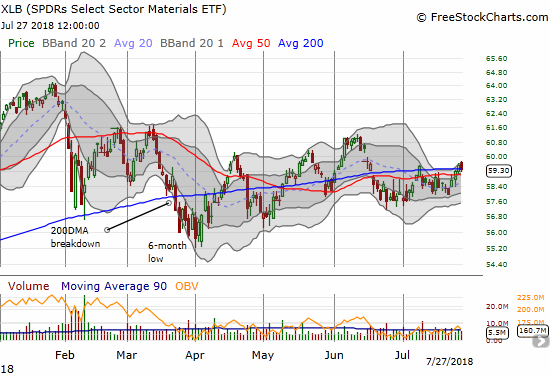
Materials Select Sector SPDR ETF (XLB)
XLB has been extremely slow to recover from this year’s earlier sell-off. It held up well last week even after giving up another brief 200DMA breakout. For now, XLB stays in the “show me” category with peaks in June and then February/March still a ways off, looming as ready resistance.
— – —
FOLLOW Dr. Duru’s commentary on financial markets via email, StockTwits, Twitter, and even Instagram!
“Above the 40” uses the percentage of stocks trading above their respective 40-day moving averages (DMAs) to assess the technical health of the stock market and to identify extremes in market sentiment that are likely to reverse. Abbreviated as AT40, Above the 40 is an alternative label for “T2108” which was created by Worden. Learn more about T2108 on my T2108 Resource Page. AT200, or T2107, measures the percentage of stocks trading above their respective 200DMAs.
Active AT40 (T2108) periods: Day #110 over 20%, Day #79 over 30%, Day #74 over 40% (overperiod), Day #1 under 50% (underperiod ending 16 days over 50%), Day #13 under 60%, Day #30 under 70%
Daily AT40 (T2108)
")
Black line: AT40 (T2108) (% measured on the right)
Red line: Overbought threshold (70%); Blue line: Oversold threshold (20%)
Weekly AT40 (T2108)

*All charts created using freestockcharts.com unless otherwise stated
The charts above are my LATEST updates independent of the date of this given AT40 post. For my latest AT40 post click here.
Related links:
The AT40 (T2108) Resource Page
You can follow real-time T2108 commentary on twitter using the #T2108 or #AT40 hashtags. T2108-related trades and other trades are occasionally posted on twitter using the #120trade hashtag.
Be careful out there!
Full disclosure: long SPY puts, long BHP puts, long TWTR shares and calls, short FB and long FB call (left-over from calendar call spread), long GE calls, long QCOM shares and calls, long UPS calls, short WBA
*Charting notes: FreeStockCharts.com stock prices are not adjusted for dividends. TradingView.com charts for currencies use Tokyo time as the start of the forex trading day. FreeStockCharts.com currency charts are based on Eastern U.S. time to define the trading day.