
AT40 = 57.6% of stocks are trading above their respective 40-day moving averages (DMAs)
AT200 = N/A% of stocks are trading above their respective 200DMAs
VIX = 12.9
Short-term Trading Call: neutral
Commentary
I remain fascinated by the S&P 500’s increasing resilience to worsening macro-economic headlines. The apparent boredom with the headlines about trade wars, and now potential currency wars, is faintly reminiscent of the market’s early boredom with worsening headlines about the unraveling of the housing bubble starting in 2007. The market is essentially not just betting on a minimal impact from the worsening macro-economic backdrop, but it is also betting on an imminent good outcome – like some kind of “victory.”
Jerome Powell had a chance to issue a warning about the potential impact of trade wars. Instead, he chose Fedspeak in his one reference to trade in prepared testimony last week:
“Looking ahead, my colleagues on the FOMC and I expect that, with appropriate monetary policy, the job market will remain strong and inflation will stay near 2 percent over the next several years…the economic outcomes we experience often turn out to be a good deal stronger or weaker than our best forecast. For example, it is difficult to predict the ultimate outcome of current discussions over trade policy as well as the size and timing of the economic effects of the recent changes in fiscal policy. Overall, we see the risk of the economy unexpectedly weakening as roughly balanced with the possibility of the economy growing faster than we currently anticipate.” – from the Semiannual Monetary Policy Report to the Congress July 17, 2018
This middle-of-the-road pronouncement suggests that potential obstacles lay ahead for economic growth, but nothing is on the radar of the Fed that causes it notable concern.
Still, the S&P 500 (SPY) gapped down on the day of Powell’s testimony before smartly recovering. The index next floated back to where it ended the previous week.
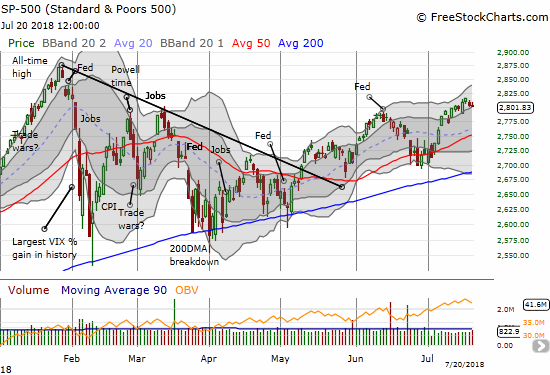
AT40 (T2108), the percentage of stocks trading above their respective 40-day moving averages, also closed the week where it closed the previous week. AT40 ranged from 51.8% to 62.1% before settling in at 57.6%. My favorite technical indicator still suggests the underlying market is weaker than it looks. Still, I am maintaining a neutral rating on the short-term trading call until AT40 reaches a new extreme.
Compared to Tuesday’s gap down, the S&P 500 fell asleep when headlines first dropped about Trump’s displeasure with the Federal Reserve’s monetary policy of rate hikes. The President doubled down on his attack on Friday. Trump also complained about trading partners manipulating their currencies lower as a way to gain advantage over the U.S. In addition, Friday opened with Trump announcing he is prepared to slap tariffs on all $500B worth of Chinese exports to the U.S. given China’s refusal to back down on its offending trade policies.
While the stock market yawned, currency markets DID respond. In particular, the U.S. dollar index faded from what was a bullish breakout at first on Friday. The Chinese yuan also faded sharply from the 6.8 level after a week of withering weakness against the U.S. dollar.
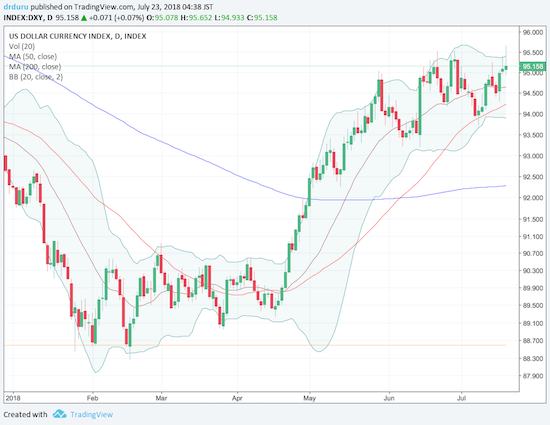
Source: TradingView.com
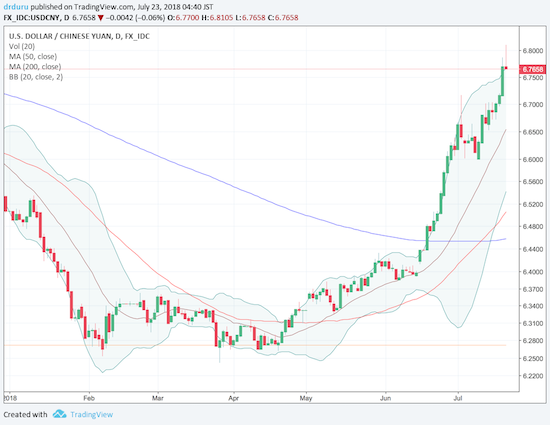
Source: TradingView.com
Once again, I am not surprised by the deepening extremes of the trade war. A month ago, I posted a link to a report from the White House titled “How China’s Economic Aggression Threatens the Technologies and Intellectual Property of the United States and the World.” The report is well-done, and it provides crisp clarity to the urgency felt by Trump’s administration to take on China head-to-head. So I continue to believe the dollar will trend higher as the U.S. chips and hacks away at China’s trade advantages. Similarly, it also makes sense that the Chinese yuan has weakened so much in the last month. I treated Friday’s pullback in the U.S. dollar as a small buying opportunity to build (slowly) a fresh dollar bull position.
$DXY selling on double-down on anti-Fed talk. Buying weakness esp w/threats to tax all Chinese imports https://t.co/geDl6xBVAn #forex $EURUSD pic.twitter.com/znCqYirs7k
— Dr. Duru (@DrDuru) July 20, 2018
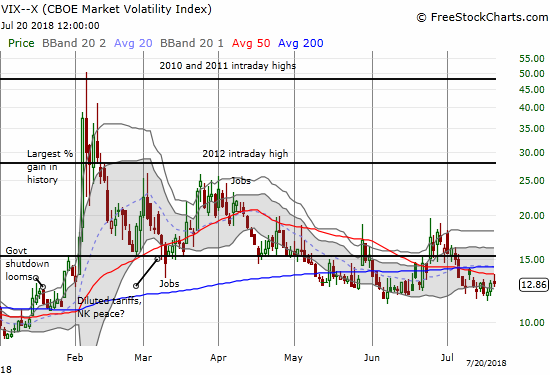
As Trump expands the scale and scope of his economic war on the rest of the world, he is laying down as yet unseen minefields. That is, economic uncertainty is increasing. The dollar SHOULD strengthen from U.S. economic strength. Other currencies are relatively weaker as the related economies are not doing as well as the U.S. economy (especially in the UK and the eurozone). The Fed SHOULD hike rates away from historic lows in the face of economic strength. The Fed will of course not bow down to the President, but if it DID slow down its well-telegraphed rate hikes, then economic strength would have to drive inflation a lot higher. The Fed would also then fail to address the likely inflationary cascade of higher prices into the U.S. economy from higher tariffs. The longer these dynamics drag on, the more likely someone somewhere will step on landmines. Under these circumstances, the volatility index, the VIX, looks far too low. The market’s boredom is the opportunity to accumulate portfolio protections on the cheap.
I am doing two week rotations on my ProShares Ultra VIX Short-Term Futures (UVXY) call options in an effort to have a position in place whenever the market wakes up from its slumber in a big way.
The bond market also responded, albeit not in the direction I expected given the headlines. Even with Trump complaining about high interest rates, bond yields shot up on Friday. As a result, the iShares 20+ Year Treasury Bond ETF (TLT) tumbled 1.2% and seemed to confirm resistance at its 200DMA. I quickly reloaded on TLT put options.
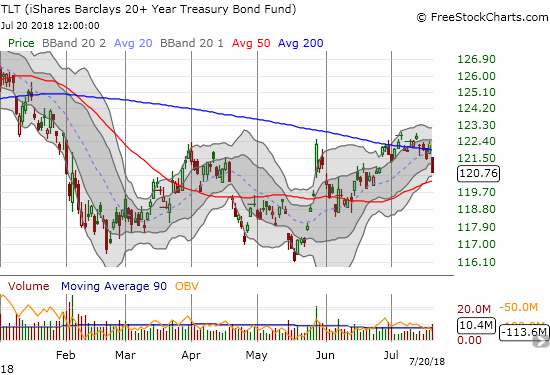
Note that the higher yields are consistent with increasing odds for two more rate hikes from the Federal Reserve in 2018. The 30-day Federal Fund Futures went from pricing in a 56.6% chance of at least a second rate hike in December at the end of the previous week to a 62.3% chance at the end of last week.
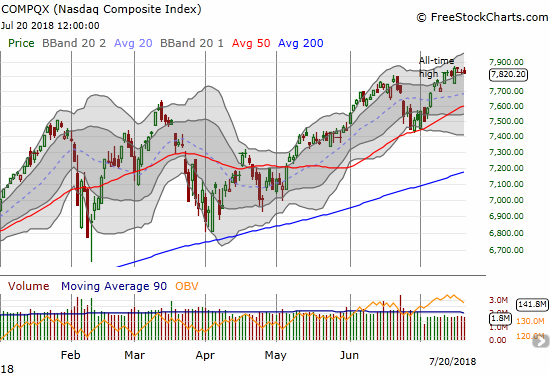
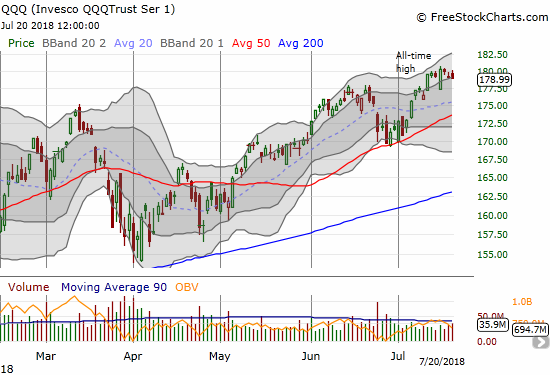
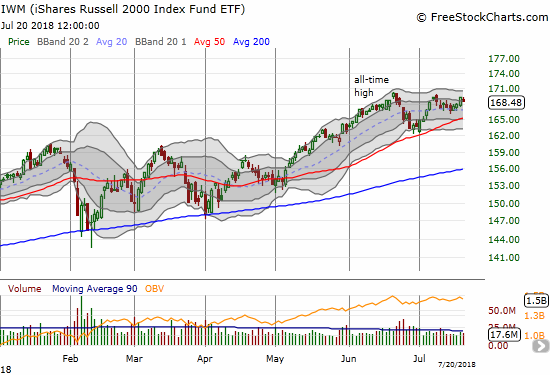
Other major indices meandered alongside the S&P 500. The patterns are not at alarm levels given these indices are just off recent all-time highs. The NASDAQ and the Invesco QQQ Trust (QQQ) churned away for the week. The iShares Russell 2000 ETF (IWM) faces a minor challenge as it pulled away from another recent peak.
The Financial Select Sector SPDR ETF (XLF) showed a brief spark of promise on Wednesday only to get pulled down again. I decided to use Thursday’s pullback as a buying opportunity to balance out my otherwise wary bias against the market. XLF held 50DMA support on Friday.
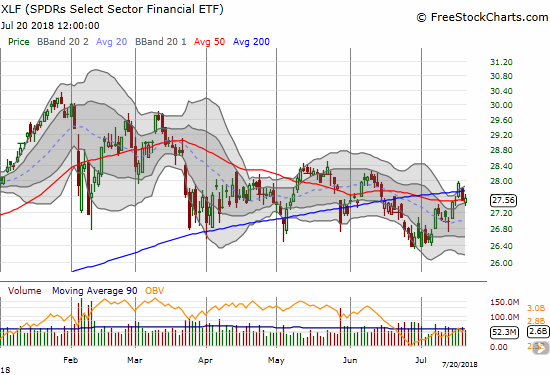
CHART REVIEWS
Alcoa (AA)
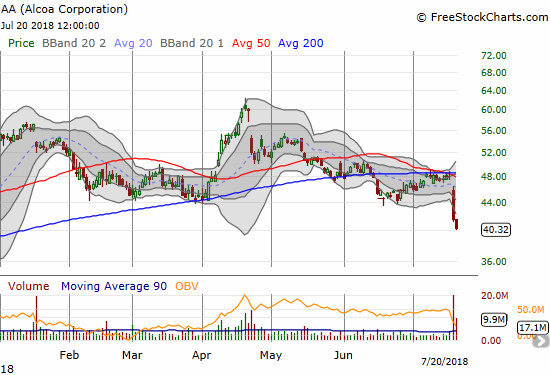
Tariffs were supposed to help Alcoa. It turns out the results of the economic battles have been quite mixed, even tilted negatively against Alcoa. AA reduced guidance for 2018 EBITDA as a result of “recent market prices, tariffs on aluminum imports, increased energy costs and operational impacts”, and the market rewarded the stock with a 13.3% loss. Additional selling on Friday pushed the stock even further below its lower-Bollinger Band (BB).
The company provided some key quotes on the negative consequences of tariffs (from the Seeking Alpha transcript of the earnings call):
“One new and recurring unfavorable impact is tariffs on our imports into the U.S. mostly from our Canadian smelters, which you see in the other category…
Unfortunately tariffs on U.S. aluminum imports do not remedy [the] underlying structural issues of the U.S. and global aluminum industries…First because tariffs are driving only a limited increase in supply, U.S. imports will remain essential…Second, tariffs have so far yielded mixed results. While tariffs have pushed the Midwest premium higher providing U.S. aluminum producers with a benefit, there is no long-term certainty to the duration of those tariffs. Tariffs also distort the market by incentivizing the restart of aged inefficient capacity, which contributed to curtailments and closures in the first place…In short, tariffs will not solve the challenges faced in the aluminum industry.”
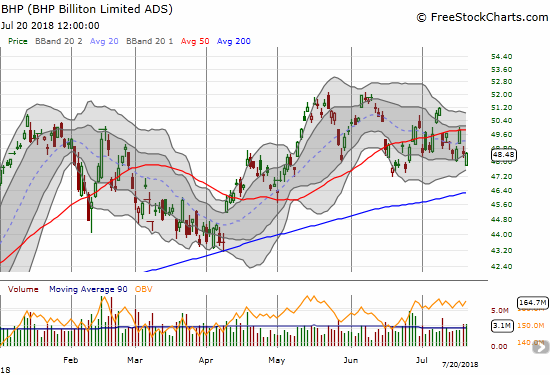
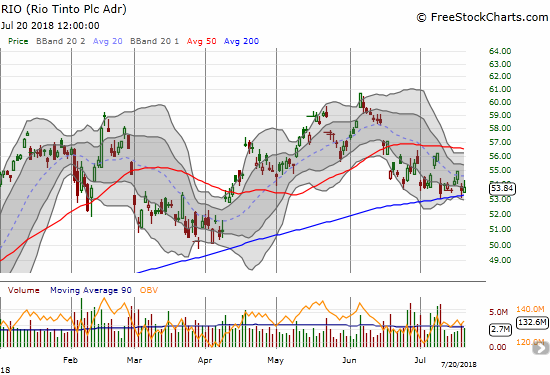
BHP Billiton (BHP) and Rio Tinto (RIO)
My latest round on the pairs trade featuring BHP puts versus RIO calls ended with a whimper. While I bought and sold a RIO call option, it did not make up for the loss on the last tranche of BHP puts. I have a single RIO call option outstanding. Both stocks are higher than would expect given pressures on copper (new 52-week low) and iron ore (lowered price forecasts from Australia’s Resources and Energy Quarterly published by the Department of Industry, Innovation and Science) and a weakening Chinese economy. I am holding off on fresh BHP puts until I can fade a new rally.
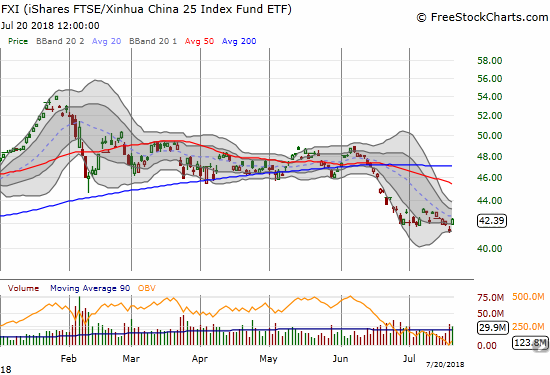
iShares China Large-Cap ETF (FXI)
While the Chinese yuan weakened, FXI also weakened. FXI started stabilizing this month despite on-going weakness in the yuan. Still, the 1-2 punch confirms the negative impact of trade wars with the U.S. and likely confirms for President Trump that he can eventually get China to bow to U.S. demands.
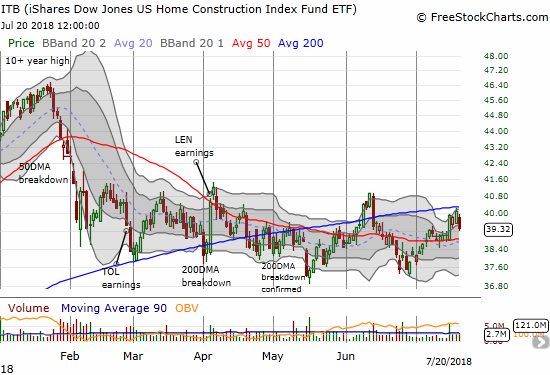
iShares US Home Construction ETF (ITB)
ITB had a strong week until long-term rates spiked on Friday. Interest rates will continue to nag on the housing sector no matter how much homebuilders continue to claim little to no impact from higher mortgage rates. ITB’s 200DMA held as stiff resistance.
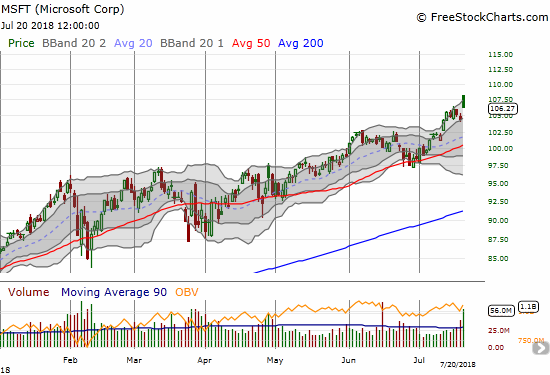
Microsoft (MSFT)
MSFT earnings could have led tech higher. Instead, a gap and crap muted the software giant’s impact. Now, MSFT looks like it has topped. A new all-time high invalidates the topping pattern.
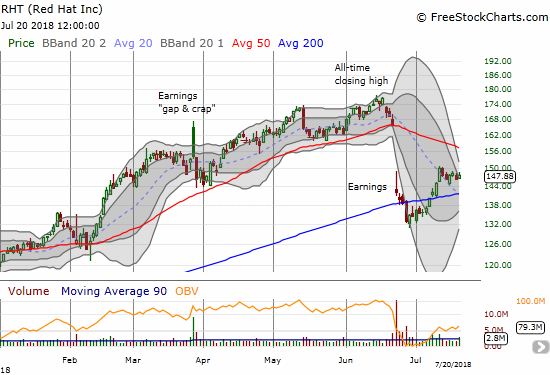
Red Hat (RHT)
Sellers in RHT exhausted themselves after punching the stock through 200DMA support. So a move that confirmed the 50DMA breakdown has transformed into a hopeful bottom for buyers. I will be looking for the trading action when (if?) price hits 50DMA resistance.
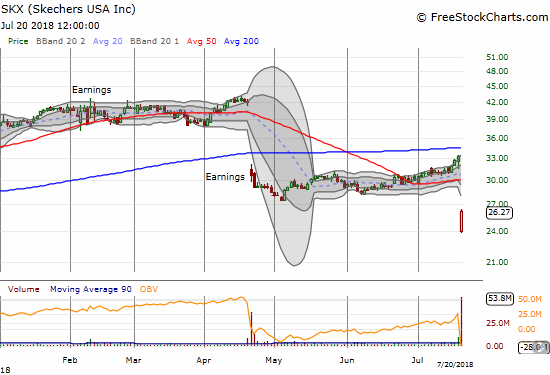
Skechers (SKX)
I should have listened to my teenage nephew back in January when he dogged out SKX as an out-of-fashion shoe. It took earnings three months later for SKX to show weakness. The spectacular gap down confirmed my nephew’s bearishness. Another post-earnings gap down on Friday confirmed SKX as a broken down stock…again. How many more cycles of breakdowns can this shoe company take?
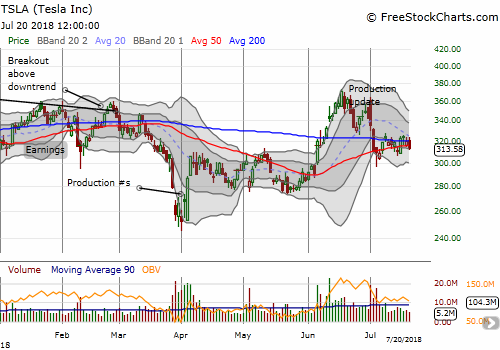
Tesla (TSLA)
Elon Musk’s behavior gets more and more bizarre and extreme, and the bear/bull camps on TSLA get even more divided. July has delivered mostly a stalemate. I have twice taken profits on calendar call spreads on TSLA to play what I expected to be an upward bias: the market is generally and incredibly forgiving toward TSLA. With earnings coming on August 1st, I cannot economically play weekly calendar spreads. I am now back to watching the drama from the sidelines.
Other trades: took profits on NFLX calendar put spread, sold AAPL calls at a loss (the weekly AAPL call trade), SPY puts and UVXY calls expired worthless
— – —
FOLLOW Dr. Duru’s commentary on financial markets via email, StockTwits, Twitter, and even Instagram!
“Above the 40” uses the percentage of stocks trading above their respective 40-day moving averages (DMAs) to assess the technical health of the stock market and to identify extremes in market sentiment that are likely to reverse. Abbreviated as AT40, Above the 40 is an alternative label for “T2108” which was created by Worden. Learn more about T2108 on my T2108 Resource Page. AT200, or T2107, measures the percentage of stocks trading above their respective 200DMAs.
Active AT40 (T2108) periods: Day #105 over 20%, Day #74 over 30%, Day #69 over 40%, Day #12 over 50% (overperiod), Day #8 under 60% (underperiod), Day #25 under 70%
Daily AT40 (T2108)
")
Black line: AT40 (T2108) (% measured on the right)
Red line: Overbought threshold (70%); Blue line: Oversold threshold (20%)
Weekly AT40 (T2108)

*All charts created using freestockcharts.com unless otherwise stated
The charts above are my LATEST updates independent of the date of this given AT40 post. For my latest AT40 post click here.
Related links:
The AT40 (T2108) Resource Page
You can follow real-time T2108 commentary on twitter using the #T2108 or #AT40 hashtags. T2108-related trades and other trades are occasionally posted on twitter using the #120trade hashtag.
Be careful out there!
Full disclosure: long SPY puts, long ITB calls, long RIO call, long UVXY call options, long AA, long TLT puts, long AAPL calls, net long the U.S. dollar
*Charting notes: FreeStockCharts.com stock prices are not adjusted for dividends. TradingView.com charts for currencies use Tokyo time as the start of the forex trading day. FreeStockCharts.com currency charts are based on Eastern U.S. time to define the trading day.