
I saw a flicker of hope for home builders in the May Housing Market Review. Traders decided to snuff that flicker out very quickly afterward. When I wrote June’s housing market review and described a “struggling flicker,” the iShares US Home Construction ETF (ITB) was once again bouncing off the bottom of 2018’s trading range. That last rally hit a wall at the 200-day moving average (DMA). With ITB once again trying to bounce off the 2018 low, the trading range looks intact but signs are growing of an underlying bias to a breakdown.
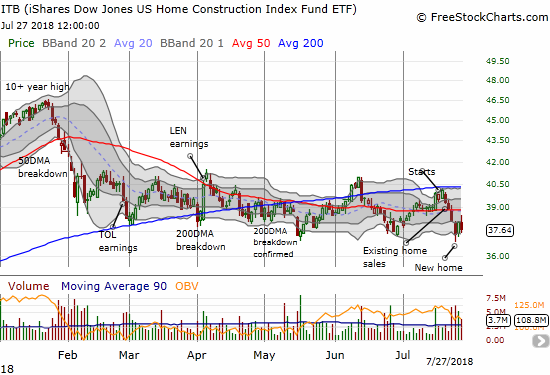
The chart shows the deeply negative reactions to the latest round of collective housing data. Prior to July, the reaction to the earnings report of home builders held larger sway on ITB. This time around, the economic data took on at least as much significance as the earnings data. Moreover, the reaction to earnings was surprisingly and sharply divergent.
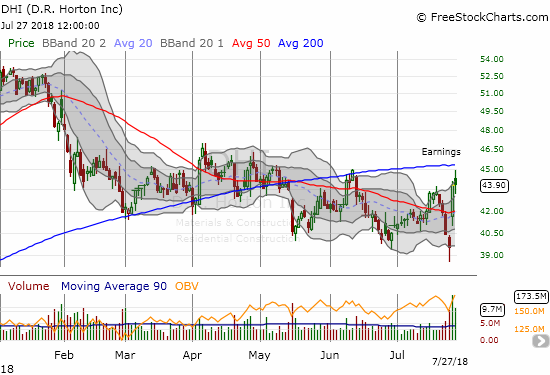
On the positive side, D.R. Horton (DHI) overcame the recent sharp sell-off in home builder stocks to soar 11.6% in the wake of its latest earnings report. Only 200DMA resistance slowed down the follow-up buying.
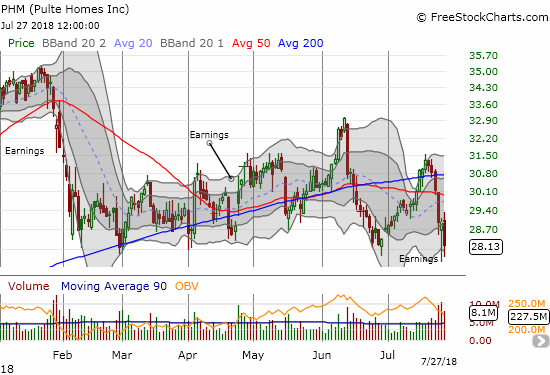
Pulte Home (PHM) initially sold off to a new 10-month low. Perhaps aided by the strong rally in DHI, PHM recovered sharply. However, sellers returned on Friday and closed the stock just above the lows for 2018. PHM has been a particular disappointment since a promising breakout in June and then the last rally which seemed to recover the rising 200DMA pivot.
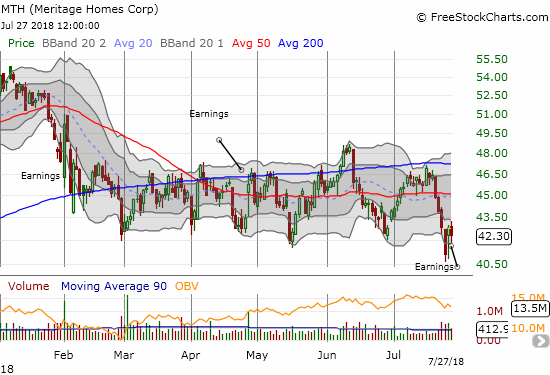
The earnings for Meritage Homes (MTH) got a reception similar to PHM’s earnings. The follow-up selling on Friday was much milder, increasing the odds ever so slightly that MTH may find a bottom with its latest earnings report.
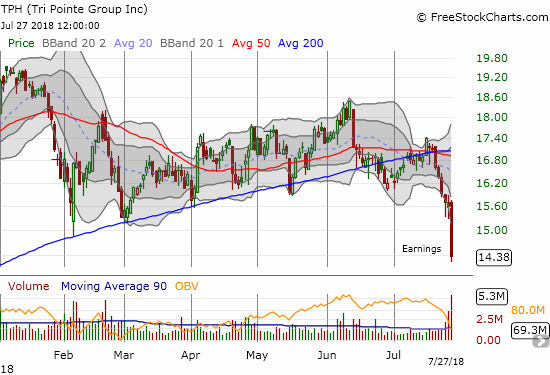
TRI Pointe Group, Inc. (TPH) got the worst reception of all for home builder earnings last week. TPH plunged 7.7% on extremely high volume, including the high-volume selling that preceded earnings. The stock confirmed a bearish breakdown from 200DMA support. TPH now sits near an 11-month low and is close to reversing all its gains from the October breakout.
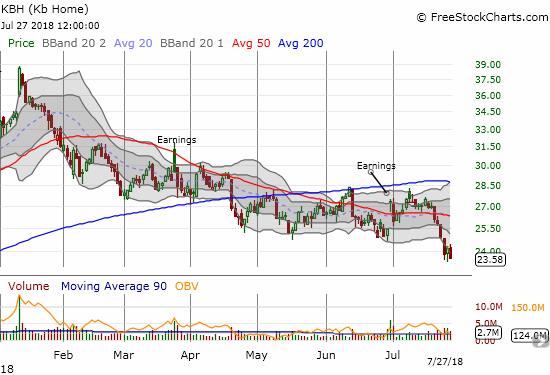
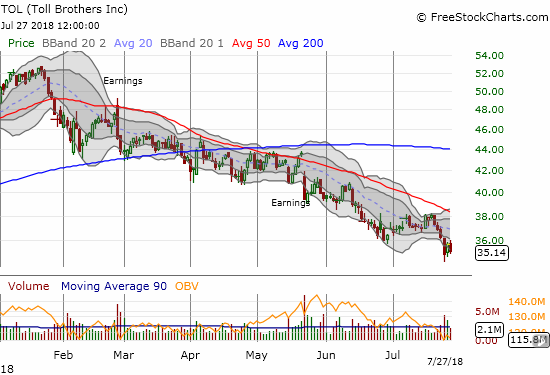
Two major builders had important breakdowns last week without requiring a special kick from earnings: KB Home (KBH) and Toll Brothers (TOL). Both stocks confirmed on-going downtrends for 2018.
Source for stock charts: FreeStockCharts.com
Even performance leader LGI Homes (LGIH) trades at a near 10-month low. Investors are clearly closing calibrating their selling across the sector with so many stocks around 9 to 11 month lows. From the technical perspectives of the components, ITB looks like an index doomed to set lower lows in due time. Along with this bearish trading action, the market continues to express its disbelief in any good news from home builders and continues to anticipate a bearish turn in the housing market data. Collectively, July’s housing market data may have delivered the first definitive signs of that turn.
New Residential Construction (Single-Family Housing Starts) – June, 2018
While housing starts surged in May and left no doubt that home builders were confident as ever, the subsequent plunge in housing starts in June appear to temper that enthusiastic interpretation.
Single-family housing starts for June were revised upward from 936,000 to 944,000, a third straight month of significant upward revisions. Still, June starts plunged month-over-month by 9.1% to 858,000, the lowest level of the year. On an annual basis, single-family housing starts were practically flat at a -0.2% change. This drop is the first year-over-year decline since a 2.0% decline in August, 2016.
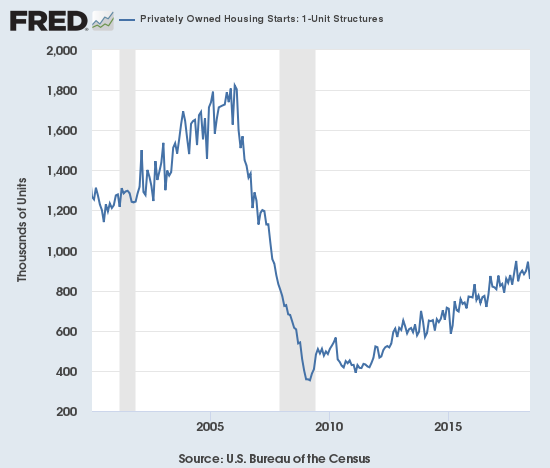
Source: US. Bureau of the Census, Privately Owned Housing Starts: 1-Unit Structures [HOUST1F], retrieved from FRED, Federal Reserve Bank of St. Louis, July 26, 2018.
Over the 8 months prior to May, regional year-over-year changes in starts exhibited wide dispersion. For May, housing starts were very strong across the board. For June, the Midwest stood out as a large loser. The Northeast, Midwest, South, and West each changed 6.3%, -17.0%, 3.1%, and 1.4%. In other words, the headline slowdown in starts was largely driven by the particularly poor performance of the Midwest region.
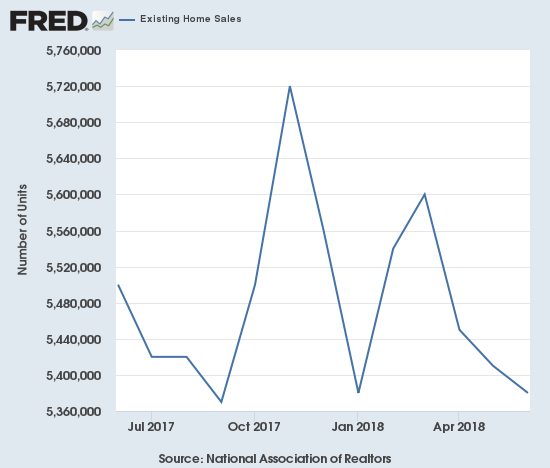
Existing Home Sales – June, 2018
A third straight month-over-month decline and a fourth straight month of year-over-year declines in sales for existing homes helped further dampen the mood for the stocks of home builders even though limited inventories continue to be the dominant story constraining existing home sales.
The February existing sales numbers ended a 2-month sales decline and softened a bit my alarm bells. In March, monthly sales continued to increase, but the year-over-year change was a decrease. For April, both monthly and year-over-year changes were declines. May recorded similar declines and put existing home sales right back in “yellow” cautionary territory. June’s double whammy of a third monthly decline coupled with a fourth year-over-year decline, puts existing home sales in “red” territory.
The seasonally adjusted annualized sales in June of 5.38M was down 0.4% month-over-month from 5.41M in sales for May (downwardly revised from 5.43M). Year-over-year sales decreased 2.2% and once again stayed consistent with the current trend of decelerating existing home sales.
(As of the March, 2018 data, the NAR further reduced historical data to just 13 months. For historical data from 1999 to 2014, click here. For historical data from 2014 to 2018, click here)
Source for chart: National Association of Realtors, Existing Home Sales© [EXHOSLUSM495S], retrieved from FRED, Federal Reserve Bank of St. Louis, July 28, 2018.
The routine description for existing sales is usually sales decline because of a shortage of inventory and sales increase in spite of inventory shortages. The National Association of Realtors (NAR) pulled the inventory card yet again and emphasized that underlying demand is strong but high pricing tempered sales:
“‘There continues to be a mismatch since the spring between the growing level of homebuyer demand in most of the country in relation to the actual pace of home sales, which are declining…The root cause is without a doubt the severe housing shortage that is not releasing its grip on the nation’s housing market. What is for sale in most areas is going under contract very fast and in many cases, has multiple offers. This dynamic is keeping home price growth elevated, pricing out would-be buyers and ultimately slowing sales…
Realtors® throughout the country continue to stress that there’s considerable pent-up demand for buying a home among the millennial households in their market…Unfortunately, they’re just not making meaningful ground, and continue to be held back by too few choices in their price range…”
The NAR was so dour about the inventory situation in its report that it actually downplayed the first year-over-year increase in inventory since June, 2015 when, as the NAR noted in its press conference, the “taper tantrum” sent bond rates soaring and scared away a lot of homebuyers. This “cross-over” is something the NAR anticipated for late summer or fall (and a dynamic I suspected given persistent monthly increases in inventory), so the NAR should have been triumphant and optimistic. The NAR chose instead to reemphasize that current inventory levels are insufficient.
The press conference contrasted the absolute inventory negativity with the expected cautious optimism about inventory potentially bottoming. The NAR also put a laser focus on housing markets without affordability issues to point out the strong demand and sales in those places. So, the NAR took solace in seeing inventory increase in the super-hot markets of Seattle and Denver.
The 1.95M existing homes for sale represents a year-over-year increase of 0.5% and ends 36 straight months of annual declines. Inventory increased from May to June by 4.3%, a SIXTH straight monthly increase. Despite these gains, the supply crisis continues to run deep at 4.3 months of supply at the current sales rate, up from 4.2 a year ago and 4.1 in May. The key, of course, is whether a new trend is underway AND whether the absolute increase in inventory presages a demand slowdown. I will be particularly concerned if the price relief that SHOULD come with higher inventory does not help drive up sales levels.
The share of sales going to first-time buyers stayed flat at 31%. This share was 33% in April, 30% in March, 29% in February and November was 33%. So while the NAR raises alarms about first-time buyers – for example, in June’s report: “The abrupt hike in mortgage rates this spring, along with price appreciation and competition being the strongest in the entry-level part of the market, is why first-time buyers are not as active as they should be and their participation remains below its historical average” – I think there is more noise than signal in these data. The share percentage is just bouncing around. Note that last September was the first time in two years where the share dropped below 30%.
The average share for first-time homebuyers for 2016 was 35%. The NAR’s 2017 Profile of Home Buyers and Sellers reported an average of 34% for 2017. Investors purchased 13% of homes in June, down from 15% in May. Investor sales averaged a share of 15% in 2017 and 14% in 2016.
Existing home sales increased in just one region: Northeast -4.0%, Midwest -3.1%, South 0.4%, West -5.0% year-over-year. As usual, regional sale fluctuations had no relationship to the on-going price run-ups. Last month’s price decline in the Northeast looks like a true outlier. The West had a particularly extreme price gain relative to the sales drop. The year-over-year price changes were relatively robust: Northeast 3.3%, Midwest 3.5%, South 2.7%, West 10.2%.
June’s 5.2% year-over-year increase in the overall median price of an existing home delivered the 76th consecutive month with a year-over-year increase. The median price of $276,900 is significantly higher than May’s $264,800 and is a third straight new all-time high.
Single-family sales declined 0.6% on a monthly basis and decreased on a yearly basis by 2.3%. The median price of $279,300 was up 5.2% year-over-year.
New Residential Sales (Single-Family) – June, 2018
In February, new home sales barely eked forward. New home sales were resurgent in March. April sales did not keep pace on a monthly basis but delivered a strong year-over-year performance. In a stark contrast to existing home sales, new home sales in May surged on a monthly and year-over-year basis. For June, new home sales contrasted existing home sales with another year-over-year increase. The monthly decline is not a surprise given May’s surge. Still, new home sales made a new low for the year.
The Census Bureau revised May sales of new single-family homes downward from 689,000 to 666,000, a third straight month with a sizable downward revision. New home sales for June decreased 5.3% month-over-month and increased 2.4% year-over-year to 631,000. Year-over-year gains regularly hit double digits since 2012; last November’s 26.6% jump was the highest since February, 2015 when new home sales soared 29.8% year-over-year. May broke a string of four months of single-digit gains which represented a concerning deceleration in new home sales. That deceleration continued with June’s numbers.
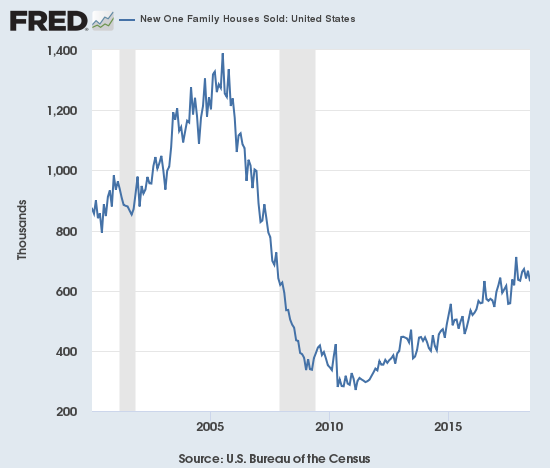
Source: US. Bureau of the Census, New One Family Houses Sold: United States [HSN1F], retrieved from FRED, Federal Reserve Bank of St. Louis, July 28, 2018.
In December, the inventory of new homes dropped to 5.2 months of supply. A market for homes is in balance at 6 months of supply. February’s inventory stood at 5.9 months. It proceeded to decline as low as 5.2 in May. For June, inventory jumped back up to 5.7 days of sales.
May’s median price of $313,000 was an actual year-over-year decline. The average price also declined 2.6% year-over-year. June delivered a second straight set of declines. The median price declined 4.2% year-over-year, and the average price declined 2.0% year-over-year. These declines are a curious contradiction to the relentless price increases for existing homes.
On a regional basis, new home sales exhibited extreme divergence with the Northeast and May on polar opposites of the scale. After a string of very strong gains since August, the very volatile Northeast finally ran out of gas in January with a 44.2% year-over-year plunge. For May, the Northeast dropped by 16.3% and bounced right back in June with a 20.9% gain. The Midwest ended two straight months of very strong gains with a more modest 7.6% increase in June. The South gained 8.1% year-over-year. The West cooled off from January’s blistering 33.2% year-over-year gain to gain 3.1% year-over-year for February. The West heated up again in March with a 24.7% jump. The West stayed hot in April with an 18.9% gain in sales. For May, the West cooled off by eking out a 0.6% gain and took a plunge in June with a 15.0% drop.
Home Builder Confidence: The Housing Market Index – July, 2018
In the April housing market review, I explained why I would not have thought much of March’s slight decline in the Housing Market Index (HMI). At 70, the HMI was still higher than it was for most of 2017. For July, the HMI stayed at 68 for the second straight month. The components of the HMI moved in each possible direction: “The HMI index measuring current sales conditions remained unchanged at 74. Meanwhile, the component gauging expectations in the next six months dropped two points to 73 and the metric charting buyer traffic rose two points to 52.” Together, these components still show a pattern of languishing in 2018 and increase the significance of the HMI’s slip from 70 to 68.
The statement from the NAHB in May was very positive with a big caveat for rising prices. For June, the NAHB made an even bigger issue of lumber prices by shining a spotlight on trade actions that have driven those prices higher. For July, the NAHB chose not to single out any specific factor driving up the construction costs that “..make it increasingly challenging to produce homes at competitive price points, especially for the entry-level market where inventory is most needed.”
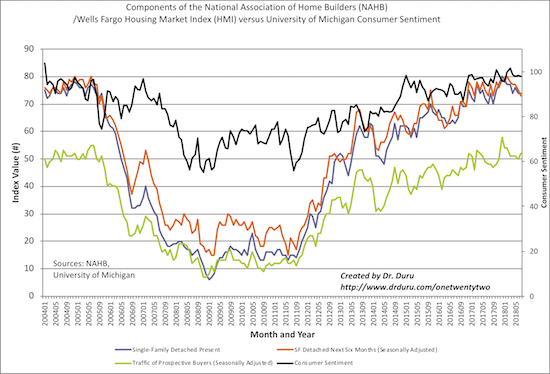
Source: NAHB
While the overall HMI stayed flat, the Midwest was the only region to remain flat as well. The Northeast fell 2 points; at 56 it is only two points above its low for 2018. The South managed to jump 2 points. The West fell 3 points to 73, a low for the year. Given the plunge in new and existing home sales in the West, the notable decline in confidence confirmed that something could be amiss again in the West. Prices are likely overdue for some kind of correction, but home builders are not likely in a good position to sustain significant price drops given cost hikes which tend to be worst in the West.
Parting thoughts
While the picture ever slowly deteriorates for the housing market and especially the home builder stocks, there is a curious mix of positives and negatives in other data sources.
The biggest cautionary tale comes from gross private domestic fixed residential investment which includes residential construction like new single-family and multi-family houses, manufactured housing (or mobile homes). While market headlines celebrated the 4.1% GDP growth in the second quarter, the underlying data provided indications that this strong growth will not last long. Most relevant for this post is the actual 1.1% DECLINE in private fixed residential investment in Q2. While this investment declined 1.0% in Q2 of 2017, Q2 of preceding years were strong and positive. Moreover, Q1 2018 delivered a 3.4% decline. A chart of the year-over-year changes makes the deceleration plain and clear.
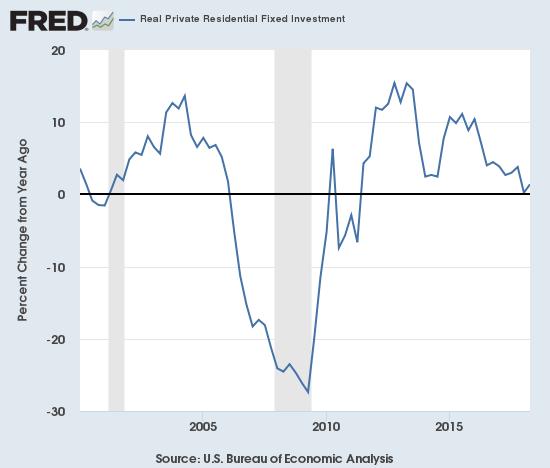
Source: U.S. Bureau of Economic Analysis, Real Private Residential Fixed Investment [PRFIC1], retrieved from FRED, Federal Reserve Bank of St. Louis, July 27, 2018.
International investment in U.S. real estate also delivered a big blow to the housing market data. According to the NAR: “International sales in the U.S. totaled $121 billion from April 2017 to March 2018, a 20 percent decline from a year ago.” Moreover, the share of sales to foreign buyers and recent immigrants dropped from 10% to 8%. For context, just 5 countries make up 49% of all sales to foreign buyers: China, Canada, India, Mexico, and the United Kingdom. Chinese nationals lead the way at a 6th straight year while buying the most expensive homes at a median price of $439,100. If existing trade war tensions remain high between the U.S. and China, I expect Chinese nationals to pull back further on U.S. real estate investments.
Perhaps U.S. first-time home buyers will pick up the slack. Freddie Mac reported earlier this month “First-Time Buyers Finally on the Rise.” The message from Freddie Mac runs a bit counter to the NAR’s despair over existing home sales data for these buyers that seems to bounce all over the place without a definitive trend:
“According to Freddie Mac’s first quarter mortgage data, first–time buyers represented 46 percent of its purchased loans, the largest share in recent history and up from 42 percent a year ago.”
Freddie Mac sees a large driver in the the swell of maturing millennials moving into household formation despite the existing headwinds.
This optimism matches Freddie Mac’s overall bullishness on the housing market. In its July update on its 2018 outlook, Freddie Mac delivered the following unwavering forecast:
“The pace of existing-home sales has been disappointing this year, as tight inventory conditions continue to suppress overall activity despite solid demand. Conversely, new home sales continue to rise, with homebuilders increasing production – albeit slowly. Our forecast for total home sales (new and existing) remains unchanged. We expect modest sales growth over the next two years, with 6.27 million sales in 2018 and 6.44 million in 2019.”
Even with strengthening sales, Freddie Mac thinks annual price growth will actually slow from 6.7% this year to 4.8% next year.
Time will of course tell very soon whether this important juncture of the housing market will lead to new bearish lows or will somehow turn around enough in time for the seasonally strong period starting in November. I finished adding to my off-season trades with the last Housing Market Review. I even took profits on my Redfin (RDFN) position as I suspect the stock will falter under the sheer weight of the declines in home builders stocks. The short side of my ITB calendar call spread expired worthless a week ago as I had hoped. Too bad the prospects for the long side of of the calendar spread are so poor…
Be careful out there!
Full disclosure: long ITB calls, long MTH calls, long PHM calls