
AT40 = 38.3% of stocks are trading above their respective 40-day moving averages (DMAs)
AT200 = 54.7% of stocks are trading above their respective 200DMAs
VIX = 17.3 (28.5% increase!)
Short-term Trading Call: bullish
Commentary
“We cannot tolerate pervasive and persistent misconduct at any bank and the consumers harmed by Wells Fargo expect that robust and comprehensive reforms will be put in place to make certain that the abuses do not occur again,” Chair Janet L. Yellen said. “The enforcement action we are taking today will ensure that Wells Fargo will not expand until it is able to do so safely and with the protections needed to manage all of its risks and protect its customers.” – Board of Governors of the Federal Reserve System, February 2, 2018
And with that disciplinary action, now former Fed Chair Janet Yellen went out in style. On her last day of work, Yellen oversaw the decision to announce a serious smackdown on Wells Fargo (WFC). This reminder of the Fed’s seriousness was quite appropriate for a day on which the market sold off amid a spike in long-term interest rates. The U.S. jobs report for January was strong once again with the added bonus of notably strong year-over-year wage growth of 2.9%. The prospect of a Fed that no longer supports market liquidity looms ever larger – making Yellen’s exit almost metaphorical.
Source: FreeStockCharts.com
The irony about an interest rate driven spook session is that anyone paying attention knows rates MUST keep going up the stronger the economy gets from here. We have been lulled to sleep, maybe even spoiled, by a slow growth, low rate economy. Yet, unemployment is essentially at rock bottom levels and more and more stimulus is being poured into the economy. Something has to give.
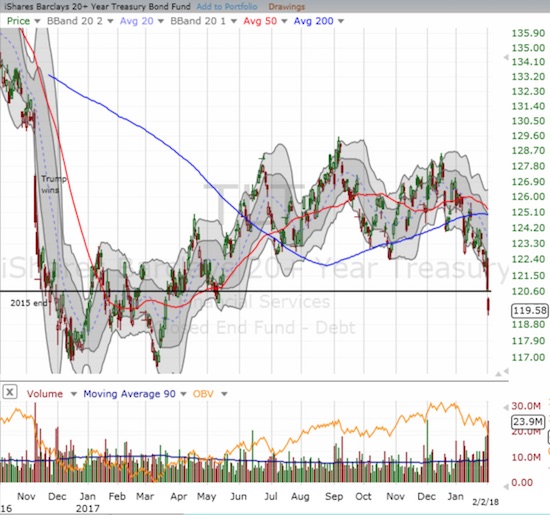
Having said that, I added some call options on TLT as a hedge. Bond yields have surprised in the past and have found other excuses for tumbling down. For example, if market participants get so worked up that they fear Fed rate hikes will trigger the next recession, long-term yields could come right back down.
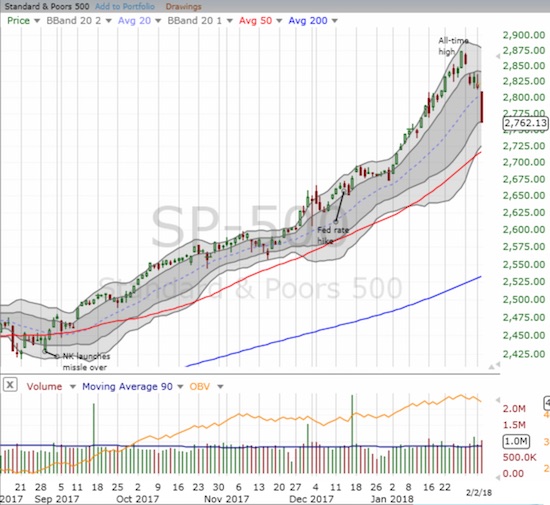
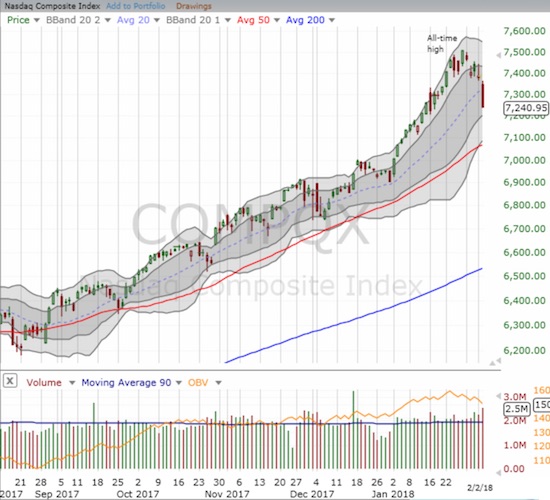
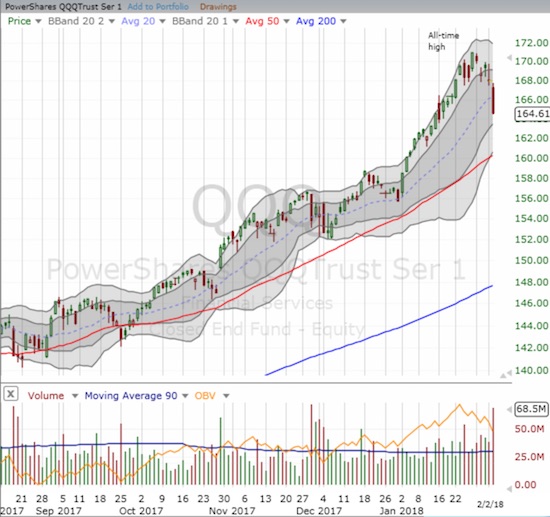
The spooking was enough to send the S&P 500 (SPY) down 2.1% and push the NASDAQ and the PowerShares QQQ ETF (QQQ) down 2.0%. For the S&P 500, the sell-off plunged the index right past its uptrending 20-day moving average (DMA) for the first time since last November. The sellers were actually so determined that the index closed at its low of the day. These were the biggest 1 and 2-day losses since September 9, 2016; the biggest 3-day loss since September 13, 2016; and the biggest 4 and 5-day losses since June 27, 2016.
So February could turn out to be the anti-January. Putting the angst over the current sell-off in perspective, note that January delivered a stunning 5.6% gain for the S&P 500. Many individual stocks soared to double-digit percentage gains. This hot money created a near parabolic run-up. Just a little more than half that gain has retraced. While January’s gain was not of historic proportions, it was on the far end of the historic spectrum. In the chart below, the x-axis represents the top of a 1% range: “5%” means 4% to 5%, inclusive of 5% and not 4%.
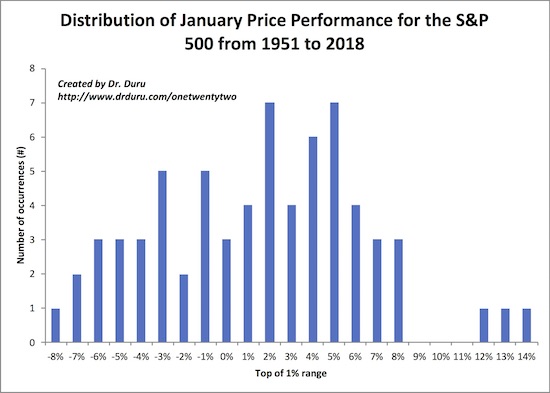
Source for data: Yahoo Finance
There is little historic reason to believe that February must retrace a big gain from January. In fact, after January delivers a gain over 5%, the historical odds slightly favor a positive February. Between -5% and 5%, there is essentially a 50/50 chance of a positive February. These relationships have nothing to do with the size of gains in the previous year either. I put together a bubble chart to show the three relationships. The bubble width represents the magnitude of the previous year’s performance. A white bubble is a negative year. The dotted diagonal line is a trendline.
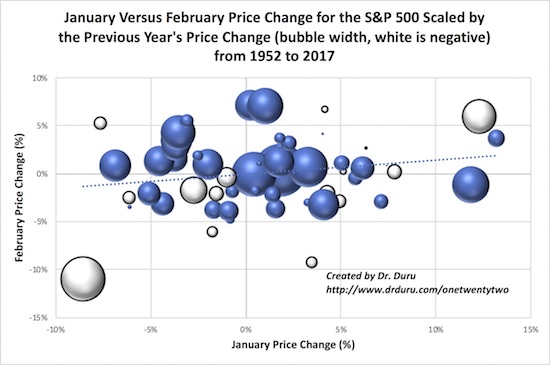
Source for data: Yahoo Finance
(Interested readers can download the Excel spreadsheet with the data, calculations, and charts here).
This pullback puts me back in a quandary over my trading strategy for overbought conditions. In recent years, I have slowed down my switch to a bearish posture once the S&P 500 exits an overbought condition. January’s strong price action in particular made me reluctant to switch quickly so I instead maintained a line in the sand at an important technical point: the low of January 10, 2018 where the market experienced a sudden, albeit small, pullback. One option for tightening up the rules is to continue ratcheting up the line as the market rallies, like a trailing stop. For example, I can set the line below the low of the last breakout IF the price action is exceptionally strong.
There is at least one caveat to the trailing stop approach: the window for bearishness would have a lower bound at an uptrending moving average line, most likely the 50DMA. Under ideal circumstances, a test of such support would occur at or near oversold conditions. As things stand now, the short-term trading call stays at bullish with a flip to bearish occurring below 2735. Given the proximity to the 50DMA, I will likely adjust the bull/bear divide to below the 50DMA. After that, the bearish window would likely be very tight with oversold conditions approaching.
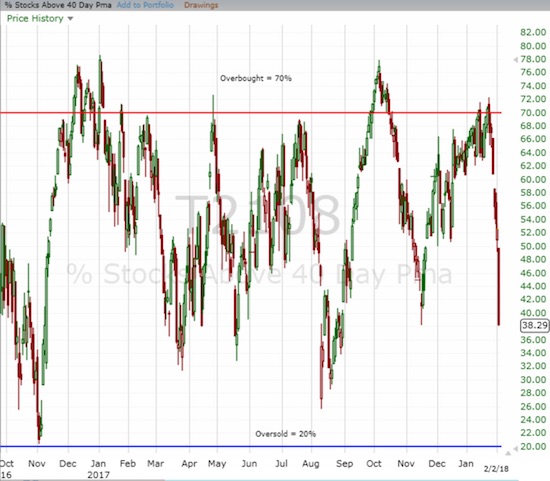
AT40 (T2108), the percentage of stocks trading above their respective 40DMAs, plunged on Friday in a resounding confirmation of the sudden appearance of broad-based selling pressure. AT40 fell 14 percentage points to 38.3%, its lowest close since August of last year. The last plunge was in November where the intraday low hit 38.1%. So, I am definitely on alert for a sharp bounce to ensue in the coming week. If the selling continues, I fully expect AT40 to race toward oversold conditions (below 20%) and thus further complicate the short-term trading call. I will cross that bridge when/if we get there.
The volatility index, the VIX, presented interesting challenges last week. I started the week afraid that I was over-eager in anticipating a spike in volatility. After the VIX did indeed spike, I quickly took profits and switched to fade volatility. On Thursday, the VIX plunged as low as 12.50. Instead of locking in profits again, I assumed that the jobs report would implode volatility further as one more item of uncertainty melted away. The impact was exactly the opposite as the VIX surged a whopping 28.5% and shattered the 15.35 pivot. However, even recent history shows that two extremely large volatility spikes in a week’s time are hard to sustain. So I doubled down on my ProShares Ultra VIX Short-Term Futures (UVXY) puts and added a ProShares Short VIX Short-Term Futures (SVXY) call to boot. I am bracing for a potential plunge on Monday morning to wash out more motivated sellers before the market regains its balance and begins a process of calming back down.
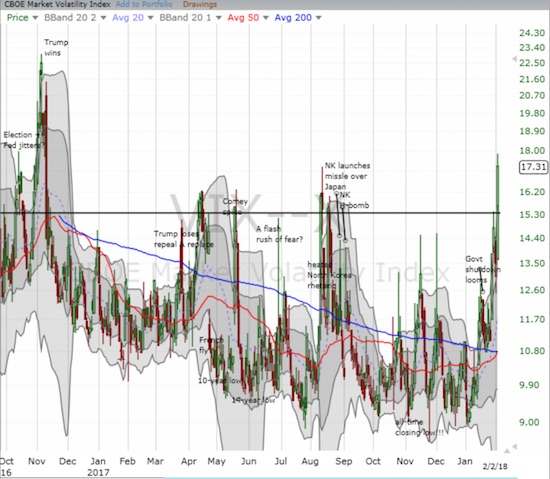
CHART REVIEWS
There are a LOT of fascinating charts in play now, far too many to sample here. I will be very active on SwingTradeBot trying to put some structure and organization to my search for the ripest opportunities. The charts below are just a sliver of the themes at the top of my mind.
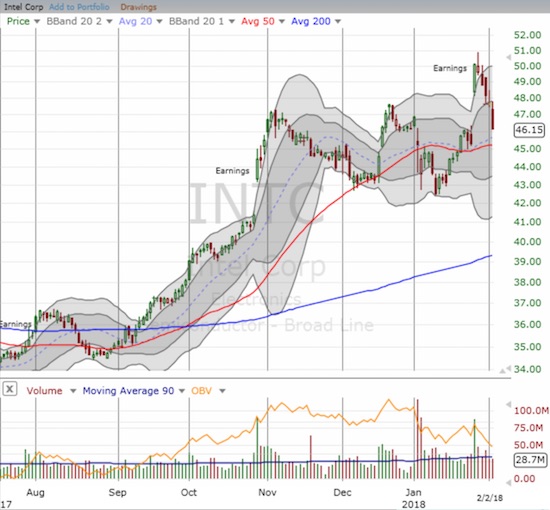
Intel (INTC)
I love to play INTC between earnings. The week’s sell-off has effectively closed the post-earnings gap that I missed. So INTC is at the top of my shopping list this week.
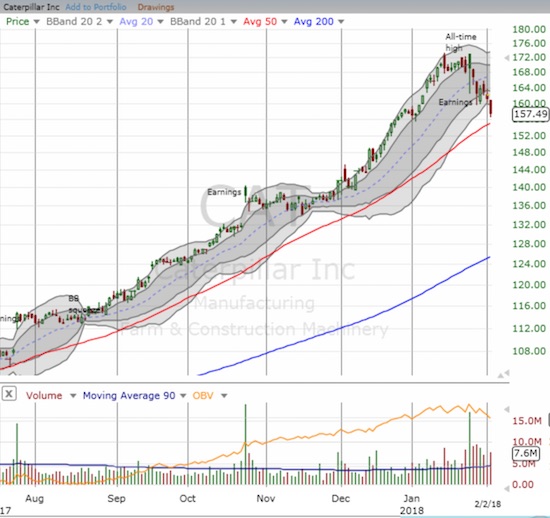
Caterpillar (CAT)
I chose a bad time to get long CAT. The stock now faces a critical test of 50DMA support. The next trade is simple. Survive the test, and I aggressively reload on the long side. Close below the 50DMA, and I aggressively get bearish for at least a hedge on any of my remaining bullish trading positions.
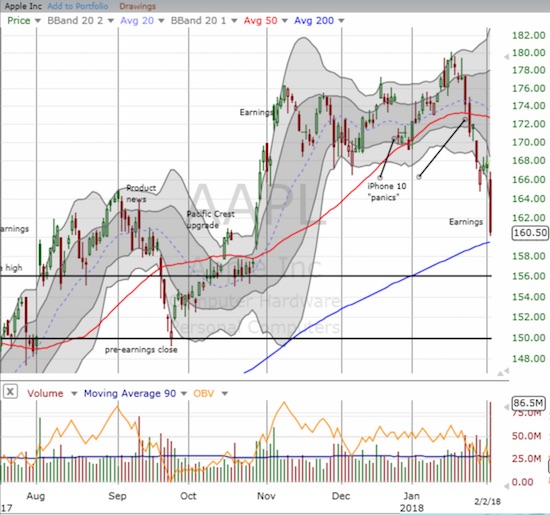
Apple (AAPL)
All eyes in tech should be on AAPL in the coming week. Analysts scrambled to downgrade AAPL ahead of earnings and an abiding sense of angst arose over iPhone X sales. The post-earnings response confirmed the new bearish mood. AAPL lost 4.3% in a move that looks like it confirmed a double top. Now only the 200DMA stands in the way of a complete swing to the bearish side of the ledger. I chose not to make my weekly play on AAPL this time even as I THINK AAPL is over-stretched well below its lower-Bollinger Band (BB) and primed for a relief bounce.
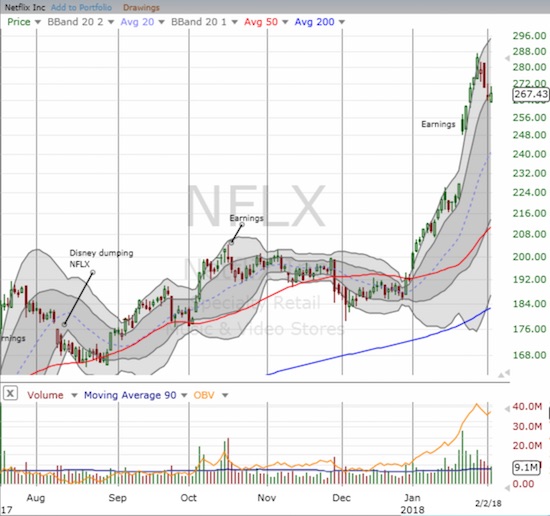
Netflix (NFLX)
NFLX stood out in Friday’s sell-off. The stock managed to gain 0.9% and traded over $270 at one point. The stock is clinging to its upper-BB trading channel and still sits on a substantial post-earnings gain. NFLX may be pointing the way to a rebound in tech stocks and the general market. From a momentum perspective, NFLX will be high on my shopping list almost no matter what happens to market sentiment this coming week.
Updates On Trading Action
I sold my put options on BHP Billiton (BHP). I took profits as BHP plunged a healthy 3.0%, and I wanted to cash in ahead of any relief rally. My thesis for a top in iron ore still stands but now I will focus on fading rallies.
I also took profits in my put options on Health Care Select Sector SPDR® ETF (XLV). I was prepared to hold the position over several weeks, but I thought Thursday’s action indicated the selling was already pausing. I missed out on Friday’s resumption of the selling pressure.
I finally sold my trading position in iPath® Bloomberg Cocoa SubTR ETN (NIB). I was relieved that NIB was able to hold its current breakout even as commodities in general fell under the pressures of higher rates and a stronger dollar. Yet, it made sense to take profits here before my good fortune turns. More on cocoa in a future post.
My disaster of the year looks like Impinj (PI). I failed twice to take profits on my post-earnings play and got caught in a disastrous 46.9% whooping on Friday as the company combined a disappointing earnings report with news of its long-time CFO’s departure. I think the selling is an over-reaction, so I am not selling into the panic. In fact, I added a small number of shares as pure speculation. =gulp=
Yellen Epilogue
In Janet Yellen’s “exit interview”, she admitted to disappointment over President Trump’s decision not to renominate her as Chair. Yellen became the first chair in “the modern era” not to get a renomination by the President. I admittedly was also disappointed (and a bit scandalized). Yellen did a great job and conducted herself admirably in the face of initial skepticism; she did everything and more to deserve a second term.
My appreciation for the Fed has greatly evolved since the days of Alan Greenspan when I regularly excoriated the Fed for creating conditions conducive to speculation and excess. Now, after Bernanke and Yellen, I have a much more measured opinion of the Fed’s work and role. Chair Yellen, I bid you farewell and wish you success in working with your old buddy Bernanke!
I congratulate Janet on her outstanding public service and look forward to being her colleague at the Brookings Institution https://t.co/kWuvQi2Qvx
— Ben Bernanke (@benbernanke) February 2, 2018
Oh yeah, speaking of Greenspan, he once again sees bubbles…in bonds and stocks…
— – —
FOLLOW Dr. Duru’s commentary on financial markets via email, StockTwits, Twitter, and even Instagram!
“Above the 40” uses the percentage of stocks trading above their respective 40-day moving averages (DMAs) to assess the technical health of the stock market and to identify extremes in market sentiment that are likely to reverse. Abbreviated as AT40, Above the 40 is an alternative label for “T2108” which was created by Worden. Learn more about T2108 on my T2108 Resource Page. AT200, or T2107, measures the percentage of stocks trading above their respective 200DMAs.
Active AT40 (T2108) periods: Day #485 over 20%, Day #299 over 30%, Day #99 over 40%, Day #47 over 50%, Day #1 under 60% (ending 37 days over 60%), Day #5 under 70%
Daily AT40 (T2108)
")
Black line: AT40 (T2108) (% measured on the right)
Red line: Overbought threshold (70%); Blue line: Oversold threshold (20%)
Weekly AT40 (T2108)

*All charts created using freestockcharts.com unless otherwise stated
The charts above are my LATEST updates independent of the date of this given AT40 post. For my latest AT40 post click here.
Related links:
The T2108 Resource Page
You can follow real-time T2108 commentary on twitter using the #T2108 or #AT40 hashtags. T2108-related trades and other trades are occasionally posted on twitter using the #120trade hashtag.
Be careful out there!
Full disclosure: long UVXY puts, long SVXY calls, long TLT calls, long CAT calls,
*Charting notes: FreeStockCharts.com uses midnight U.S. Eastern time as the close for currencies. Stock prices are not adjusted for dividends.