
Stock Market Commentary
A good friend of mine introduced me to the phrase – now we’re cooking with gas! In today’s context, this phrase refers to some startling developments in the rolling crash in the stock market. The technical damage was thorough, unrelenting, and nearly merciless. Chaos in economic policy chaos has fully transferred into stock market chaos. As a result, the week ended with market breadth down to levels last seen at the beginning of the pandemic. This rolling crash coincides with a stock market suffering its worst week since 2020. In other words, not even the selling during the 2022 bear market felt as brutal as it felt last week.
The market surprised me with its stubborn overoptimism about tariffs. Now I am also surprised that the selling in March failed to wash out all the motivated sellers who cared about tariffs. Granted, the market had some reason to cling to hope after Trump proclaimed “tariff flexibility“, but like so much policy of late, the meanings of words and actions are often hard to square. The rally into the tariff announcements set up this moment of tremendous disappointment and angst and panic.
In my previous post, I lamented the absence of bears and pessimism in the stock market feeds that I follow. My YouTube handlers must have heard my wonderment because today I received plenty of negative commentary. The intriguing piece below comes from BCA Research Chief Global Investment Strategist Peter Berezin, perhaps appropriately a Canadian, someone the Bloomberg Television host described as having “some physical and cultural distance from the group think that takes place in New York or Washington.” Brezin’s base case makes sense given what we know now. I am using this base case as an estimate of my downside risk scenario for the rolling crash in the S&P 500:
“4450 is actually not that dire. To get to 4450 all the S&P 500 needs to do is trade down to a forward P/E multiple of 18 and for earnings estimates to decline by around ten percentage points. The average P/E ratio between 2015 and 2019, a period which didn’t include a recession, a period which encompassed most of Trump’s first term, the average P/E ratio back then was 16.8. Now I’m talking about 18. Likewise, a 10% drop in earnings estimates. A typical recession is closer to 20%. So if anything, I might be too bullish”
This valuation case strikes a similar warning as the one I discussed using the Shiller P/E Ratio in my “Tariff Crash Trading Plan“. I read valuation through the lens of sentiment and technicals because analysts are prone to justify multiples with a wide variety of reasons. For example, the worse sentiment gets, the less the market is willing to pay for earnings and revenues, resulting in lower valuation multiples.
Note well that I am reviewing the bear case because I want to think soberly about trading through the oversold period. As long as current conditions persist, the market will likely sell rallies and will demand greater and greater discounts on risk assets.
Oh yeah. There was a job report for March! The market essentially did not care about it. Also, I think the selling took a break for 15-30 minutes while Federal Reserve Chair Jerome Powell delivered a speech.
The Stock Market Indices
S&P 500 (SPY)
The S&P 500 actually dropped 6% on Friday – 10% total in just two days. Absolutely mind-boggling. The conventional definition of a correction is a 10% drop off the all-time highs, and the S&P 500 accomplished a “correction” sized move in just two days. This grinding and steep descent is part of the rolling crash.
This rolling crash has rolled so fast that all of the sudden the index is staring down the barrel of a 20% sell-off from its all-time highs, the conventional definition of a bear market. I have been calling the bear market ever since the S&P 500 first dropped below its 200-day moving average (DMA) (the blue line). This whole episode is a great reminder of the usefulness of a faster signal for a bear market. I only wish I had followed my own signals more rigorously and was slower to trade for bounces. That is, I should have been looking for the reasons why and how this bear market could get worse beyond buying hedges.
Speaking of hedges, my “crash scenario” July SPY $520/$500 put spread went deep into the green today (very profitable). I dutifully took profits with the S&P 500 down a little over 3% given such a decline is extreme. Even as I type, I cannot believe how much money after the index proceeded to double its loss. Even my worst case scenario was not bad enough! Needless to say, I will buy a new crash scenario put spread during the next rally….hopefully at least a full reversal of Friday’s loss. At the same time I am dutifully accumulating SPY shares for my longer-term portfolio.
NASDAQ (COMPQ)
The NASDAQ opened Friday’s trading at the conventional definition of a bear market – 20% off all-time highs – and did not even pause before losing 5.8% on the day. The tech laden index is still not quite at 52-week lows, a great reminder of the market’s strength in the previous rally. With my previous downside target of 16,000 violated so thoroughly, I do not even want to contemplate how much worse things can get as a part of this bear market. In the meantime, I proceeded with my short-term AT50 trading strategy and bought a QQQ $450 calendar call spread. QQQ closed down 6.2% at $423. The price level of $450 sits inside the gap from today’s selling.
The iShares Russell 2000 ETF (IWM)
IWM plunged 4.7% and deepened its descent into a conventional bear market. Per my revised trading strategy on IWM, I did not reach for call options on today’s extreme selling. I will not likely open new short-term trades on IWM until it reconquers its bear market line.
The Short-Term Trading Call With A Rolling Crash
- AT50 (MMFI) = 9.3% of stocks are trading above their respective 50-day moving averages (Day #2 oversold)
- AT200 (MMTH) = 19.2% of stocks are trading above their respective 200-day moving averages
- Short-term Trading Call: bullish
AT50 (MMFI), the percentage of stocks trading above their 50-day moving averages, plunged 10 percentage points to 9.3%. This was a dramatic and historic plunge deeper into oversold territory. AT200 (MMTH), the percentage of stocks above their 200DMA, continued its march to my worst case scenario. This indicator of longer-term health in market breadth zipped right by its 2023 lows and is reaching for its 2022 lows. I am not ready to contemplate a break of the 2022 lows with the pandemic lows in play.
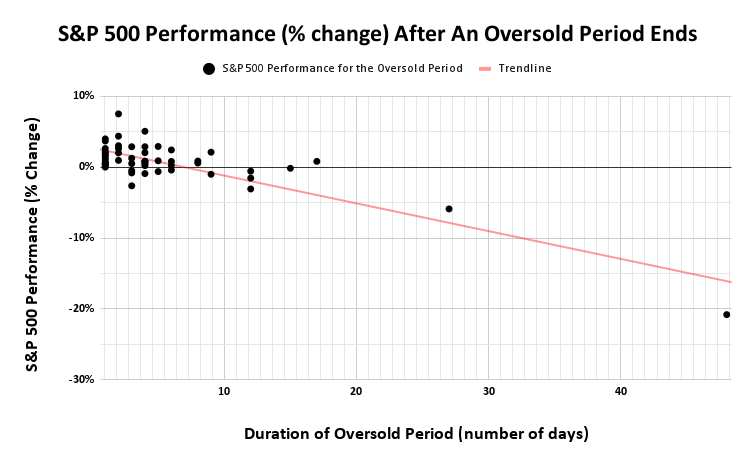
The chart below shows the approximate decline in prospects the longer an oversold period lasts. The red line is a simple trend line that approximates the relationship between the duration of the oversold period and the performance of the S&P 500 from the beginning to the end of the oversold period. Also notice that the majority of oversold periods last no more than 4 days; these short durations explain why I like aggressively buying in during oversold periods. (Each black dot below represents a specific oversold period). This time around I am conditioning my aggressiveness on the behavior of the VIX.
On Friday, the volatility index (VIX) flashed signals for the rolling crash by soaring a whopping 50.9% to 45.3. Now I am bracing for a retest of the extreme intraday high from last summer. Per the AT50 trading rules, I am still waiting for a VIX plunge before executing aggressively on my short-term bullish trading call. In the meantime, I added a VXX put option…just in case peace breaks out over the weekend.
Jim Cramer made a special appearance on CNN with his former CNBC colleague Erin Burnett. An “I feel like a sucker” teaser pulled me in. Cramer lamented that, as a far trade advocate, he believed Trump had a real formula to establish an even playing field for international trade. Cramer also believed Trump had a functional plan for restoring the economic fortunes of communities devastated by global trade. His disbelief over what happened in reality says a lot about the stock market’s tariff crash.
The Equities: In A Rolling Crash
The honeymoon in SPDR DJ Euro STOXX 50 ETF (FEZ) is already over. I should have worried when I saw pundits using charts like FEZ to demonstrate that the market was not worried about the economic fallout of tariffs (and thus no one else need worry about tariffs). Markets sure are worried now!
I do not plan to add more shares of FEZ during this sell-off. FEZ confirmed a 50DMA (the red line) breakdown and sliced through 200DMA support to a 6.2% loss on the day. Just like that FEZ is in a bear market.
iShares China Large Cap ETF (FXI)
I bet the iShares China Large Cap ETF (FXI) also provided hope that the economic warfare over tariffs would not cause damage. FXI even outperformed on Thursday with just a 0.9% loss and held 50DMA support. I find it very ironic, even puzzling, that Chinese stocks sold off only after China decided to retaliate with its own massive tariff hike.
SPDR Gold Trust
Last week was momentous for me and gold. After being a 15+ year permabull on gold, I finally took profits on my core SPDR Gold Trust (GLD) position. I did not like the way GLD gapped down along with the market on Thursday. I expected the exact opposite: a large gap higher. Thus, with gold not acting “right”, I decided to just close out the position; it seems GLD will no longer serve my purpose. Friday’s follow-up gap down and 2.3% loss seems to validate my concerns. I still have my May $285/$295 call spread in play. I will also buy back into gold using Sprott Physical Gold Trust ETV (PHYS) the next time gold sells off to important support like the uptrending 200DMA. Buying physical gold is a bit more secure than GLD which does not guarantee a match with physical gold.
Apple (AAPL)
I was tempted to buy AAPL on Thursday given its mind-boggling 9.3% drop. Temptation overtook me with AAPL down another 7.3% on Friday and closing well below its lower Bollinger Band (BB). I bought a diagonal calendar spread across the $202.50/$205 strikes for a very low risk albeit low reward nibble on AAPL. Note that the gains from last summer’s WDC are now gone with AAPL closing near a 52-week low. Chinese retaliation against the U.S. sets up souring relations for AAPL in China.
Best Buy Co, Inc (BBY)
I also gave into temptation on electronics retailer Best Buy Co, Inc (BBY). I fortuitously sold an April $55 put option near the lows of the day. The weekly chart shows just how close BBY trades to its pandemic low. This plunge looks well overdone.
Avis Budget Group, Inc. (CAR)
After Avis Budget Group, Inc (CAR) rallied on auto tariffs, I warned that this move seemed out of place. As planned, I faded the rally with a put spread. CAR failed right at 50DMA resistance, and on Friday fell as much as 14.3% before rallying sharply intraday for a 4.7% loss on the day. I took profits on my put spread as CAR crossed its 20DMA and got “close enough” to reversing its post-tariff surge. I still want to fade rallies in CAR. This trade also reminded me to take resistance levels very seriously during this bear market.
Caterpillar, Inc (CAT)
I chased CAT down Thursday to create a fresh hedge – a calendar put spread at the $300 strike. The hedge was mispositioned, and I was very fortunate to exit with a small profit after CAT gapped down to a 14+ month low. A put spread would have worked far better. As with so many of the week’s extreme moves, I just could not imagine CAT collapsing a second day in a row.
MP Materials Corp (MP)
Rare earths company MP Materials (MP) finally broke down with a bearish engulfing pattern and closed below its 50DMA. I am now not so interested in buying MP given the selling could just be in the early stages.
Nike, Inc (NKE)
NKE triggered a +3% price alert and sent me scrambling. I chased the stock with shares and a call option. I thought I was an instant genius as NKE got as high as 5% up even as the stock market kept collapsing. Turns out NKE was rallying on positive tariff news from Vietnam where Nike manufacturers a lot (most?) of its shoes. NKE looks like a green shoot with a bullish engulfing type of bottom.
Okta, Inc (OKTA)
OKTA completely collapsed from its post-earnings euphoria. Friday’s 8.3% plunge confirmed a 50DMA breakdown but buyers defended 200DMA support. OKTA is a stock that has been thrown out with the bathwater, so it is high on my buy list in the coming week. My current call spread is toast, and I will move on to buying shares for a longer swing trade.
PVH Corp (PVH)
Clothing company PVH dropped 15%, practically reversing all of its recent earnings gains. The move ended a promising 50DMA breakout that confirmed the bullish tidings from earnings. I assume Friday’s outperformance and 3.2% gain came from hopes of a deal with Vietnam and perhaps other foreign sources of clothing.
Oracle Corporation (ORCL)
ORCL gapped down below its post-earnings intraday close which coincided with the September pre-earnings close. The stock sliced through this tidy connection with a gap down and a 6.5% loss. ORCL closed with a test of the August low.
Twilio (TWLO)
Digital communications software platform TWLO finally joined the many stocks trading below their 200DMAs. Friday’s 6.7% loss now makes TWLO look like it enjoyed an astounding bubble of enthusiasm following October earnings. The stock is also more than 40% off its last highs. Needless to say, I am no longer itching to get back into TWLO.
Amplify ETF Trust Cybersecurity ETF (HACK)
HACK broke down below its 200DMA. I was tempted to add more shares to my longer-term portfolio because this rolling crash looks like another baby thrown out with the bath water situation. Still, for HACK, I am content to wait for deeper oversold conditions if they come given my eye on cybersecurity software company OKTA.
Renaissance IPO ETF (IPO)
IPO plunged 7.5%, back to November 2023 levels. I took this opportunity to add more shares. The IPO market will of course freeze up in this environment (several companies postponed IPOs last week). Still, I am looking forward to the era when IPO gets a turbo-boost from AI-related new public offerings. Year-to-date IPO is performing just as badly as ARKK unlike previous periods when IPO offered lower downside risk for speculation on innovation.
ARK Innovation ETF (ARKK)
I added to my shares in ARKK. I did not think ARKK would return to these levels, so my holding is also growing larger than I expected. Given my growing commitment to this speculative ETF, I took a look at Cathie Wood’s latest commentary, this one covering the current economic chaos.
Watching Cathie Wood try to rationalize what is going on made me worry a little bit more that Wood and company will not figure out how to turn around this ship. After acknowledging that Trump’s tariff calculations did not make sense she went on to say: “We know that Trump wants a legacy presidency. Trump wants to be one of the greatest presidents ever. That’s his objective, and he’s not going to get there by throwing the economy and into a recession and the stock market into a bear market, and we’re on the verge of both of those now. So we’re getting close to the line in the sand where I think his negotiations will kick into gear and will be more productive than what we’ve heard recently. So that’s the bet, and it’s logical if we understand who President Trump is.”
I think Wood understands what she hopes Trump is, but this is a very poor foundation to build an investment thesis. Something tells me EVERY president wants to be a legacy president, the best and greatest ever. That desire has not turned America into a country of sequentially improving greatness. Success takes a lot more than talking about it or saying one thing and doing another.
Fortunately, Wood saved herself a little by returning to acknowledging what has gone so wrong (emphasis mine): “I know that President Trump wrote the Art of the Deal, and I know that throwing things into chaos is part of striking deals and getting to better outcomes. But I do feel, and the markets do feel, that President Trump might be playing with fire here.” The fire is raging and “playtime” is in full swing!
Wood also issued a warning: “we know President Trump has said that he and his team are talking to many many nations, but you’ll notice each time that he does come out and say something about the tariffs, he will quickly follow up with we’re moving into one of the strongest economies with one of the best stock markets, and everyone’s going to get wealthy. Well, words are going to start to ring hollow unless these negotiations bear fruit.” Exactly. But I am not one counting on successful negotiations given the deep acrimony and mistrust that has been sown across the globe.
Informatica (INFA)
While I added to some long-term positions, I severed my relationship with some of my weakest stocks. For example, I sold INFA as a “no regret” sale. The quality of this decision does not depend on what the stock does afterward, only on the rationale I hold now. Given what I know and see now, INFA is the kind of company and stock that may not survive this economic chaos. I would rather move this money elsewhere. It was a hard decision because I was quite convicted on buying and holding INFA.
Vertiv Holdings, LLC (VRT)
With the benefit of hindsight, DeepSeek was an early warning signal on coming weakness for VRT, one of my favorite AI plays. Fortunately, at the time, I had already taken profits late in 2024 as the uptrend weakened. After VRT rebounded from DeepSeek, the stock failed perfectly at converged 50DMA and 20DMA (the dotted line) resistance. The 200DMA breakdown put VRT in bear market territory, and so I waited longer.
I started rebuilding my position by selling a put option. After the shares were put to me, I failed to sell a call against the position, as planned, as the stock rebounded. I sold another put at the end of the previous week. That put was deeply profitable just ahead of the tariff crash. Since I decided to keep holding the position, I now have a sizeable position in VRT. I think in due time this investment will pay off very well. However, in the meantime, this volatility will be difficult to stomach. Next “natural” support does not come until around $36. VRT has rolled from an easy uptrend to a shaky hold.
Be careful out there!
Footnotes
Subscribe for free to get email notifications of future posts!
“Above the 50” (AT50) uses the percentage of stocks trading above their respective 50-day moving averages (DMAs) to measure breadth in the stock market. Breadth defines the distribution of participation in a rally or sell-off. As a result, AT50 identifies extremes in market sentiment that are likely to reverse. Above the 50 is my alternative name for “MMFI” which is a symbol TradingView.com and other chart vendors use for this breadth indicator. Learn more about AT50 on my Market Breadth Resource Page. AT200, or MMTH, measures the percentage of stocks trading above their respective 200DMAs.
Active AT50 (MMFI) periods: Day #2 under 20% (oversold), Day #8 under 30%, Day #27 under 40%, Day #39 under 50%, Day #66 under 60%, Day #167 under 70%
Source for charts unless otherwise noted: TradingView.com
Full disclosure: long SPY shares, long QQQ calendar call spread, long IWM call, long VXX puts, long FEZ, long AAPL call spread, long NKE shares and call option, long OKTA call spread, long ORCL call spread, long HACK, long IPO, long ARKK, long VRT, short BBY put
FOLLOW Dr. Duru’s commentary on financial markets via StockTwits, BlueSky, and even Instagram!
*Charting notes: Stock prices are not adjusted for dividends. Candlestick charts use hollow bodies: open candles indicate a close higher than the open, filled candles indicate an open higher than the close.
* Blog notes: this blog was written based on the heavily edited transcript of the following video that includes a live review of the stock charts featured in this post. I used ChatGPT to process the transcript.