

Housing Market Intro and Summary
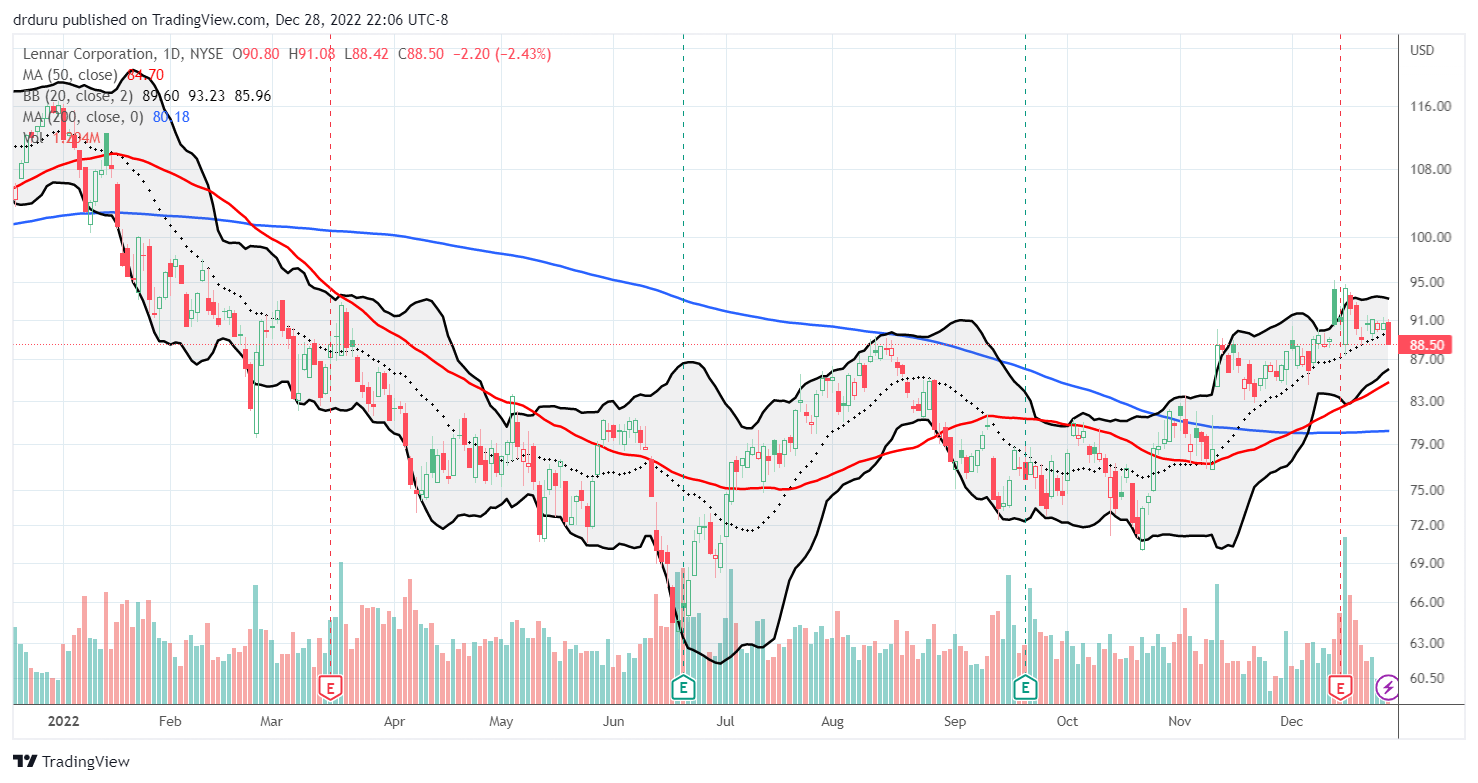
A continued respite from rising rates gave some breathing room for new home sales to stabilize in November while existing home sales continued to plunge with a dearth of inventory helping to suck air out of the room. Housing starts continued to plunge in parallel with home builder sentiment. However, faint signs of a bottoming for sentiment have started to appear. Home builders have successfully used incentives to keep inventory moving since the summer. This feat has likely started to add a modicum of confidence to some builders. For example, major home builders like Lennar (LEN) delivered relatively bullish earnings reports in recent weeks while promising to navigate the inflationary market environment with masterful precision.
With the Federal Reserve likely ending its rate hikes sometime early in 2023, forecasters are looking forward to some kind of rebound for the housing market in the back half of 2023. Freddie Mac’s last forecast pegged a 13.8% drop in home sales for 2023 following a 15.9% decline in 2022. Freddie Mac is clinging to flat prices for 2023. The October forecast was a significant downgrade from the July forecast as soaring rates forced more pessimism into the outlook. The strong dependency on interest rate volatility means that bracing for 2023 includes leaning where the Fed leads.
The housing reality check is unfolding in parallel with a resilient and robust labor market. This divergence is unusual as conventional wisdom declares as employment goes so goes the housing market. As a result, the labor market is a big wildcard for housing in 2023. The Federal Reserve anticipates a higher unemployment rate next year. So will more and more bad news from employers undermine the ability of the housing market to stabilize? Builders, buyers, and sellers alike will be bracing for what the labor market brings in 2023.
Housing Stocks
At the time of writing, the iShares US Home Construction ETF (ITB) is down 2.0% month-to-date following an 8.2% jump in November. The seasonal trade on homebuilders is truly back to performing as expected as ITB has outperformed the S&P 500’s (SPY) 5.4% gain in November and 7.3% month-to-date loss. I expect this out-performance to continue through the duration of the seasonal trade. I continue to hold ITB shares while I made sure to take profits on a call option position. The current dip in ITB offers a chance to replenish the seasonal trade some time in January.
")
Last month D.R. Horton (DHI) injected a heavy dose of optimism in home builder stocks. The latest strong earnings performance came from Lennar (LEN). LEN jumped from a loss to a 3.8% gain after reporting earnings. Unfortunately, the stock was unable to make any further gains and is now negative since reporting earnings. DHI is still firmly post-earnings positive, so LEN and other builders are likely riding on earlier enthusiasm.
Housing Data
New Residential Construction (Single-Family Housing Starts) – November, 2022
Housing starts reached another pandemic era low (excluding the plunge in the early months of the pandemic). Starts decreased 4.1% month-over-month to 828,000. Starts decreased 32.1% year-over-year. October’s starts were revised upward to 863,000. The looming test of the 800K level is looking more precarious with momentum headed so fast downward. A continued descent for home builder sentiment will drag starts to, and maybe through, the 800K level.
![Source: US. Bureau of the Census, Privately Owned Housing Starts: 1-Unit Structures [HOUST1F], first retrieved from FRED, Federal Reserve Bank of St. Louis, December 27, 2022.](https://drduru.com/onetwentytwo/wp-content/uploads/2022/12/221227_Housing-Starts.png "Housing starts")
Housing starts declined year-over-year in every region. However, the Northeast and the West actually enjoyed monthly gains in starts. The West region’s starts bounced away from the pandemic lows. Housing starts in the Northeast, Midwest, South, and West each changed -3.2%, -29.9%, -36.6%, and -35.7% respectively year-over-year.
Existing Home Sales – November, 2022
The slowing housing market continues to deliver little (aggregate) price relief in the market for existing homes. Absolute inventory even contracted for the fourth month in a row. Both buyers and sellers continue to retreat from the market.
Existing home sales dropped for a tenth month in a row. The drop maintained the steep, downward pace that dominated 2022. The seasonally adjusted annualized sales in November of 4.43M decreased 7.7% month-over-month from the unrevised 4.43M in existing sales for October. Year-over-year sales decreased 35.4%. Sales dropped further below the pre-pandemic existing home sales activity between 5.0M to 5.5M in 2019 and 2018. Sales were last this low in 2012 excluding the crash at the onset of the pandemic.

(For historical data from 1999 to 2014, click here. For historical data from 2014 to 2018, click here) Source for chart: National Association of Realtors, Existing Home Sales© [EXHOSLUSM495S], retrieved from FRED, Federal Reserve Bank of St. Louis, December 27, 2022.

November’s absolute inventory level of 1.14M homes decreased 6.6% from October and increased 2.7% year-over-year. According to the NAR, “unsold inventory sits at a 3.3-month supply at the current sales pace, which was identical to October, but up from 2.1 months in November 2021.” The on-going tightness in inventory creates a housing recession where both buyers and sellers are waning.
Despite the drop in inventories, the time it took for buyers to take a home off the market increased. The average 24 days it took to sell a home in November was 3 days above the 21 days in October and up from 18 days a year ago. The 61% of homes that sold within one month represents an on-going decline from the 64% in October, 70% in September and 81% in August. Buyers are less and less enthused by what is left for sale.
Prices continue to creep sequentially downward. The median price of an existing home decreased 2.1% month-over-month to $370,700 and increased 3.5% year-over-year. Prices have risen year-over-year for 129 straight months, an on-going record streak. If current trends sustain, then March or April of 2023 should finally break this amazing streak.
The sequential price decline once again failed to stir incremental interest in first-time home buyers. Their share of sales remained steady at 28% but up from 26% a year ago. The NAR’s 2017 Profile of Home Buyers and Sellers reported an average of 34% for 2017, 33% for 2018, 33% for 2019, 31% for 2020, 34% for 2021, and 26% for 2022. The share for 2022 is the lowest on record for the NAR (the number must include revisions as I do not recall many readings below 26% over the past year).
All regions declined significantly in sales year-over-year with the two biggest regions yet again suffering the largest percentage losses. The regional year-over-year changes were: Northeast -28.4%, Midwest -30.6%, South -35.0%, West -45.7%. Each region also suffered month-over-month declines.
Each region continues to experience a slowing in the pace of year-over-year gains in the median sales price. The West has the most notable slowdown in pace. The regional year-over-year price gains were as follows: Northeast +3.5%, Midwest +3.9%, South +4.4%, West +2.0%.
Single-family existing home sales decreased 7.6% from September and declined on a yearly basis by 37.1%. Per the above graph, sales for existing single-family homes finally broke below the pandemic low set in May. The median price of $376,700 was up 3.2% year-over-year.
California Existing Home Sales – November, 2022
This leading paragraph from the California Association of Realtors (C.A.R.) encapsulates the challenges facing the California housing market for existing homes:
“Housing demand in California continued to fall as rising interest rates further dampened the state’s housing market in November as home sales registered the lowest annualized pace since October 2007 and the largest year-over-year sales drop in at least the past four decades.”
The sales declines were broad-based for the third month in a row with all price segments suffering over 40% year-over-year losses. In September, homes priced below $300K fell the most. In October, homes priced between $750,000 and $999,999 fell the most at 40.8% year-over-year. For November, homes priced over $2M fell the most at 47.7%. Overall state sales of existing single-family homes fell 13.2% from October to 237,740. Sales fell a whopping 47.7% year-over-year, a 17th straight month of year-over-year declines in California.
California’s median sales price finally crossed the negative year-over-year mark for the first time in 30 months. Prices fell 0.6% year-over-year and down 3.0% from October for the third monthly price decline in a row. The year-over-year price decline on a square footage basis was just $393 to $392 for a 0.3% drop.
Bidding wars were rapidly fading from California’s market before October’s apparent pause in the trend. The statewide sales-price-to-list-price ratio stayed below 100.0% for the fourth month in a row and looks set to remain there for the duration of the housing market recession. This ratio dropped to 96.7% in November from 97.3% in October and 101.4% a year ago. The median time to sell a home in California increased from 19 days in August to 22 in September to 24 in October. The duration held steady in November at 24 days. The duration was just 11 days last year October and November.
Inventory held steady from October’s 3.3 months for the Unsold Inventory Index (UII). The UII was 1.6 a year ago (and 1.8 a year ago October). The broad-based decline in sales translated into broad-based increases in inventory (year-over-year). Per the C.A.R., “all price ranges posted an increase in their UII from a year ago by 88 percent or more, with unsold inventory in the $1 million+ price range rising the most (128.6 percent).” C.A.R. did not provide an aggregate change in active listings for the state. Forty-six of 51 counties experienced an increase in active listings (compare to 47 in October).
In the October report, C.A.R. President Jennifer Branchini projected that “…the market bottom could be in sight.” For November, C.A.R. Vice President and Chief Economist Jordan Levine added a little bit of data to point toward support for this optimism: “…pending sales suggest that the pace of declines should moderate in the coming months.”
New Residential Sales (Single-Family) – November, 2022
New home sales delivered another respite from the bad news in the housing market. In fact, new home sales have actually stabilized since the summer as home builders have acted fast to move inventory.
November new single-family home sales of 640,000 were up an impressive 5.8% from October’s 605,000 (revised down from 632,000). Sales were still down 15.3% year-over-year. The key support at 550,000 in sales continues to hold.
![Source: US. Bureau of the Census, New One Family Houses Sold: United States [HSN1F], first retrieved from FRED, Federal Reserve Bank of St. Louis, December 28, 2022](https://drduru.com/onetwentytwo/wp-content/uploads/2022/12/20221228_New-Home-Sales.png "new home sales")
A large shift in sales out of the 2nd to lowest and 2nd to highest price tiers helped drive the median price for a new single-family home 2.8% off the all-time high to $471,200. The $500,000 to $749,999 price range, the 2nd highest tier, came down hard from October’s all-time high of a 33% share to November’s 24% share of sales. That jump now looks like an aberration or outlier. The overall trend for the median sales price remains straight up from the pandemic trough.
The sequential sales increase took inventory down slightly from 8.9 months of sales in October to 8.6 months in October. The market is over-supplied given it sits above the 6.0 level that is the benchmark for a balanced market. It seems ample inventory is key to sales volumes given the on-going sales downtrend in the market for existing homes.
The year-over-year decline in sales was led by the West and South while the Northeast and the Midwest enjoyed year-over-year gains. The Northeast, Midwest, South, and the West changed +26.5%, +3.6%, -15.0%, and -26.6% respectively. Despite its large year-over-year decline, the West led the sequential increase in sales with a 27.6% gain. The Midwest had a 21.3% month-over-month gain.
The Northeast’s October follow-through for new home sales was stunning. November sales came off the October level slightly, so more time is needed to see whether the Northeast is experiencing a temporary buzz in buying activity. In my last Housing Market Review I concluded that the rebound would go no higher for now.
Home Builder Confidence: The Housing Market Index – December, 2022
The National Association of Home Builders (NAHB)/Wells Fargo Housing Market Index (HMI) dropped for the twelfth straight month, marking a full year of declines for home builder confidence. December’s drop to 31 plunged the HMI ever deeper into the housing reality check. Excluding the trough of the pandemic, the HMI was last this low in June, 2012, near the trough of the last housing recession.
The National Association of Builders (NAHB) tried to take some solace in the small, absolute size of the drop and declared a bottom in sentiment may finally be near. Given the size and speed of the plunge in sentiment, an imminent bottom seems likely. An apparent peak in mortgage rates also makes such a bottom much more likely. Of course, sentiment may remain stuck at low levels for the duration of the Federal Reserve’s monetary tightening. The NAHB estimates it will take over a year for the housing market to begin a recovery:
“NAHB is expecting weaker housing conditions to persist in 2023 and we forecast a recovery coming in 2024, given the existing nationwide housing deficit of 1.5 million units and future, lower mortgage rates anticipated with the Fed easing monetary policy in 2024.”
Consumer sentiment has sharply diverged from builder sentiment since the bottom in consumer sentiment in June. That bottom neatly coincided with a top in gasoline prices. Clearly, consumers care more about filling the tank than buying their next house! The upshot of this news is that buoyancy in consumer sentiment should eventually bleed out to builders given the two sentiment figures rarely diverge for long.
Source for data: NAHB and the University of Michigan
An overlay with the HMI components shows that the traffic of prospective buyers is leading sentiment straight down. However, perhaps ironically, it is the one HMI component that has not yet matched or undercut its pandemic low. This small positive signal adds weight to the claim that overall HMI sentiment will likely bottom soon. Moreover, the SF (single-family) detached next six months actually increased 4 points. It is the first increase since April and only the second increase since HMI started its plunge.
The National Association of Home Builders (NAHB) identified familiar woes for builders: “In this high inflation, high mortgage rate environment, builders are struggling to keep housing affordable for home buyers.” Price concessions are adding to builder stress. The December HMI showed an increase from 59% to 62% of builders using incentives to motivate sales. However, builders have to hold the line on prices because of soaring construction costs which are now up 30% since start of the year:
“Only 35% of builders reduced homes prices in December, edging down from 36% in November. The average price reduction was 8%, up from 5% or 6% earlier in the year.”
The South was the only region to experience a month-over-month increase in its HMI. The Northeast held steady at 32. The Midwest plunged from 35 to 30. The West dropped from 28 to 25. If a bottom in builder sentiment is imminent, the South must be the region that will lead the way to stabilization.
Home closing thoughts
Non-Starter Homes
Point2 identified just 4 large U.S. cities (Detroit; Tulsa, OK; Memphis, TN; Oklahoma City) where households earned 100% or more of what they need to afford an entry-level home. This list included Kansas City, MO a month ago and Baltimore, MD two months ago. Point2 blamed competition for dwindling inventory from “downsizing baby boomers, second homebuyers and property investors” for helping to drive up housing prices. Rising mortgage rates also featured prominently in this dynamic.
These affordability issues could come to a head in 2023. The market and politicians may be bracing for the fallout of a stubbornly persistent scarcity in starter homes.
Spotlight on Mortgage Rates
Last month, mortgage rates made big headlines after making their largest one-day plunge on record (since 2009). The 30-year fixed mortgage rate has continued to decline from there. The decline has been steep enough to take the mortgage rate down to 6.3% which matches Freddie Mac’s October forecast for the mortgage rate at the end of 2023! During December, the Mortgage Bankers Association (MBA) reported two of three weeks with weekly increases in mortgage applications. In the last Housing Market Review, I claimed “if rates even stop going up from here, home buyers could surprise everyone as they enjoy the respite in the rate environment.” The apparent stabilization in new home sales is a part of that surprise.
The MBA offered up the following forecast in its latest mortgage application report. The timing looks consistent with industry expectations but will likely get revised negatively given commentary from the NAHB:
“The latest data on the housing market show that homebuilders are pulling back the pace of new construction in response to low levels of traffic, and we expect this weakness in demand will persist in 2023, as the U.S. is likely to enter a recession. However, if mortgage rates continue to trend down, as we are forecasting, more buyers are likely to return to the market later in the year, as affordability improves with both lower rates and slower home-price growth.”
![Sources include: Board of Governors of the Federal Reserve System (US), Market Yield on U.S. Treasury Securities at 30-Year Constant Maturity [DGS30], retrieved from FRED, Federal Reserve Bank of St. Louis and Freddie Mac, 30-Year Fixed Rate Mortgage Average in the United States [MORTGAGE30US], retrieved from FRED, Federal Reserve Bank of St. Louis, December 28, 2022](https://drduru.com/onetwentytwo/wp-content/uploads/2022/12/20221228_30-Year-Fixed-Rate-Mortgage-Average.png)
Be careful out there!
Full disclosure: long ITB shares and call spread