
Housing Market Intro/Summary
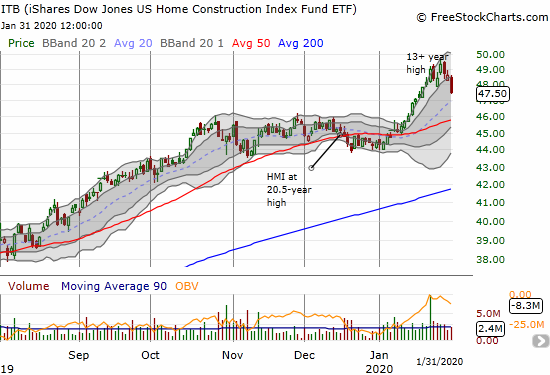
{Note a rough draft of this post was inadvertently posted on January 20, 2020} When I wrote the Housing Market Review for December, I described a “precarious” divergence between the performance of the iShares US Home Construction (ITB) and the S&P 500 (SPY). In late December, dour commentary from JP Morgan (JPM) about home builders seemed to add credence to the notion of trouble for the stocks of builders.
January delivered such a dramatic turn-around that I was compelled to write “Animal Spirits Rediscover Housing-Related Stocks” with ITB breaking out to a fresh 13-year high. The exuberance from animal spirits carried ITB further from there, but the current market sell-off is weighing on builders. The selling brought ITB’s rally to a screeching halt. ITB looks set to start a new period of churn.
The latest round of earnings reports from home builders have delivered mixed responses. Builders reported in the first half of January fared a lot better than those reporting in the last week. I have a lot of sorting to do, but the stock charts say a LOT.
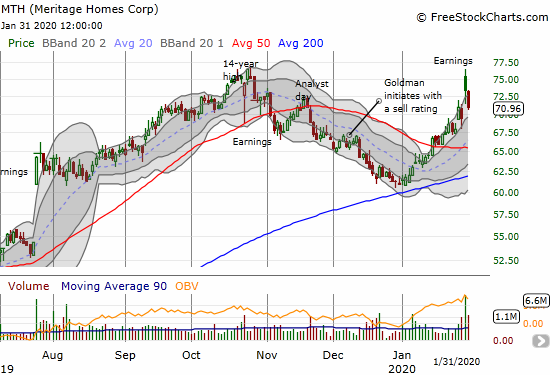
Meritage Homes (MTH) achieved an important turn-around just as the animal spirits were taking over. I put the stock on my buy list ahead of earnings. That trade worked out well, and I was able to sell my call option into an initial 8% post-earnings gain. The stock soon faded and the very next day it lost another 3.3%. The uptrend from support at the 200-day moving average (DMA) remains intact, but I expect MTH to succumb to sustained selling pressure in the general stock market. Note how the stock topped out right at its October and 14-year high.
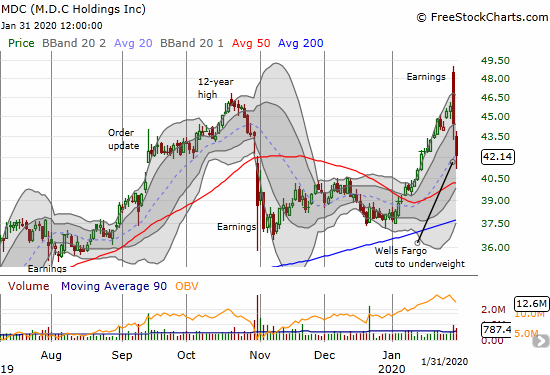
M.D.C Holdings (MDC) sufered an even more dramatic post-earnings reversal than MTH did. MDC initially gapped up for a 5.9% gain to a near 13-year high. The stock closed with a 3.0% loss. Sellers took out another 5.2% the next day as Wells Fargo downgraded the stock to “underweight.” As a reminder, I am particularly interested in MDC because it led last summer’s breakout among builders. Now MDC looks like it wants to announce a top!
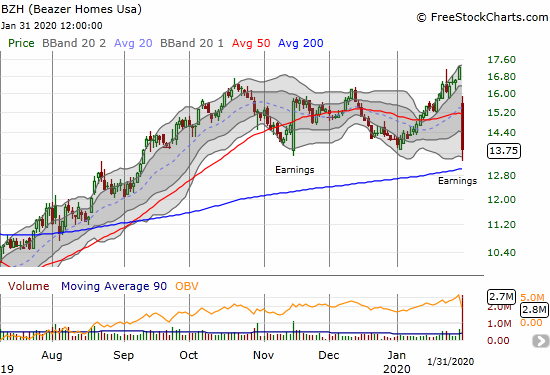
Beazer Homes (BZH) suffered an outright breakdown following its earnings report. The stock dropped 20.1% and closed at a 4 1/2 month low. BZH is one of the most speculative names in the sector. I am watching it more closely given its amazing strength rising from single digits last summer; the stock almost doubled from those lows. Now the stock looks like it has topped out for the time being.
Meritage Homes, M.D.C Holdings, and Beazer Homes each reported earnings at the end of a week of market turmoil. Perhaps the general pressure on the market exaggerated the selling in these stocks. Time will tell. Since this period is the seasonally strong period for home builders, I am inclined to look for opportunity in the dips and buy them. I will soon study the earnings for MTH and MDC before to help with the decisions.
In the meantime other stocks like KB Home (KBH) and Lennar (LEN) look more interesting. KBH quickly overcame an initial post-earnings sell-off to climb to a 2-year high. LEN suffered a small “gap and crap” before streaking straight up for a 16.8% gain to its own 2-year high. The stocks had the advantage of reporting earnings while animal spirits were roaring.
New Residential Construction (Single-Family Housing Starts) – December, 2019
The slow and measured ascent in housing starts ended with a bang in December. The surge helped open the door to animal spirits in the stocks of builders.
Single-family housing starts for November were revised upward from 938,000 to 949,000. December starts increased month-over-month by 11.2% to 1,055,000. On an annual basis, single-family housing starts increased by a very strong 29.6%. For perspective, recall that from October, 2018 to May, 2019, the year-over-year percentage changes were negative except for January’s 9.4% gain. The last seven months delivered monthly year-over-year gains as the housing market recovered from last year’s slowdown. I asked in the last Housing Market Review whether builders could continue to pick up the pace; the chart below answers that question with a resounding YES.
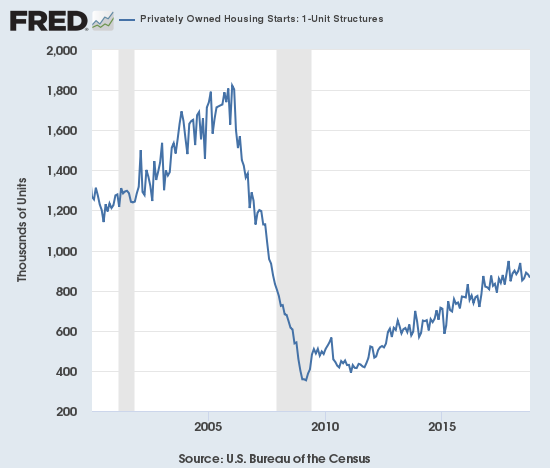
Source: US. Bureau of the Census, Privately Owned Housing Starts: 1-Unit Structures [HOUST1F], retrieved from FRED, Federal Reserve Bank of St. Louis, January 18, 2020.
For December, the regional changes were all positive but widely distributed. The Northeast clung to a gain to stay consistent with a recent recovery. The Northeast, Midwest, South, and West each changed +3.4%, 73.1%, +20.8%, and +36.6% respectively. The furious construction activity in the South actually did not lead the way in December. The Midwest’s surge is particularly incredible. Housing starts there jumped from near the bottom of the recent range to a post-recession high. Past spikes did not lead to sustained start activity, so I will be looking closely to see whether this time is different.
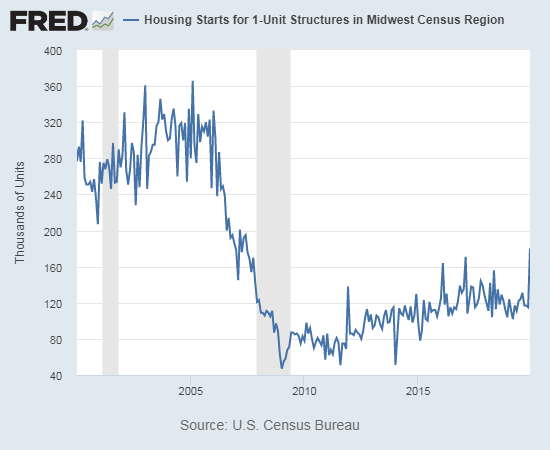
Source: U.S. Census Bureau and U.S. Department of Housing and Urban Development, Housing Starts for 1-Unit Structures in Midwest Census Region [HOUSTMW1F], retrieved from FRED, Federal Reserve Bank of St. Louis, January 18, 2020.
Existing Home Sales – December, 2019
The 16-month streak of year-over-year declines for existing home sales came to an end, just barely, in July. While December existing home sales surprised me by hitting a high for 2019, total sales for the year stayed flat with 2018. Recall that 2018 included a significant housing slowdown in the final 3-4 months of the year.
The seasonally adjusted annualized sales in December of 5.54M were up 3.6% month-over-month from the unrevised 5.35M in sales for November. Year-over-year sales increased 10.8%.

(As of the March, 2018 data, the NAR further reduced historical data to just 13 months. For historical data from 1999 to 2014, click here. For historical data from 2014 to 2018, click here) Source for chart: National Association of Realtors, Existing Home Sales© [EXHOSLUSM495S], retrieved from FRED, Federal Reserve Bank of St. Louis, February 2, 2020.

December delivered a mix of strong sales, reduced inventories, and higher prices. The NAR lamented the resulting further deterioration in affordability in the housing market: “Price appreciation has rapidly accelerated, and areas that are relatively unaffordable or declining in affordability are starting to experience slower job growth…The hope is for price appreciation to slow in line with wage growth, which is about 3%.”
Despite these observations, the NAR later flipped around to look forward to 2020 because of a strong economy and rising housing starts: “We saw the year come to a close with the economy churning out 2.3 million jobs, mortgage rates below 4% and housing starts ramp up to 1.6 million on an annual basis…If these factors are sustained in 2020, we will see a notable pickup in home sales in 2020.” I think new home sales will increase given builders are anticipating these sales with higher starts. However, existing home sales are much harder to call given declining inventories and the run-up in prices. Sellers will need to appear who are moving/upgrading to new homes.
Absolute inventory levels of 1.40M homes represented another substantial decline of 14.6% from November and down 8.5% year-over-year. It seems the jump in sales drained inventories: “Unsold inventory sits at a 3.0-month supply at the current sales pace, down from the 3.7-month figure recorded in both November and December 2018.” The on-going decline in inventory is now at seven straight months.
The median price of an existing home hit $274,500, a whopping year-over-year increase of 7.8% and the 94th straight month of a year-over-year gain. This on-going upward price pressure has little changed whether inventories happen to drop or gain in any given month. The disconnect from inventory levels make me skeptical that 2020 price appreciation will realign to wage growth rates. If mortgage rates fall further, the increased buying power will help prices stay ahead of wage growth.
Still, the large price increase surprised me given the (presumed) shift to lower-priced homes in many housing markets. In the last review I noted that existing home sales data suggested the shift may already be coming to an end, and the NAR seemed to corroborate my claim:
“Compared to one year ago, fewer homes were sold below $250,000; with a 16% decline for homes priced below $100,000 and a 4% reduction for homes priced from $100,000 to below $250,000.”
The NAR did not provide a December update on these stats, but the aggregate price gains are consistent with a continuation of the shift.
December’s share of first-time buyers dropped to 31% from November’s 32% and December, 2018’s 32%. The average share for first-time homebuyers for 2016 was 35%. The NAR’s 2017 Profile of Home Buyers and Sellers reported an average of 34% for 2017, 33% for 2018, and 33% for 2019. Again, if a shift is still happening toward more affordable homes, it is not likely coming from first-time buyers.
Investors purchased 17% of homes in December, up from November’s 16% and last year’s December 15%.
The highlight for regional sales in August was the end of a 13-month streak of declines for year-over-year sales in the West. Only the Midwest failed to gain in September and only the Northeast failed to gain in October. For November, the Northeast was once again the only region that failed to make gains. The regional changes for December were strong across the board: Northeast +8.8%, Midwest +9.2%, South +12.4%, West +10.7%.
Like September through November, all regions experienced notable and robust price jumps in December. Here are the regional year-over-year changes in median home prices: Northeast +7.4%, Midwest +9.2%, South +6.7%, West +8.1%.
Single-family home sales increased 2.7% from November and increased on a yearly basis by 10.6%. The median price of $276,900 was up a healthy 8.0% year-over-year.
California Existing Home Sales – December, 2019
The market for existing homes in California further tightened in December.
The California Association of Realtors (CAR) reported sales of existing Californian homes at a 10-year low in January, 2019. July sales were at a 15-month high. Year-over-year sales are now up six months straight. Still, 2019 total sales were down from 2018 by 1.2%, a second straight down year. December sales were down 1.0% from November and up 7.4% year-over-year.
February 2019’s median price was the lowest in 12 months. The median price suddenly swung to record highs from June to August. October’s year-over-year gain was the largest since July, 2018, but November’s 2.6% monthly drop was the first time in 7 months that the median closed below $600,000. December’s median of $615,090 was up 4.3% from November and up 10.3% year-over-year. According to the CAR “the year-over-year price increase was the largest since May 2014 and the first double-digit price increase in more than five-and-a-half years.” Of course, this gain came off a favorable comparable given the housing market hit a trough around December, 2018.
The inventory situation in California continues to get more and more dire. In September, the number of active listings dropped 11.8% year-over-year, the largest such drop since December, 2017. October’s 18.0% year-over-year was the largest since May 2013. November’s decline of 22.5% and December’s drop of 26.5% were the largest percentage drops since April, 2013. The absolute number of active listings also hit a near 7-year low. Unsold inventory hit 2.5 months of sales in December, notably down from November’s 3.1 months and the previous year’s December of 3.5 months. A limited amount of pricier inventory promises to produce another sluggish year of sales of existing homes in California.
New Residential Sales (Single-Family) – December, 2019
In December, the Census Bureau continued making significant revisions to past single-family home sales numbers: September was revised further downward from 730,000 to 725,000, October was nudged down further from 710,000 to 705,000, and November was cut from 719,000 to 697,000. In other words, the Bureau has consistently over-estimated sales in recent months. These downward revisions take on extra significance with sales around post-recession highs. December’s estimated sales of 694,000 were down -0.4% from November but 23.0% above December’s slumping sales of just 564,000.
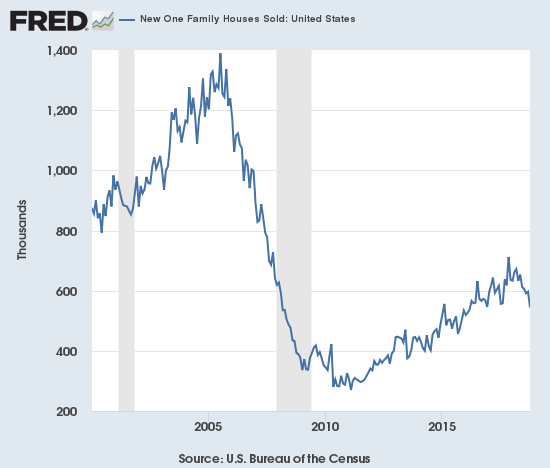
Source: US. Bureau of the Census, New One Family Houses Sold: United States [HSN1F], retrieved from FRED, Federal Reserve Bank of St. Louis, February 2, 2020.
Since hitting a post-recession peak in November and December, 2017, the median price of a new single-family home has trended slightly downward to stalled out largely thanks to a surge in entry-level and lower-priced new homes. However, just as with existing home sales, new home sales may no longer benefit from such a shift. September’s median price was adjusted up again this time from $312,100 to $315,700. October was adjusted higher from $316,900 to $323,400. Interestingly, November was significantly revised downward from $330,800 to $320,900. November fell off its perch as the second highest priced month of the year. That crown now goes to December with a $331,400 median price, up 0.5% year-over-year from 2018.
October’s slight shift toward more expensive homes accelerated in November, but the shift was mixed in December. Both the $200,000 to $299,000 and $400,000 to $499,000 ranges dropped notably in share while the tiers left adjacent gained.
Ever since the inventory of new homes for sale jumped to 6.0 months of sales in June, 2018, inventory has pivoted around that 6.0 level. June 2019’s inventory sat at 6.3 days of sales. Sales in August were high enough to send inventory plunging back to 5.5 days of sales and were 5.7 in December.
The regional changes in sales were mixed with another dramatic surge in the West that likely distorted the overall shifts in pricing. The spread of year-over-year sales changes was the most extreme I have observed since following these data. December sales in the Northeast increased 11.1%, the Midwest increased 16.9%, the South slid slightly by 1.1%, and the West surged an eye-popping 99.2% to a post-recession and a 13-year high. December, 2018 sales in the West were quite depressed at a 3+ year low at the time.
Home Builder Confidence: The Housing Market Index – January, 2020
In December, the Housing Market Index (HMI) hit an amazing 20 1/2 year high. For January, the HMI nudged lower from 76 to 75. The National Association of Home Builders (NAHB) provided a familiar summary:
“With the Federal Reserve on pause and attractive mortgage rates, the steady rise in single-family construction that began last spring will continue into 2020,” said NAHB Chief Economist Robert Dietz. “However, builders continue to grapple with a shortage of lots and labor, while buyers are frustrated by a lack of inventory, particularly among starter homes.”
The single family detached was the only HMI component that declined. The Traffic of prospective buyers increased by a point. In between was the single family detached next 6 months which stayed flat. All three indices remain relatively strong.
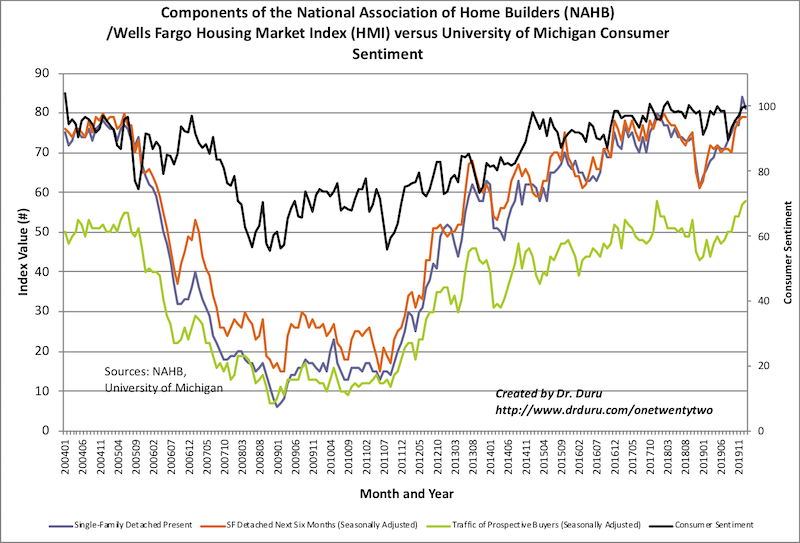
Source: NAHB
On a regional basis, the Midwest was the only region to decline. The HMI there continues to be volatile the 7 point drop to 66 follows a 15 point surge to a 2-year high. The other regions stayed flat or increased slightly.
Parting thoughts
In general, the year-over-year plunge in mortgage rates supported the housing market in 2019. However, the lack of inventory, especially in existing homes means that a large share of the benefits are going to home sellers. That is, the lower mortgage rates have traded off buying power with higher prices for the same sales. The further deterioration in housing affordability is a perverse, and perhaps counter-intuitive, outcome of more accommodative monetary policy that is supposed to support demand in rate sensitive goods. This coming year needs to be a year of robust incremental demand to keep the housing market healthy. Otherwise, the next swing upward in rates will send the market plunging all over again similar to late 2018.
Low construction has also helped to drive rents higher as households who cannot afford homes compete for limited rental properties in certain markets. The following Marketplace segment discusses the impact translating into taller and taller high rise apartments.
Finally, Freddie Mac offered its prognostications for the 2020 housing market. Freddie Mac started with the claim that low mortgage rates will “very supportive of a continued rise in purchase demand.” Yet, “the lack of housing supply is one of the largest economic issues for the United States, and unless there are policy interventions, it is likely to worsen.” In other words expect prices to keep soaring for housing: “Housing affordability is expected to worsen in 2020 as the demand for homes continues to outstrip supply.”
Be careful out there!
Full disclosure: long ITB call spread and calls, long SPY puts