Housing Market Intro and Summary
A potential peaking in mortgage rates may be the only good thing to say about today’s housing market. Sales continue to slide, input costs remain high, affordability continues to decline, and builder sentiment sinks lower and lower. The reports from August tell a consistent story of a steepening housing downturn. With the Federal Reserve acknowledging that tightening monetary policy will bring some economic pain, the industry now needs to brace for the fallout from higher unemployment somewhere down the road. The constant drumbeat of bad news has delivered a reality check stark enough for industry groups to use the word “recession” to describe the sales environment.
In my last Housing Market Review, I talked about a housing industry building from the bottom. The specific bottom remains elusive. The next key test will come during the seasonal turn in October or November when the market starts anticipating the 2023 Spring selling season. Data and sentiment may be so poor by then that a path to an upside surprise may finally materialize.
Housing Stocks
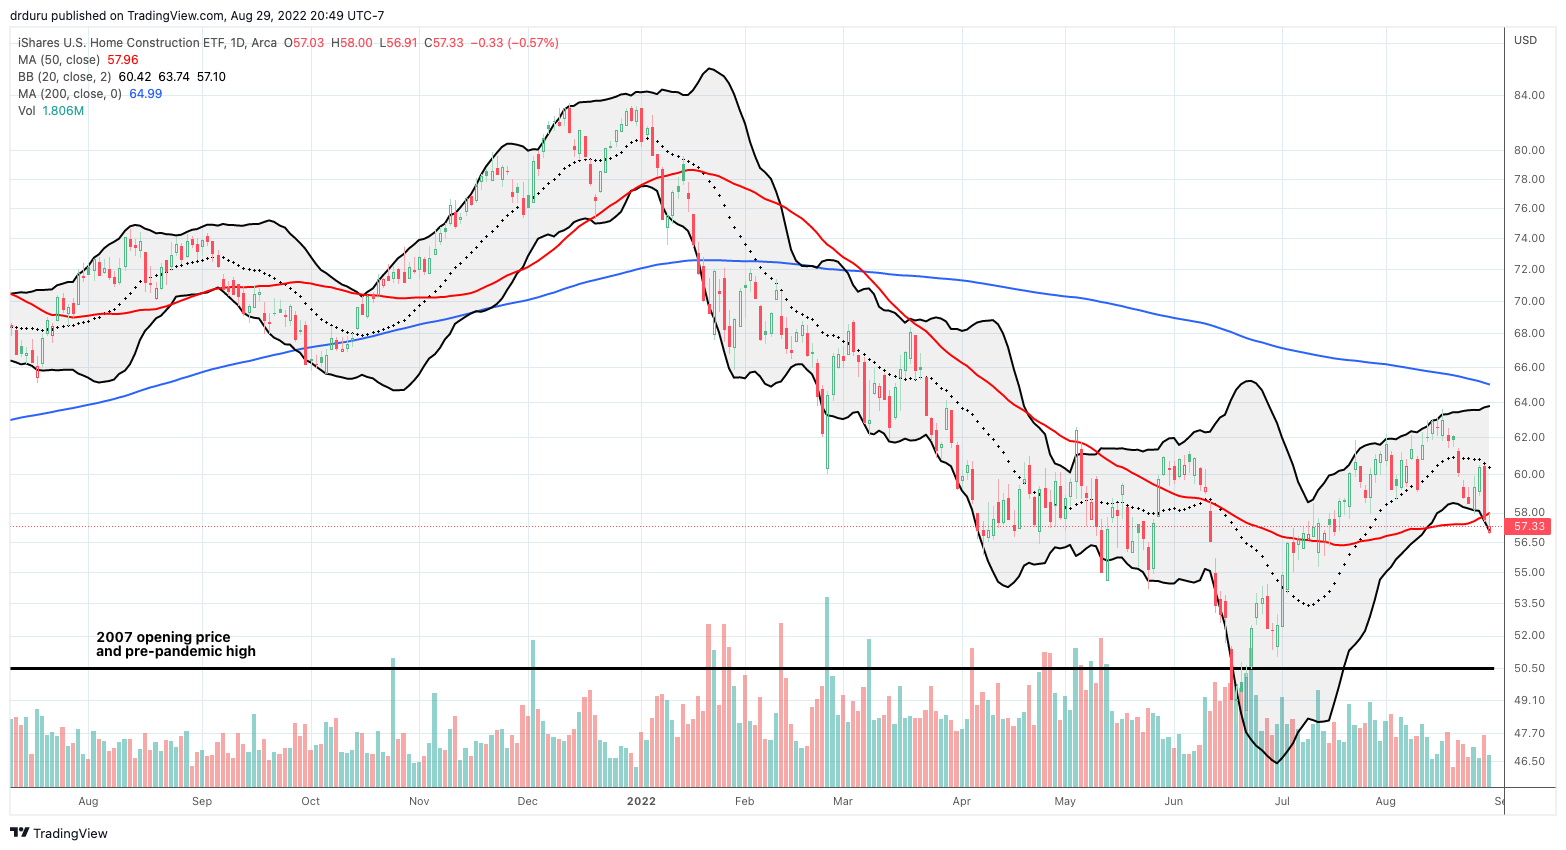
I read the process of bottoming in the iShares US Home Construction ETF (ITB) as a sign of growing confidence in a bottoming in the housing market. Trading since August’s peak undermined that thinking. The stock market is back to bearish trading, and ITB suffered along with the stock market. ITB lost 4.5% last Friday alone. The move finished wiping out a month of gains with ITB peaking right after the release of another poor report on home builder sentiment. With the 50-day moving average (DMA) giving way as support, ITB may eventually retest the pre-pandemic high. A fresh sell-off and new low price extreme in ITB might coincide well with the start of the buying season for home builder stocks (October and November).

Housing Data
New Residential Construction (Single-Family Housing Starts) – July, 2022
Housing starts continued their fall below the pre-pandemic peak and officially ended below the 1M mark after an upward revision for June. Starts decreased 10.1% from June to July’s 916,000 and decreased 18.5% year-over-year. June’s starts were revised upward to 1,019,000. Starts remain in a steep decline, so breaking the 1 million mark indicates a lower chance of settling into a range in the coming months. I am now watching for a new floor of 800K starts.
![Housing starts Source: US. Bureau of the Census, Privately Owned Housing Starts: 1-Unit Structures [HOUST1F], first retrieved from FRED, Federal Reserve Bank of St. Louis, August 17, 2022.](https://drduru.com/onetwentytwo/wp-content/uploads/2022/08/220817_Housing-Starts.png)
The Northeast was the only region where starts gained ground. The West managed a month-over-month gain. So the South was a primary drag on July starts. Housing starts in the Northeast, Midwest, South, and West each changed +79.1%, -27.8%, -24.2%, and -14.8% respectively year-over-year.
Note that Northeast starts have been relatively stable since 2013. However, July’s jump took Northeast starts surprisingly high, all the way to a one year high.

Existing Home Sales – July, 2022
For the July report, the National Association of Realtors (NAR) trotted out the “R” word to describe the market for existing homes: “We’re witnessing a housing recession in terms of declining home sales and home building”. However, the price squeeze continues and remaining buyers are snapping up homes. A true recession will happen if housing activity implodes broadly across markets and buying segments.
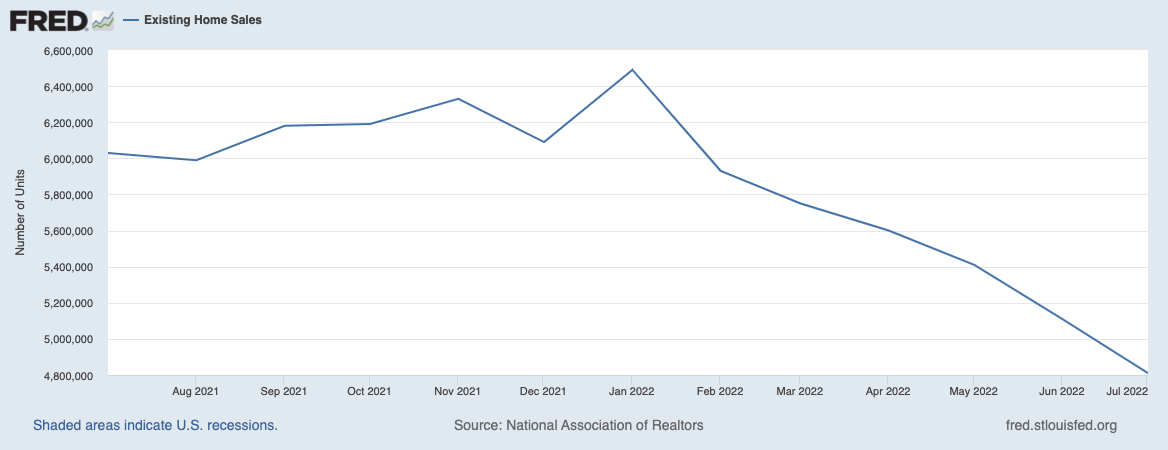
Existing home sales dropped for a sixth month in a row. The seasonally adjusted annualized sales in July of 4.81M decreased 5.9% month-over-month from the slightly downward revised 5.11M in existing sales for June. Year-over-year sales decreased 20.2%. Sales have now broken down below the pre-pandemic home sales activity between 5.0M to 5.5M in 2019 and 2018. This push goes beyond normalization and marks a full-blown slowdown. Sales were last this low in 2014 excluding the pandemic-driven crash.
(For historical data from 1999 to 2014, click here. For historical data from 2014 to 2018, click here) Source for chart: National Association of Realtors, Existing Home Sales© [EXHOSLUSM495S], retrieved from FRED, Federal Reserve Bank of St. Louis, August 28, 2022.

June’s absolute inventory level of 1.31M homes increased 4.8% from June. The six straight monthly increases line up perfectly with the on-going sequential decline in sales. The sequential increases were steep enough by June to finally push inventory up year-over-year for the first time in 38 months. Inventory stayed flat year-over-year in July. According to the NAR, “unsold inventory sits at a 3.3-month supply at the current sales pace, up from 2.9 months in June and 2.6 months in July 2021.” Inventory levels are still relatively tight. Normalized inventory will be around 6 months of sales.
The increase in absolute inventories is still not impacting the time it takes for buyers to take a home off the market. The average 14 days it took to sell a home in July was the same as in June and DOWN from 17 days a year ago. The NAR reported this 14-day turnover is a record low since measurements began in 2011. Moreover, 82% of homes sold within one month. This rapid turnover continues to demonstrate the strength of market demand among those who can still afford a home. The decline confounded the NAR in the June report: “Finally, there are more homes on the market…the record-low pace of days on market implies a fuzzier picture on home prices.”
Still, the linear march higher in prices finally came to an end. The median price of an existing home decreased 2.4% from June’s all-time high to $403,800 and jumped 10.8% year-over-year. Prices have increased year-over-year for 125 straight months, an on-going record streak.
The sequential decline did not stir incremental interest in first-time home buyers. They decreased their share of sales from 30% in June to 29% in Julu. The NAR’s 2017 Profile of Home Buyers and Sellers reported an average of 34% for 2017, 33% for 2018, 33% for 2019, 31% for 2020, and 34% for 2021.
All regions declined significantly in sales year-over-year, especially the West for a second month in row. The regional year-over-year changes were: Northeast -16.2%, Midwest -14.4%, South -19.6%, West -30.4%.
For the tenth month in a row, the South’s median price soared year-over-year. The South has outpaced the other three regions 11 months in a row. I imagine the rush for more attractive and affordable housing in the South is continuing to apply the stronger price pressures. The regional year-over-year price gains were as follows: Northeast +8.1%, Midwest +7.0%, South +14.7%, West +8.1%.
Single-family home sales decreased 5.5% from June and declined on a yearly basis by 19.0%. The median price of $410,600 was up 10.6% year-over-year.
California Existing Home Sales – July, 2022
Bidding wars continued to cool down in California. The statewide sales-price-to-list-price ratio from the California Association of Realtors (C.A.R.) fell to an even 100.0% from 101.3% in June and 103.8% a year ago. The time to sell a home in California increased from the extremely swift 8 days last year to the less swift 14 days this year.
Buyers’ choices also expanded again. June’s total active listings rose to its highest point in almost 3 years. June’s active listings soared 64.4% year-over-year, which C.A.R. reported as the largest growth in over 7 years. Year-over-year increases in active listings occurred in 46 of 51 counties tracked by the C.A.R. compared to 44 in June. The July report did not include state level data.
C.A.R. identified falling demand as a driver sending the unsold inventory index (UII) to levels last seen in May, 2020. The UII increased to 3.2 months in July, 2022 from 1.9 months a year ago.
C.A.R. reported that “existing, single-family home sales totaled 295,460 in July on a seasonally adjusted annualized rate, down 14.4 percent from June and down 31.1 percent from July 2021.” Sales were last this low in May, 2020. A change in mix away from million-dollar plus homes helped drive the annual price increase to its lowest pace in two years. The median sales price increased 2.8% year-over-year while dropping 3.5% sequentially. In June, a change in mix away from two million dollar plus homes drove price dynamics. Still, housing affordability in California is at its lowest level in 15 years.
New Residential Sales (Single-Family) – July, 2022
New home sales plunged to levels last seen February, 2016. Rising mortgage rates have removed the excess and then some from the market. The pandemic-driven surge now looks like a major pull-forward of demand.
July new home sales of 511,000 were down 12.6% from June’s 585,000 (revised down). Sales were down an eye-popping 29.6% year-over-year. The drop below the 550,000 level pushed the market for new homes into a deeper slowdown. This breakdown makes the relative optimism in the stocks of home builders look misplaced. Still, with recession-like valuations already in place for many months, the hardiest investors must have decided the future upside of a recovery will be worth the wait.
![new home sales Source: US. Bureau of the Census, New One Family Houses Sold: United States [HSN1F], first retrieved from FRED, Federal Reserve Bank of St. Louis, August 24, 2022](https://drduru.com/onetwentytwo/wp-content/uploads/2022/08/220824_New-Home-Sales.png)
The distribution of home sales continued to swing through the price tiers. For June, a plunge in sales in high-end homes led the way. For July, lower-tier homes lost significant share. The $700,000+ price tier was the only one to gain sales month-over-month. Accordingly, its share of sales soared from 5% to 12%. June’s distribution now looks like an anomaly. The rebound for more expensive homes helped send the median home price higher 8.2% year-over-over and up 5.9% month-over-month.
The persistent drop in sales has sent inventory soaring. The market for new homes now sits on a bloated 10.9 months of inventory, up from 9.3 in June. The high inventory should push builders to slow starts further in coming months.
Every region suffered big year-over-year declines in sales with the West getting hit the hardest. Not even the South escaped double digit losses this time. Northeast new home sales fell 37.0% year-over-year although it was the only region with a month-over-month gain. The Midwest suffered its tenth straight month with a significant decline; the year-over-year plunge was similar to June’s at 22.9%. The South joined the club of double-digit losses with a drop of 20.8%. The West cratered 50.3% year-over-year to an 8-year low.
![Regional new one family home sales Source: U.S. Census Bureau and U.S. Department of Housing and Urban Development, New One Family Houses Sold in South Census Region [HSN1FS], Midwest Census Region [HSN1FMW], Northeast Census Region [HSN1FNE], West Census Region [HSN1FW], retrieved from FRED, Federal Reserve Bank of St. Louis, May 1, 2022.](https://fred.stlouisfed.org/graph/fredgraph.png?g=T8Y3)
Home Builder Confidence: The Housing Market Index – August, 2022
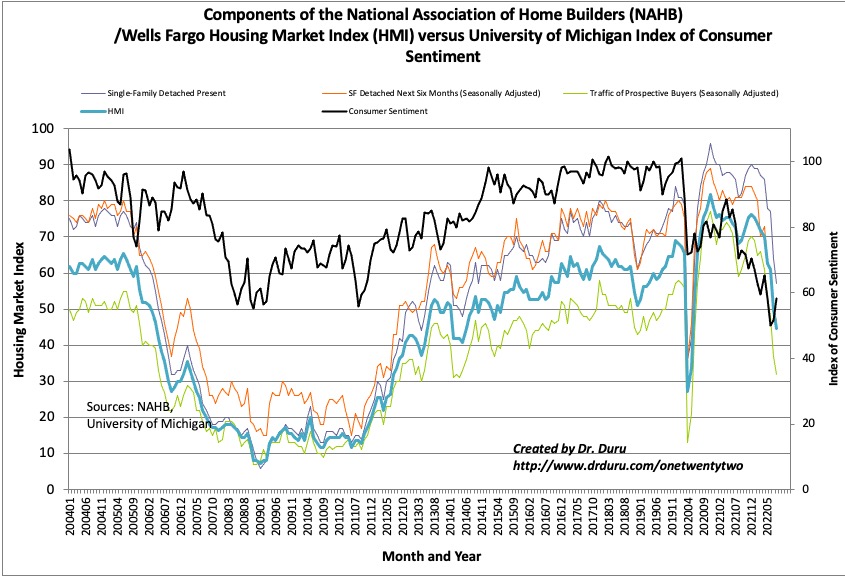
The Housing Market Index (HMI) plunged again, this time from 55 to 49 in August. This indicator of home builder sentiment is in freefall with no positive catalysts on the immediate horizon given the Fed affirmed its hawkishness. Perhaps ironically, consumer confidence increased for the second month in a row although it remains stuck in its own steep downtrend. The Traffic of Prospective Buyers (Seasonally Adjusted) led the way down again for the components of the HMI. Its 5 point drop to 32 sent the indicator of future demand to an 8-year low.

Source for data: NAHB and the University of Michigan
Sentiment is so bad that the National Association of Home Builders (NAHB) felt comfortable enough joining the NAR is using the “R” word for the housing market: “Tighter monetary policy from the Federal Reserve and persistently elevated construction costs has brought on a housing recession.” However, the NAHB is optimistic that long-term interest rates have peaked and will allow the housing market to stabilize in coming months. The NAR expressed similar optimism.
The HMI fell broadly across regions for the second straight month. The losses were almost evenly distributed in absolute terms. The South fell from 60 to 54. The West fell from 47 to 42. The Northeast dropped from 57 to 49. The Midwest fell from 49 to 42.
Home closing thoughts
Housing Reality Check
The pandemic-era housing boom soared so high, so fast that the current slowdown feels like a calamity. Yet, prices remain high while sales tumble to levels last seen before the pandemic. Accordingly, Marketplace asked the question “Is housing in a recession or a reality check?” The title came from a realtor interviewed in the story. I borrowed the title as a timely theme for the August housing data. I like the concept of a “reality check” because, as noted in the piece, a true recession would include a generalized recession in the economy with a spike in foreclosures and related economic tragedies. Absent an official recession, the current malaise is more like the sobering reality check that follows excessive enthusiasm of a manic market.
Spotlight on Mortgage Rates
The promising peaking of mortgage rates in late June may be in jeopardy. In just three weeks, rates jumped up from 4.99% to 5.55%. The stabilization that the industry groups are hoping for may be a volatile range between 5% and 6% at best.
![Sources include: Board of Governors of the Federal Reserve System (US), Market Yield on U.S. Treasury Securities at 30-Year Constant Maturity [DGS30], retrieved from FRED, Federal Reserve Bank of St. Louis and Freddie Mac, 30-Year Fixed Rate Mortgage Average in the United States [MORTGAGE30US], retrieved from FRED, Federal Reserve Bank of St. Louis, May 1, 2022](https://fred.stlouisfed.org/graph/fredgraph.png?g=Tcb6)
Blackstone (BX) Backs Out
In what reads like a rational move, Blackstone’s Home Home Partners announced the suspension of its home purchase and lease program in 38 cities representing “less than 5% of [its] recent activity.” The decision included markets with new, unfavorable regulations like two suburbs of Minneapolis-St. Paul, Minnesota. The related Bloomberg article noted that other institutional landlords have already started slowing purchases. If these suspensions pick up, these investors will further dampen already low sentiment in the housing market.
Rent Inflation
Rising rents are a big driver of the Federal Reserve’s inflation concerns. Accordingly, record rent levels promise to keep the Fed hiking rates which in turn will further lift mortgage rates. With CNN reporting that U.S. rents hit a record high for the 17th straight month, I understand why Fed chair Jerome Powell fretted that inflationary pressures have broadened through the U.S. economy.
Unaffordable Housing
As I noted in the last Housing Market Review, hiking rates to fight inflation has the paradoxical effect of driving the cost of homeownership higher as an immediate impact. The flow through to reducing demand enough to meet supply (actually, go well under supply) is a slow process in this era of relatively tight supply. The Joint Center for Housing Studies of Harvard University estimated that the annual income required to buy the median house soared by 35% from April, 2021 to April, 2022. With mortgage rates at best stabilizing and price growth merely plateauing, affordability relief remains a milestone sitting out in the distance.
Be careful out there!
Full disclosure: long ITB shares


