

{This analysis was updated on January 1, 2025 with the latest data, more clarity, and some corrections. Please see “How Home Builder Stocks Trade In A Seasonal Pattern (2025 Update)“}
Introduction
The U.S. housing market follows a seasonal pattern. The spring selling season represents the year’s peak of home sales. During this time, households try to settle into a new home before summer travel or well ahead of the Fall start to the next school year. The stocks of home builders also approximate a seasonal pattern that anticipates the spring selling season through market sentiment. Like retailers who eagerly anticipate the Christmas shopping season, home builders work hard to prepare for the promising prospects for the spring selling season.
Analysts and market participants follow this enthusiasm by bidding up the stocks of home builders. Unless spring sales greatly surprise to the upside, momentum for these stocks starts to wane around the peak of the spring selling season. The seasonal pattern for the stocks of home builders is so strong that iShares U.S. Home Construction ETF (ITB) typically outperforms the S&P 500 (SPY) over this time.
The Seasonal Pattern
People who follow the housing market are very familiar with its seasonality. For example, in November, 2015, KBW called out “rally time for home builders.” An article describing KBW’s analysis noted “spring is the season for home sales, but it is the November-January period that’s rally time for homebuilder stocks…the team noting 75% of homebuilder returns occur during this period….Homebuilders, they say, historically outperform the market by 1.4% in November, 6.2% in December, and 6.4% in January.”
KBW’s commentary followed on the heels of the 2015 season which delivered the expected pattern. The iShares U.S. Home Construction ETF (ITB) gained 14.9% from the end of October, 2014 to the end of March, 2015. ITB gained 9.9% gain for the full 12 months starting November 1, 2014. Thus, 66% of ITB’s gains came in the seasonally strong period. Unfortunately, the 2016 season disappointed. ITB gained just 0.8% from the end of October, 2015 to the end of March, 2016. Still, the seasonal period performed much better than the -7.4% performance for the full 12 months.
When Susquehanna downgraded D.R. Horton (DHI) and Lennar Corporation (LEN) to neutral from positive in April, 2019, they reasoned that the year already delivered a “classic spring season for both demand and the stocks.” The 2019 season generated an 8.7% gain from the end of October, 2018 to the end of March, 2019. However, 2019 happened to be an extremely strong year. The spring season surprised to the upside mainly thanks to fresh interest rate cuts from the Federal Reserve. ITB gained a whopping 31.2% for the full 12 months.
These examples illustrate both the power of the seasonal effects in the housing market and the difficulties in formulating a consistent trading rule for the season. Traders anticipating the seasonal effect can distort timing for the trade. Macroeconomic forces can overwhelm typical seasonality.
How to Trade the Seasonal Pattern
Using 16 years of data, I created rules for trading the seasonal pattern for home builder stocks using ITB to minimize the impact of company-specific performance dynamics. I also call this period of trading the seasonally strong period for home builder stocks.
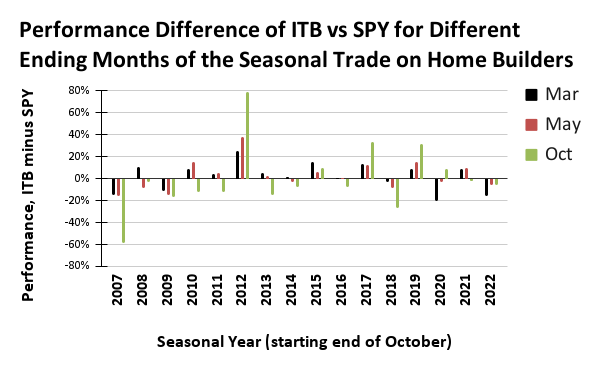
The chart below compares ITB’s outperformance over SPY when ending the seasonal trade on March, May, and October (the end of my “home builder year”). Since 2007, there are only four years – 2012, 2017, 2018, and 2020 – when ITB ended the 12 months with greater outperformance than ending the trade during the spring selling season (March or May). The year 2020 was the start of the pandemic when housing-related stocks collapsed in March which in turn undermined the seasonal trade in historic fashion. Seven of sixteen years ended with significant ITB underperformance. The chart shows that traders should generally end the seasonal trade by May. Traders next decide whether to shift funds for trading home builders into SPY through October.
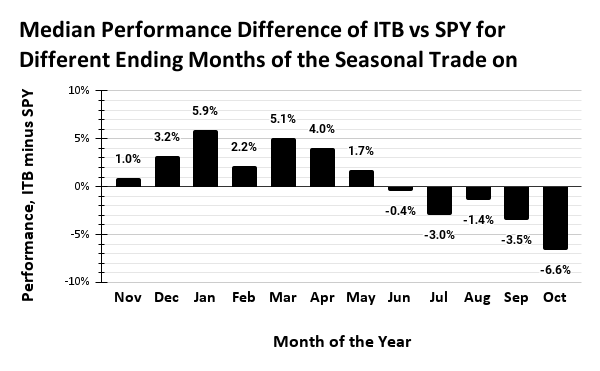
The next chart shows the median performance of the seasonal trade across the years for different ending months. This view shows a stark difference in performance during the seasonally strong period for home builder stocks (November to May) and the rest of the year. In other words, this chart directly guides traders to switch out of ITB for SPY by the end of the seasonally strong period.
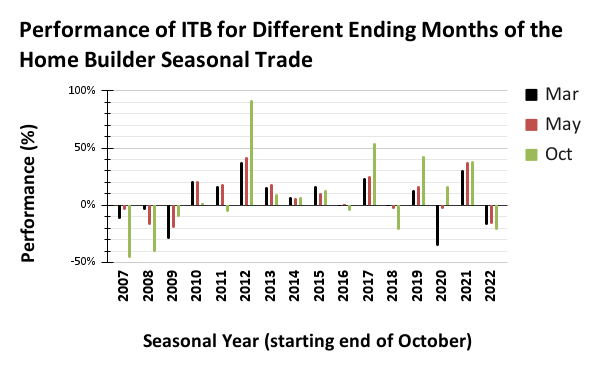
For reference, the chart below shows the absolute performance for ITB when ending the seasonal trade in March, May, or October. At the negative extreme, ending the ITB trade in July saves traders from significant losses. At the positive extreme, ending the ITB trade in July misses out on significant gains. In between, there are only small differences between ending the trade on March versus May.
Buy the Dips
I typically add a nuance to the seasonal trade on home builders to account for changing dynamics over time: the route to performance is not a straight line. During the seasonally strong period, I like to take some profits along the way in the middle of strong rallies. Taking profits provides a performance buffer. I also look to buy dips along the way to enhance performance. If a significant sell-off occurs during the seasonally strong period, I buy ITB with the assumption that the tailwind of the season will work in my favor. Additionally, I may buy individual home builders, particularly if they suffer company-specific sell-offs after reporting earnings. I assume the tailwinds of the seasonally strong period will at least create a notable relief rally.
The seasonal trade gets a boost from another seasonal pattern: the tendency for the S&P 500 to suffer its worst drawdowns between August and October. These drawdowns generally lead to prime buying opportunities for the seasonal trade sometime in October. Last year (2022) provided an example of how well this buy-the-dip addendum can work.
The 2023 Season So Far
At the time of writing, the stock market is experiencing an historic cycle of monetary tightening from the Federal Reserve. Despite the terrible year for the stock market in 2022, the seasonal trade for 2023 got off to a good start. ITB outperformed SPY by 2.6 percentage points in November and extended that outperformance to 8.7 percentage points in December. Given the overriding bearishness in the stock market, I am currently anticipating at least one more buy-the-dip opportunity in home builders before the latest seasonally strong period comes to an end.
Readers can follow commentary on the housing market by subscribing to this blog’s mailing list or by reviewing articles listed under “housing.” Readers interested in more details about the seasonal trade on home builders can review the data and calculations located in Google sheets. The charts are also easier to read in the sheet. All data sourced from Yahoo Finance. Post any questions below.
Be careful out there!
Full disclosure: long ITB shares and call spread
1 thought on “How Home Builder Stocks Trade In A Seasonal Pattern”