

Housing Market Intro and Summary
In my last Housing Market Review, I described how a housing recession was reflected in the worsening housing data, including the latest report on U.S. GDP. While new home sales made another surprise bounce in October, the rest of the housing data continued to worsen in the month. However, a respite from rising rates sent mortgage application volume upward for two weeks in a row. In parallel, the stocks of home builders stayed aloft during November. These stocks even exhibit a type of eerie calm.
The current target rate for the federal funds rate is 3.75% to 4.00%. The futures market expects the cycle to top out at 5.00% to 5.25% by March, 2023. Combine a rate hike cycle closer to the end than the beginning with a frenzied run-up in mortgage rates, and conditions now favor an improved lending environment for home buyers. Accordingly, conditions also favor a (much belated) start to the seasonal trade on home builders with modest upside expectations. The seasonal trade is more contrarian than my bets on the housing market back in 2012 and 2013.
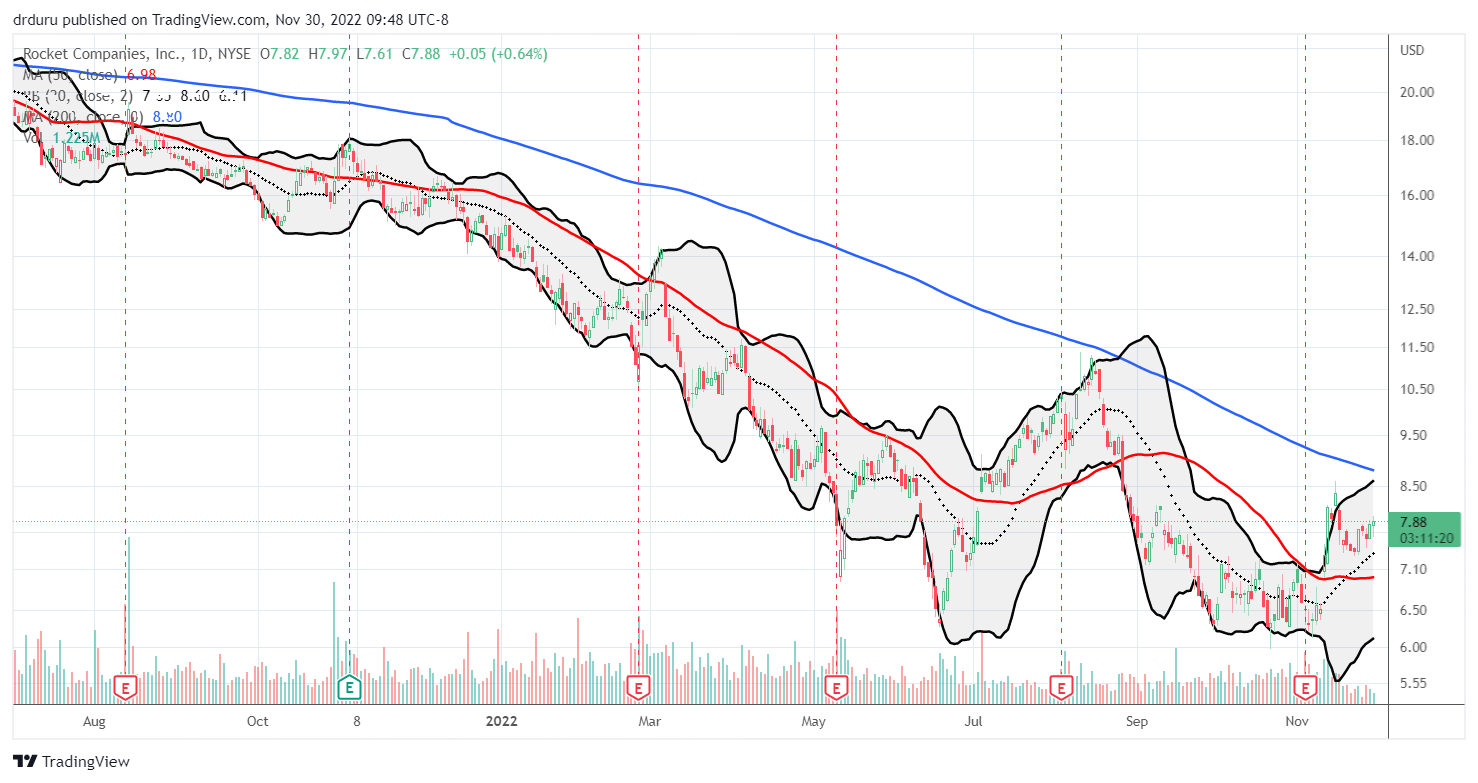
Home buyers are getting a kind of respite from creative mortgage lenders. For example, Rocket Mortgage, a part of Rocket Companies, Inc (RKT), rolled out its “Inflation Buster” program about a month ago. Rocket Mortgage offers a buy down of 1 percentage point of the mortgage rate for a year. The company also gives buyers the opportunity to refinance at a discount if rates drop within three years of the home purchase – an extremely likely event. These kinds of programs are likely a huge relief to motivated buyers who have life events compelling them to purchase a home.
Housing Stocks
At the time of writing, the iShares US Home Construction ETF (ITB) is up 4.3% for the month of November. ITB outperformed the S&P 500 (SPY) and its 1.8% gain for the month, a great start to the seasonal trade on homebuilders. Recall that ITB tends to outperform the S&P 500 during this period.
")
D.R. Horton (DHI) added to the eerie calm in the stocks of home builders by soaring 11.2% post-earnings on November 10th. This reaction to a generally sober outlook helped ITB and home builders in general stabilize the rest of the month. DHI has not made further progress since that pop, but this performance is stellar for a recessionary market.
")
While Rocket Mortgage gets creative to prop up mortgage volumes, the company’s stock remains stuck in a downtrend. Like home builder stocks, RKT benefited from DHI’s earnings results earlier in the month.
Housing Data
New Residential Construction (Single-Family Housing Starts) – October, 2022
Housing starts reached a fresh pandemic era low (excluding the plunge in the early months of the pandemic). Starts decreased 6.1% month-over-month to 855,000. Starts decreased 20.1% year-over-year. September’s starts were revised downward to 911,000. While starts hit a new low, the odds still seem good for the 800K floor to hold in the face of the current housing downturn. Sinking home builder sentiment will likely drag starts to the 800K level.
![Source: US. Bureau of the Census, Privately Owned Housing Starts: 1-Unit Structures [HOUST1F], first retrieved from FRED, Federal Reserve Bank of St. Louis, November 27, 2022.](https://drduru.com/onetwentytwo/wp-content/uploads/2022/11/221127_Housing-Starts.png "Housing starts")
Housing starts declined year-over-year and month-over-month in every region. The West region’s starts are dangerously close to the pandemic lows. Whenever a housing recovery begins, the West looks sure to suffer even worse supply crunches than it did during the last mania. Housing starts in the Northeast, Midwest, South, and West each changed -1.9%, -14.6%, -16.8%, and -36.4% respectively year-over-year.
Existing Home Sales – October, 2022
The slowing housing market continues to deliver little (aggregate) price relief in the market for existing homes. Absolute inventory even contracted for the third month in a row. Both buyers and sellers are retreating from the market.
Existing home sales dropped for a ninth month in a row and the pace returned to the steep decline from earlier in the year. The seasonally adjusted annualized sales in October of 4.43M decreased 5.9% month-over-month from the unrevised 4.71M in existing sales for September. Year-over-year sales decreased 28.4%. Sales remain below the pre-pandemic existing home sales activity between 5.0M to 5.5M in 2019 and 2018. Sales were last this low in 2012 excluding the crash at the onset of the pandemic.

(For historical data from 1999 to 2014, click here. For historical data from 2014 to 2018, click here) Source for chart: National Association of Realtors, Existing Home Sales© [EXHOSLUSM495S], retrieved from FRED, Federal Reserve Bank of St. Louis, November 28, 2022.

October’s absolute inventory level of 1.22M homes decreased 2.4% from September. According to the NAR, “unsold inventory sits at a 3.3-month supply at the current sales pace, up from 3.1 months in September and 2.4 months in October 2021.” The on-going tightness in inventory means that the housing market is experiencing a different kind of recession: both buyers and sellers are waning. Recessionary conditions are more evident in the least affordable parts of the country. Per the NAR, “the impact is greater in expensive areas of the country and in markets that witnessed significant home price gains in recent years.”
Despite the drop in inventories, the time it took for buyers to take a home off the market remains comparable to earlier months. The average 21 days it took to sell a home in October was two above the 19 days in September and up from 18 days a year ago. The 64% of homes that sold within one month is a notable decline from the 70% in September and 81% in August. In other words, buyers are less and less enthused by what is left for sale.
Prices continue to creep sequentially downward. The median price of an existing home decreased 1.1% month-over-month to $379,100 and jumped 6.6% year-over-year. Prices have increased year-over-year for 128 straight months, an on-going record streak. However, if current trends sustain, then January or February of 2023 may finally break this amazing streak of year-over-year price gains. The media will likely go into a reporting frenzy when the streak finally ends; the event will be treated like the final confirmation of housing doom.
The sequential price decline did not stir incremental interest in first-time home buyers. Their share of sales fell to 28% from September’s 29% and the 29% a year ago. The NAR’s 2017 Profile of Home Buyers and Sellers reported an average of 34% for 2017, 33% for 2018, 33% for 2019, 31% for 2020, 34% for 2021, and 26% for 2022. The share for 2022 is the lowest on record for the NAR (the number must include revisions as I do not recall many readings below 26% over the past year).
All regions declined significantly in sales year-over-year with the two biggest regions once again suffering the largest losses. The regional year-over-year changes were: Northeast -23.0%, Midwest -25.5%, South -27.2%, West -37.5%. Each region also suffered month-over-month declines.
The South’s 13-month streak for out-pacing regional price gains finally came to an end. The Northeast matched the South’s 8.0% year-over-year increase in median price. The South also ended a 12-month streak of double-digit price gains. Still, the rush for more attractive and affordable housing in the South looks alive and well on a relative basis. The regional year-over-year price gains were as follows: Northeast +8.0%, Midwest +5.9%, South +8.0%, West +5.3%.
Single-family home sales decreased 6.4% from September and declined on a yearly basis by 28.2%. The median price of $384,900 was up 6.2% year-over-year.
California Existing Home Sales – October, 2022
Existing home sales in California continued their steady grind lower after August’s quick jump in sales. Almost all the news the California Association of Realtors (C.A.R.) reported sits between bad and alarming.
The C.A.R. reported that “existing, single-family home sales totaled 274,040 in October on a seasonally adjusted annualized rate, down 10.4 percent from September and down 36.9 percent from October 2021.” Sales fell to levels last seen in February, 2008. The last time sales fell this much year-over-year was in December, 2007. The downtrend in the year-over-year change in California existing home sales extended to a 16th month. Like September’s sales decline, October’s sales decline was broadly based. Each price segment fell by at least 30% year-over-year. In September, homes priced below $300K fell the most. This time, homes priced between $750,000 and $999,999 fell the most at 40.8% year-over-year.
The median price dropped 2.5% month-over-month and increased 0.3% year-over-year. Normalized by square footage, the median selling price of an existing home in California increased 3.9% year-over-year.
Bidding wars were rapidly fading from California’s market before October’s apparent pause in the trend. The statewide sales-price-to-list-price ratio stayed below 100.0% for the third month in a row, sitting at 97.3% in October versus 97.7% the previous month and 101.5% a year ago. The median time to sell a home in California increased from 19 days in August to 22 in September to 24 in October. The duration was just 11 days a year ago.
Inventory resumed its ascent going from September’s 2.9 months to 3.3 months for the Unsold Inventory Index (UII). The UII was 1.8 a year ago. C.A.R. did not provide an aggregate change in active listings for the state. Forty-seven of 51 counties experienced an increase in active listings.
Surprisingly, in spite of all these numbers, C.A.R. President Jennifer Branchini projected that “…the market bottom could be in sight.” Without further explanation, I can only guess that this optimism comes from an assumption that interest rates have finally peaked. This proclamation at least supports the seasonal trade in home builders given the stock market will price in anticipation of an imminent bottom. C.A.R. Vice President and Chief Economist Jordan Levine added that “we can expect additional tempering in housing demand in the coming months, as we previously forecasted.”
New Residential Sales (Single-Family) – October, 2022
New home sales delivered a respite from the bad news. These sales showed a slight bit of resilience with another month-over-month jump. I suspect the efforts home builders are making to extend incentives and attractive financing options are keeping new home sales aloft where such options are rarely available in the existing home market except through lenders like Rocket Mortgage.
October new single-family home sales of 632,000 were up an impressive 7.5% from September’s 588,000 (revised down). Sales were down 5.8% year-over-year. The key support at 550,000 in sales continues to hold.
![Source: US. Bureau of the Census, New One Family Houses Sold: United States [HSN1F], first retrieved from FRED, Federal Reserve Bank of St. Louis, November 29, 2022](https://drduru.com/onetwentytwo/wp-content/uploads/2022/11/221129_New-Home-Sales.png "new home sales")
A major shift away from the $300,000 to $499,999 price range helped drive the median price for a new single-family home to a new all-time high of $493,000. The $500,000 to $749,999 price range soared in share from 27% to 33% which appears to be an all-time high.
I looked at the records going back to 2015 when the median price was $305,000 and share for this price range was only in the single digits. It is highly unlikely the share of of $500,000 to $749,999 range could go above even 25% with ever lower median prices. I do not know what to make of this dramatic shift. It is possible the middle of the market ran to the lower tiers for affordability, leaving the households of means to dominate share. The $200,000 to $299,999 and the $500,000 to $749,000 prices were the two price tiers to sequentially gain in absolute sales. I will be looking to see whether this shift is more than a 1-month blip.
The sequential sales increase took inventory down slightly from 9.0 months of sales in September to 8.9 months in October. The market is over-supplied given it sits above the 6.0 level that is the benchmark for a balanced market.
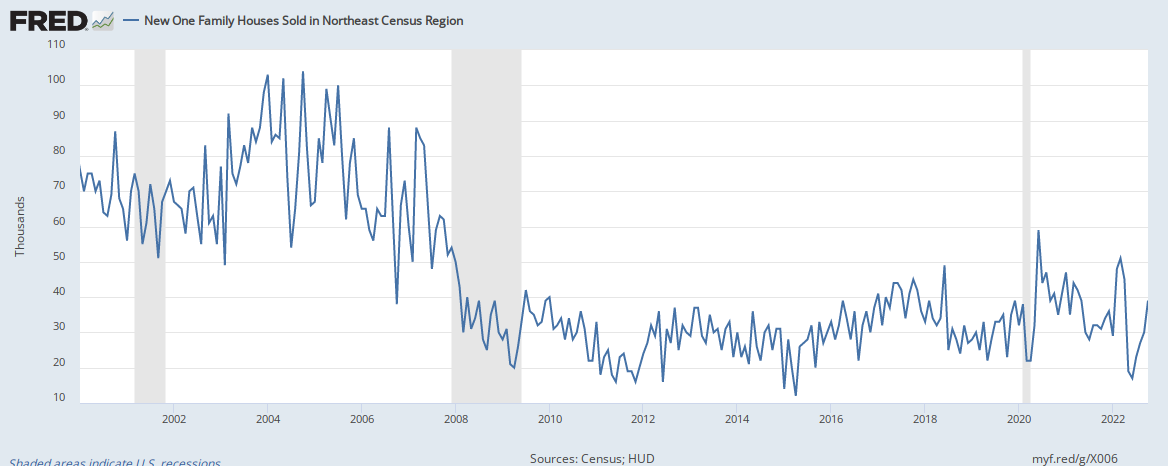
The year-over-year decline in sales was led by the West while the Northeast soared. The Northeast, Midwest, South, and the West changed +59.4%, -26.5%, -0.3%, and -22.8% respectively. The Midwest ended a brief 2-month streak of gains after 10 straight months of significant declines.
The rebound in the Northeast is stunning. New home sales in the region soared from a 7-year low in June toward the high set in March of this year. Given November’s plunge in sentiment in the Northeast (see below), I do not expect this rebound to continue higher.
Home Builder Confidence: The Housing Market Index – November, 2022
The Housing Market Index (HMI) dropped for the eleventh straight month. November’s plunge to 33 planted the HMI deeper into housing recession territory. Excluding the trough of the pandemic, the HMI was last this low in June, 2012, near the trough of the last housing recession. In a further sign of distress, consumer sentiment ended its recovery in recent months with a small decline. The downtrend in consumer sentiment looks set to continue. All three HMI components declined at similar month-over-month paces. A synchronized race to return to the lows of the pandemic seems well underway.
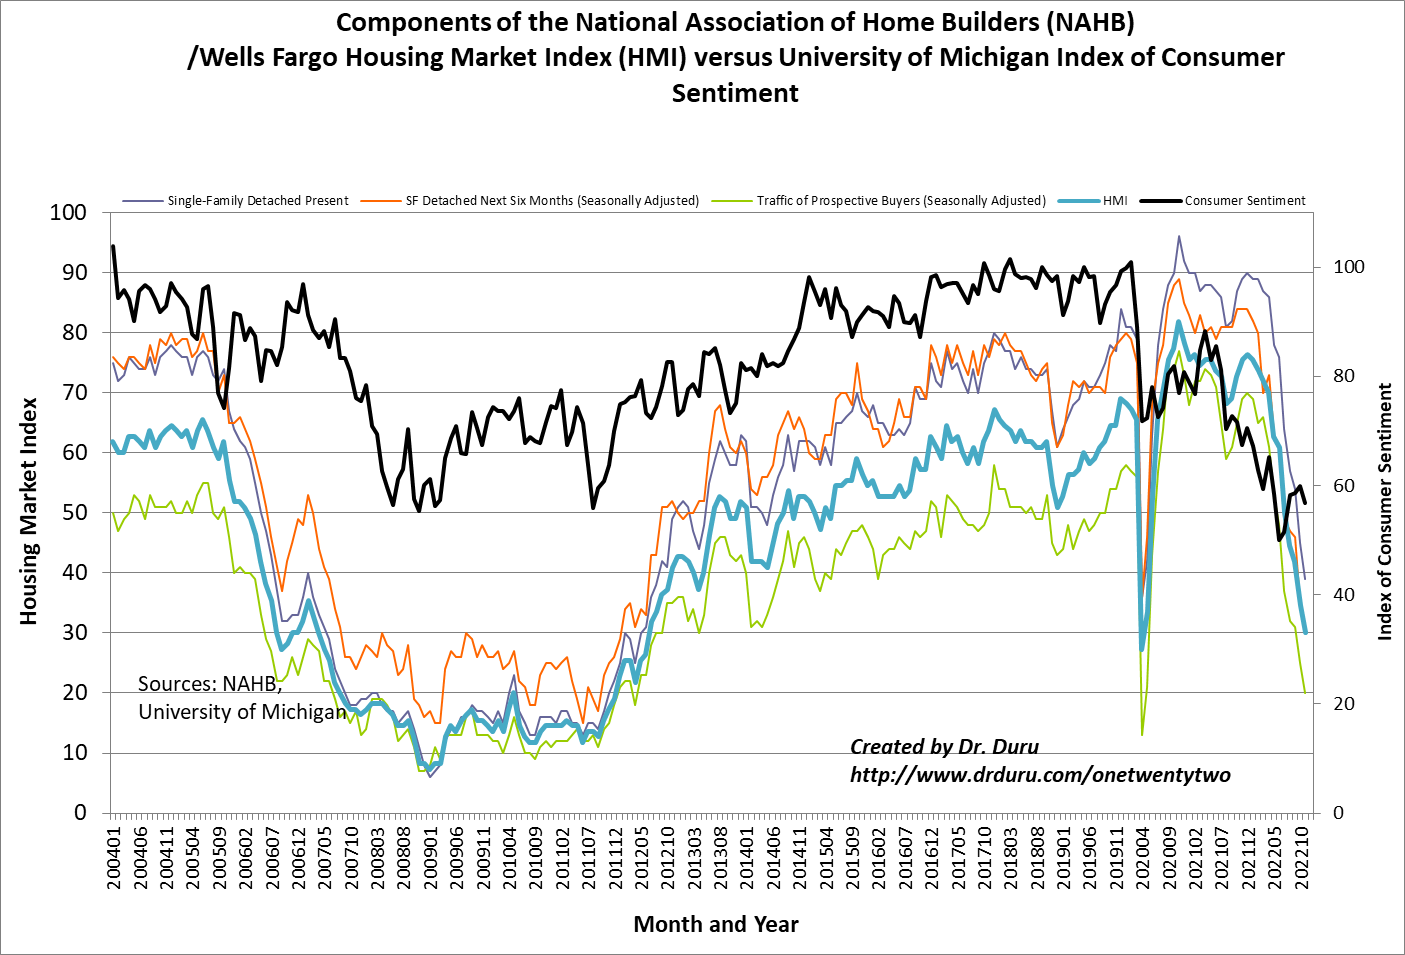
Source for data: NAHB and the University of Michigan
The National Association of Home Builders (NAHB) identified familiar drivers for the on-going plunge in sentiment summed up by the “declining affordability conditions that are pushing more buyers to the sidelines.” Builders are suffering a double-whammy of vaporizing demand from higher rates that are meant to bring down inflation while labor and material costs have remained stubbornly high. Price concessions are adding to builder stress:
“…59% of builders report using incentives, with a big increase in usage from September to November. For example, in November, 25% of builders say they are paying points for buyers, up from 13% in September. Mortgage rate buy-downs rose from 19% to 27% over the same time frame. And 37% of builders cut prices in November, up from 26% in September, with an average price of reduction of 6%. This is still far below the 10%-12% price cuts seen during the Great Recession in 2008.”
The regional changes in HMI were surprisingly divergent. Just one month after enjoying a 1-point increase (that is now revised downward to flat with September), the Northeast plunged from 47 to 30. This rapid decline took the Northeast from a 2019 low to a 2014 low even as new home sales just leapt in the exact opposite direction. The Midwest fell from 37 to 36. The South plunged for a second month in a row, this time from 41 to 34. Similar to the Midwest, the South last saw this level in July, 2012. The West received a respite from levels last seen in January, 2012 with a gain from 25 to 28. The NAHB did not offer an explanation for the West’s bounce, but I have to assume the move is just a temporary respite.
Home closing thoughts
Spotlight on Mortgage Rates
Mortgage rates made big headlines after making their largest one-day plunge on record (since 2009). Yet, rates remain close to 7%. A week ago, the 30-year mortgage rate came down to 6.6%. In a display of the sensitivity to mortgage rates, the Mortgage Bankers Association (MBA) reported a small jump in the volume of mortgage applications as rates fell. In the past week, volume increased 2.2%. The prior week delivered a 2.7% weekly increase in volume. In other words, the price sensitivity in the market works both ways. If rates even stop going up from here, home buyers could surprise everyone as they enjoy the respite in the rate environment.
![Sources include: Board of Governors of the Federal Reserve System (US), Market Yield on U.S. Treasury Securities at 30-Year Constant Maturity [DGS30], retrieved from FRED, Federal Reserve Bank of St. Louis and Freddie Mac, 30-Year Fixed Rate Mortgage Average in the United States [MORTGAGE30US], retrieved from FRED, Federal Reserve Bank of St. Louis, May 1, 2022](https://fred.stlouisfed.org/graph/fredgraph.png?g=Q7uT)
Be careful out there!
Full disclosure: long ITB shares, long SPY calendar call spread, long RKT
1 thought on “A Respite from Rising Rates – Housing Market Review”