
AT40 = 53.7% of stocks are trading above their respective 40-day moving averages (DMAs)
AT200 = 52.7% of stocks are trading above their respective 200DMAs
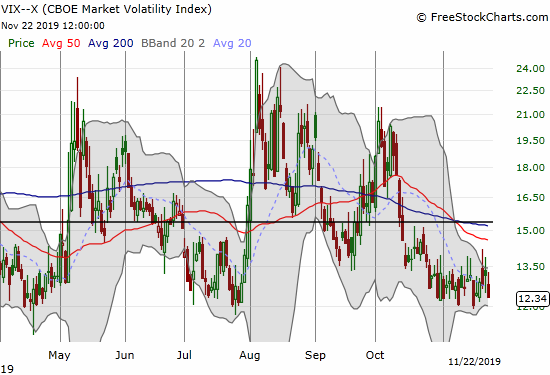
VIX = 12.3
Short-term Trading Call: neutral
Stock Market Commentary
The S&P 500 (SPY) pulled back slightly last week as the stock market’s underlying bearish divergence finally proved too heavy. Yet, the pullback was extremely mild especially relative to the political drama unfolding with impeachment hearings in the U.S., Hong Kong erupting into a spreading revolt, and on-going gyrations with the on-again, off-again partial deal in the Trade War. All things considered, the stock market’s behavior is quite consistent with a seasonally strong period for stocks. As the stock market’s stubborn resilience seems to grow, it gets increasingly hard to fathom a catalyst that can trigger a real pullback. In the absence of such a reset, I am bracing for a strong rally that surprises everyone yet leads into a big blow-off top early next year.
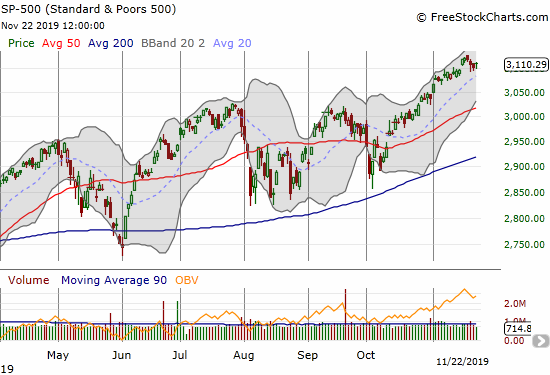
AT40 (T2108), the percentage of stocks trading above their respective 40-day moving averages (DMAs), sagged with the S&P 500 as the two indices finally synchronized. Bulls could not have asked for a milder resolution to the prevailing bearish divergence. AT40 closed the week at 53.7%. Thursday’s close was a 5-week low.
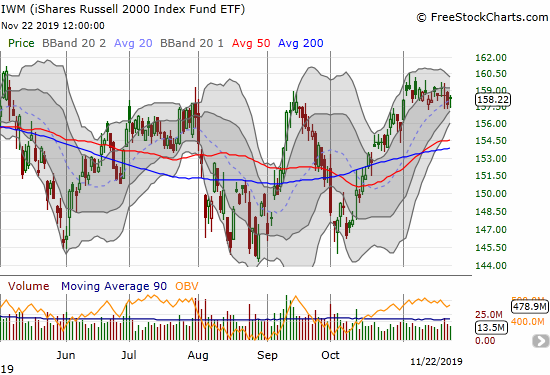
The iShares Russell 2000 Index Fund ETF (IWM) is one of many places to see the lack of participation in the recent rally. I bought IWM call options optimistically thinking last week would finally deliver the breakout. That trade completely failed.
Volatility
The volatility index (VIX) has failed to break below 12 all month. If a strong rally and blow-off top is coming, a VIX break below 12 might provide a great confirming signal of what is to come.
A Broken Financial System?
For bears stretching to find reasons to continue hating the stock market, the recent drama around the repo system has provided plenty of fodder. A good friend of mine has recently regaled me with lots of related alarm bells. Given the stated dysfunction and underlying rot described in the video below (banks are not supplying the expected liquidity despite the apparent financial incentives to do so), I am led to be even more impressed that the economy and markets have done as well as they have these past 10 years. I am trying hard not to be complacent like everyone else about this latest bear bait, but it is not easy! For now I am assuming my technical signals will keep well-prepared to pivot when/if the time comes for the next financial disaster.
Stock Chart Reviews – Below the 50DMA
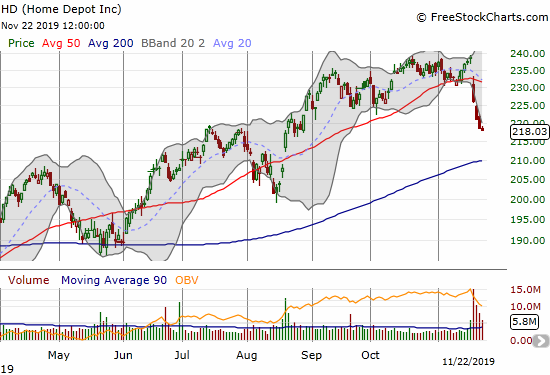
Home Depot (HD)
Home Depot (HD) suffered a very bearish post-earnings breakdown. The selling caught me completely off-guard. I looked at the strength of HD going into earnings as confirmation of the company’s solid standing in the retail sector. With Lowe’s Companies (LOW) breaking out post-earnings, I have to reset my thinking on the “holidays mismatch” between LOW and HD!
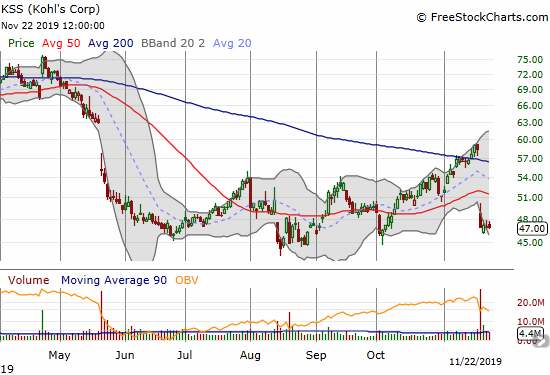
Kohl’s (KSS)
Kohl’s (KSS) threw its hat into the ring of alarm bells for retail. A 200DMA breakout ahead of earnings was a classic head fake. KSS is a short with a tight stop above the 50DMA.
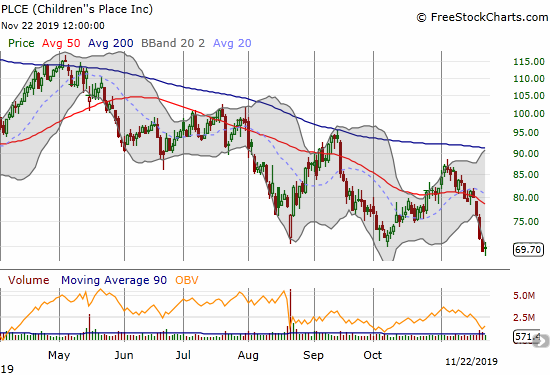
Children’s Place (PLCE)
I have been trying to like Children’s Place (PLCE) for some time now. Yet, the stock continues to disappoint with false 50DMA breakouts and failures to punch through 200DMA resistance. Last week’s 3 1/2 year low tells me that this stock, and perhaps the company, is truly broken. I am no longer looking for new entry points to go long even as the stock seems to be stuck in a well-defined pattern of rallies and setbacks around and below its major trendlines. Note Friday’s modest rebound seems to signal the stock is on schedule for its next rebound.
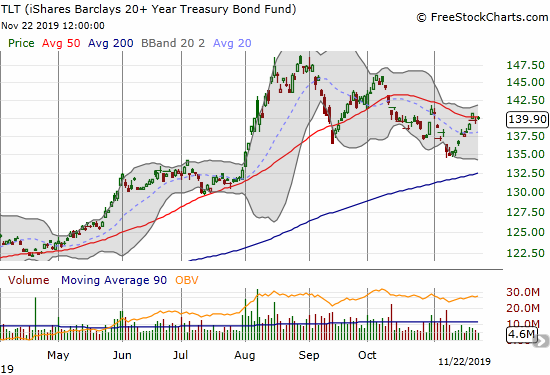
iShares Barclays 20+ Year Treasury Bond Fund (TLT)
My March call spread on the iShares Barclays 20+ Year Treasury Bond Fund (TLT) turned out to be quite fortuitous. I expected to wait through churn until at least the end of the year. Now I am faced with a tantalizing test of the 50DMA that makes me want to take profits and look for a new entry point at lower levels. I will likely preserve profits if TLT falls below $139.
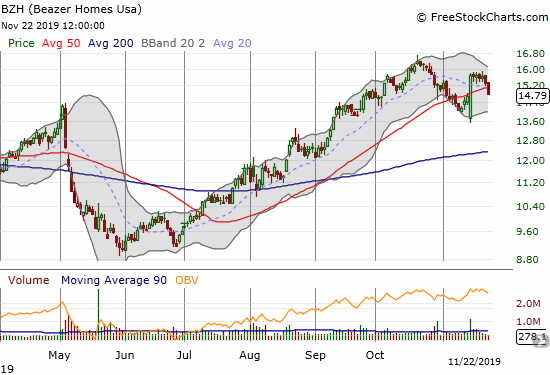
Beazer Homes (BZH)
Beazer Homes (BZH) has enjoyed an incredible run-up from its May/June low. The stock looked set to print a double until the iShares Dow Jones Home Construction ETF (ITB) stalled out right at its climactic January, 2018 high. Buyers finally showed up again to pick the stock up from a post-earnings gap down. The sellers showed up again last week, and I strongly suspect BZH is now in the middle of an extended topping process. Certainly, a fresh rally in interest rates will take down speculative builders like BZH.
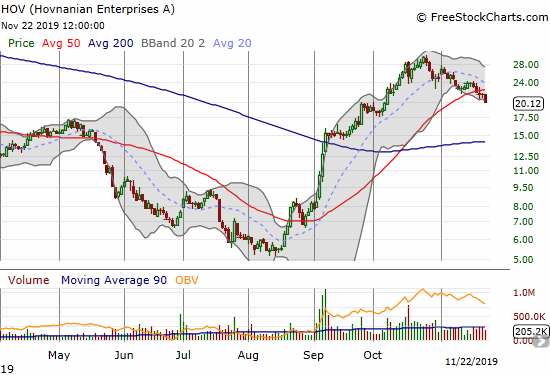
Hovnanian Enterprises (HOV)
Hovnanian Enterprises (HOV) is a quintessential speculative home builder; it is the lowest quality builder in the universe I follow/watch. In August, HOV scraped at the $5 level with an all-time low. Yet, HOV revived alongside the big August breakout in home builders. In just two months the stock increased over 5x in value. The topping in home builders has helped shave a quick 33% in value from HOV. With a 50DMA breakdown in place, I expect HOV to trade a lot lower in the near future…especially if interest rates rally again.
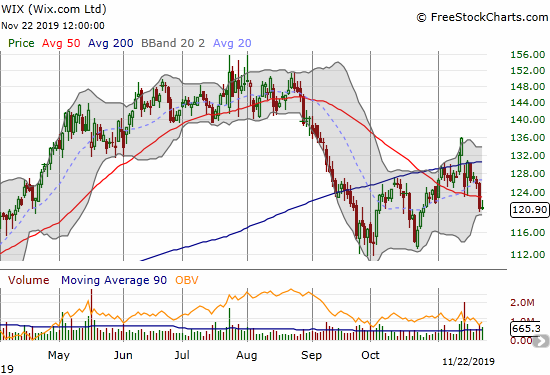
Wix.com (WIX)
Wix.com (WIX) helps people build websites. This seems like such a commoditized business at this point in the internet’s maturity. Yet, WIX is thriving. Despite the recent breakdown, investors are still willing to pay a lofty valuation for WIX: 90.9 forward P/E, 8.6 price/sales, and 30.9 price/book. I am surprised only 2.5% of the float is sold short. (Data from Yahoo Finance.)
Stock Chart Reviews – Above the 50DMA
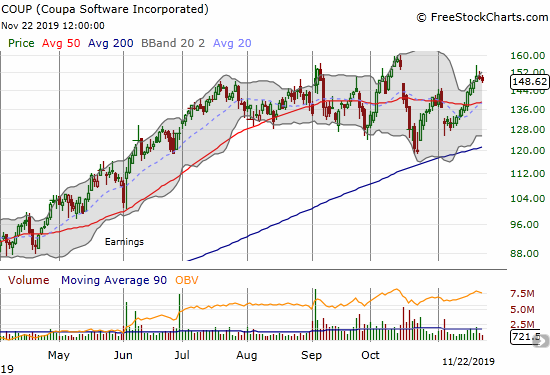
Coupa Software (COUP)
For months, software stocks have fallen in and out of favor in rapid succession. Coupa Software (COUP) is one of many stuck in this maddening churn. While COUP survived a near test of 200DMA support last month, the churn in the stock is widening which tells me a big breakout or breakdown is on the way. I have been keeping an eye on this one.
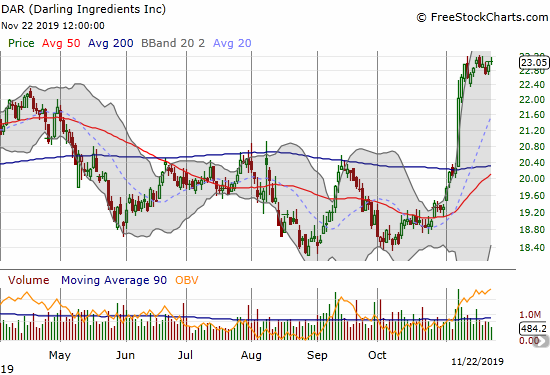
Darlington Ingredients (DAR)
Darlington Ingredients (DAR) has a fascinating business. From its website:
“At Darling Ingredients, we contribute… [create] sustainable food, feed and fuel ingredient solutions. We take the meat by-products from our animal-based diets, and process them to reclaim valuable and essential bio-nutrients, fats, oils, proteins, meals and more that are used daily in personal, commercial, and industrial products. Our natural and sustainable ingredients are marketed internationally to the pharmaceutical, food, animal feed, pet food, biofuel, fertilizer, sports nutrition and cosmetic industries. “
The company has been around since 1882 and now has 200 operating facilities on 5 continents. The stock surged this month after positively received earnings and almost hit its all-time high. This is a stock I will chase on a breakout. The stock’s all-time high is now a ripe old 6 years and running.
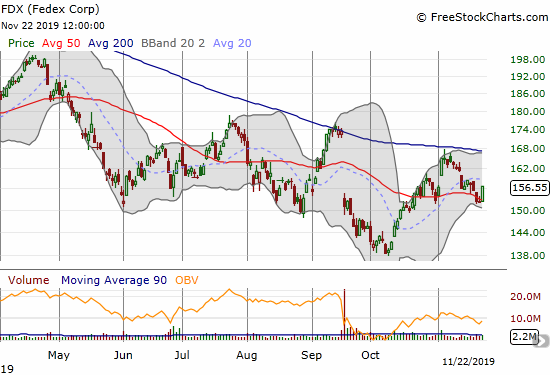
Federal Express (FDX)
Federal Express (FDX) continues to struggle. Its stock says everything. However, the small pop on Friday off 50DMA support provides a modicum of hope that the stock can avoid making a new multi-year low.
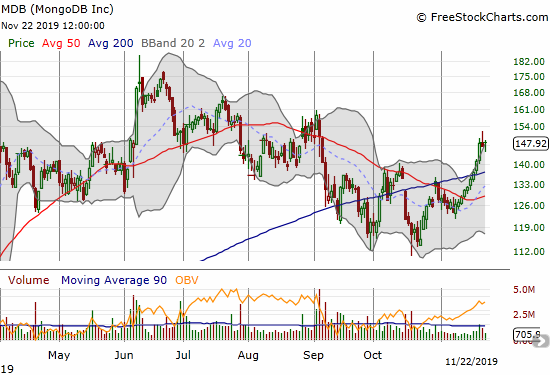
MongoDB (MDB)
Unlike Coupa Software (COUP), MongoDB (MDB) has not recovered to recent highs on the latest upswing in sentiment for software stocks. I only partially participated in the strong rally through 200DMA resistance. I am now looking to buy into a pullback.
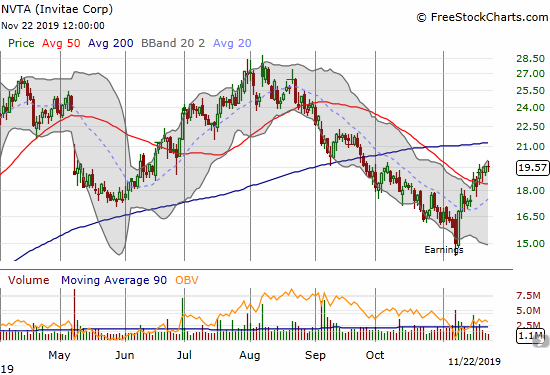
Invitae (NVTA)
I first mentioned Invitae (NVTA) over two months ago as it rebounded from 200DMA support. That buying opportunity quickly turned southward. I stuck with the investment as I firmly believe in the company. So when the stock sharply turned around from a post-earning sell-off earlier in the month, I rushed in to add to my position. A 50DMA breakout looks like it has confirmed a bottom in the stock.
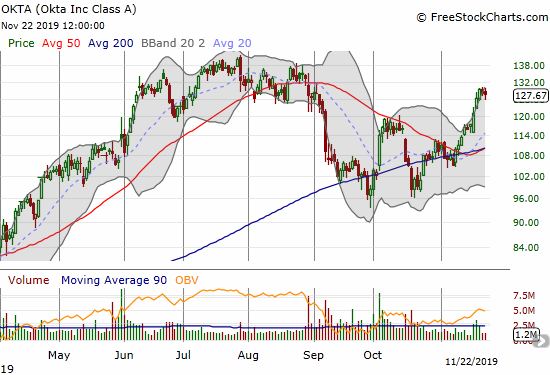
Okta (OKTA)
Buying Okta (OKTA) off its 200DMA support has finally paid off with the rally this month.
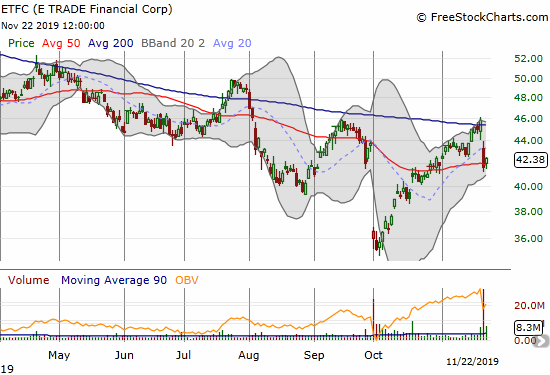
E*Trade Financial (ETFC)
I left the broker stocks for dead after the rush to zero commissions collectively clocked the industry in early October. I only noticed the sharp recovery after Schwab (SCHW) caused a stir in offering to buy (vulernable?) Ameritrade (AMTD). E*Trade Financial (ETFC) sold off in sympathy. This time I treated the selling as a buying opportunity and bought call options on the test of 50DMA support. I will buy shares if the stock reverses at least 50% of its gains from its rebound.
With hindsight, the extreme of selling last month in the brokers was a classic opportunity to go contrary. The steady decline of a stock like ETFC going into the zero commission news was the classic behavior of sellers in the know getting out of the way of bad news. The bad news itself flushed out the remaining sellers who had been ignoring the bad signs. The subsequent buying represented a recognition that things may not get worse going forward.
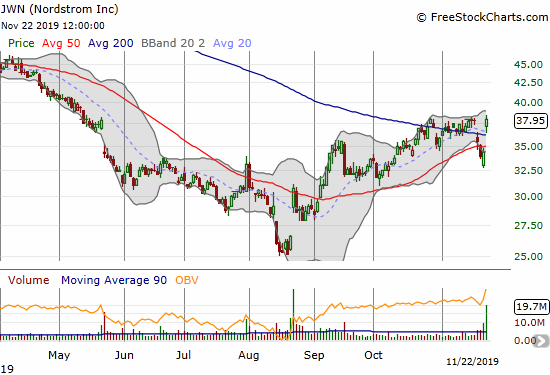
Nordstrom (JWN)
Nordstrom (JWN) is still one of my favorite retailers to trade even though I have not touched the stock in a long time. JWN’s impressive post-earnings breakout on Friday has me finally ready to buy again.
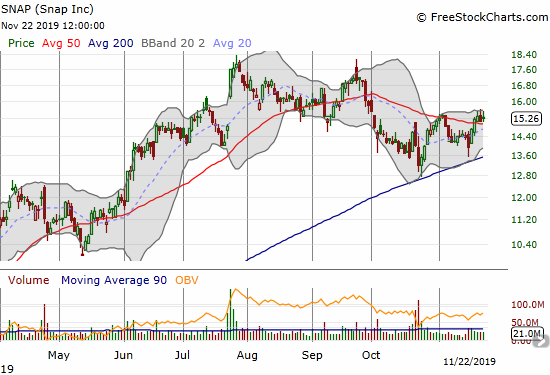
Snap (SNAP)
Snap (SNAP) seemed to print a double top between July and September. However, the stock has survived two tests of 200DMA support and last week closed above its 50DMA. If the stock is topping, the process looks like it will be very extended.
— – —
FOLLOW Dr. Duru’s commentary on financial markets via email, StockTwits, Twitter, and even Instagram!
“Above the 40” uses the percentage of stocks trading above their respective 40-day moving averages (DMAs) to assess the technical health of the stock market and to identify extremes in market sentiment that are likely to reverse. Abbreviated as AT40, Above the 40 is an alternative label for “T2108” which was created by Worden. Learn more about T2108 on my T2108 Resource Page. AT200, or T2107, measures the percentage of stocks trading above their respective 200DMAs.
Active AT40 (T2108) periods: Day #218 over 20%, Day #57 over 30%, Day #32 over 40%, Day #29 over 50% (overperiod), Day #5 under 60% (underperiod), Day #45 under 70%
Daily AT40 (T2108)
")
Black line: AT40 (T2108) (% measured on the right)
Red line: Overbought threshold (70%); Blue line: Oversold threshold (20%)
Weekly AT40 (T2108)

*All charts created using FreeStockCharts unless otherwise stated
The T2108 charts above are my LATEST updates independent of the date of this given AT40 post. For my latest AT40 post click here.
Be careful out there!
Full disclosure: long VIXY calls, long OKTA, long EFTC call options, long TLT calls and call spread, long NVTA
*Charting notes: FreeStockCharts stock prices are not adjusted for dividends. TradingView.com charts for currencies use Tokyo time as the start of the forex trading day. FreeStockCharts currency charts are based on Eastern U.S. time to define the trading day.