
Housing Market Intro/Summary
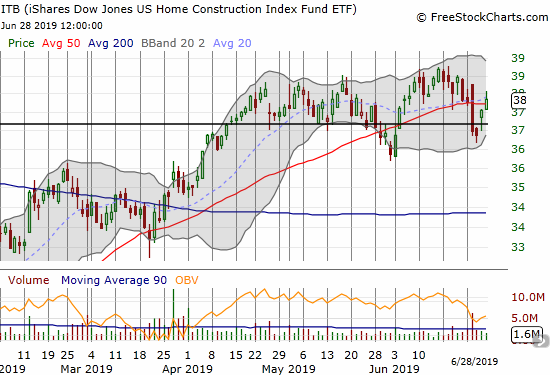
After writing the last Housing Market Review, I was convinced a triple top had appeared in the iShares US Home Construction ETF (ITB). The May sell-off in the stock market pushed ITB into a breakdown below its 50-day moving average (DMA). Immediately after that post, ITB rebounded right through its 50DMA and even broke through the triple top for a brief moment. After an earnings-driven sell-off last week, ITB still looks like it is printing an extended top but pivoting around its 50DMA and around the point where the major October, 2018 sell-off started (the dark horizontal line in the chart below).
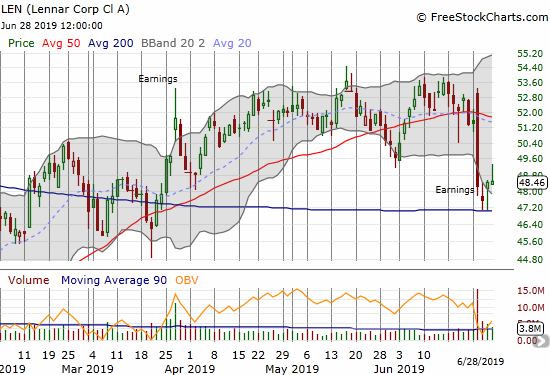
Lennar (LEN) was the stock that took ITB down last week. The stock initially gapped higher and rallied in response to earnings. During the conference call, the stock plunged so far it almost closed at its 200DMA with a 6.2% loss. That test happened over the next two days. LEN closed the week with a feeble rebound. The dramatic nature of the trading compelled me to review the conference call; I will post my observations in a separate post.
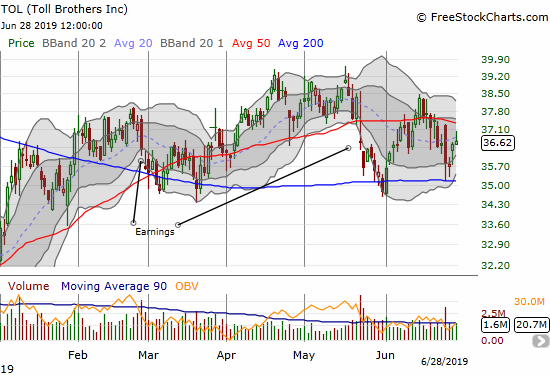
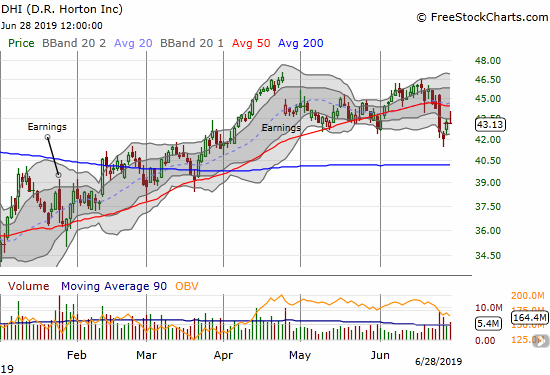
The poor response to Lennar’s results generated sympathy selling in other large and regionally diverse home builders. Toll Brothers (TOL) dropped 1.9% after first gapping into overhead 50DMA resistance. D.R. Horton (DHI) suffered even more with a 3.9% drop that created new post-earnings lows for two days.
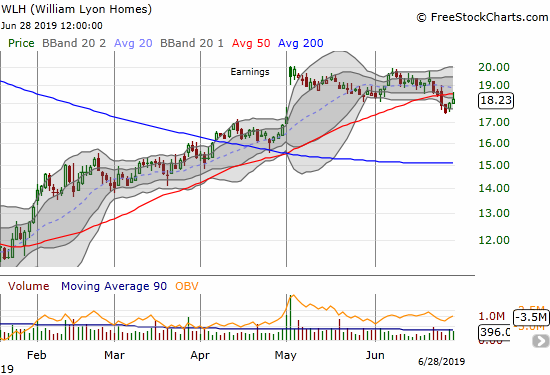
The sympathy selling even hit William Lyons Homes (WLH), a stock with recent post-earnings strength. I featured it in the last Housing Market Review. The stock looked refreshed at the beginning of June but stalled soon thereafter. Now the stock looks weak enough to finish filling its post-earnings gap up from May.
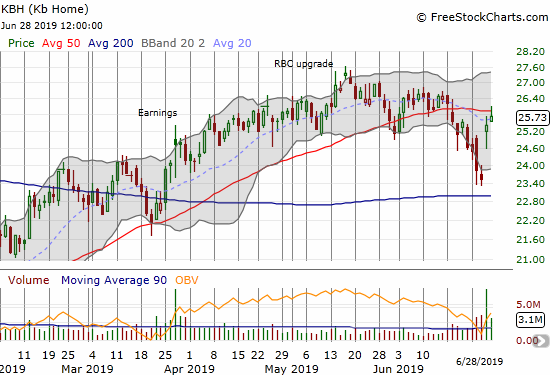
KB Home (KBH) experienced a strong post-earnings rebound – probably because Lennar helped drive so much negativity going into the company’s earnings report. Still, I was surprised at the strength of the response, so I reviewed the earnings conference call. Management was quite bullish on both demand and margins. Their optimism interestingly flies in the face of the macro housing data, particularly in California where KBH conducts a significant amount of its business. I will write more details about my observations in a future post.
I tried out a hedged trade going long a July/Oct calendar call spread at the $26 strike and puts at the $24 strike. I am betting that either KBH will rapidly reverse its post-earnings gains or will stall again around its 50DMA before taking off in a pre-seasonal rally based on management’s optimism. This structure provides a testing ground for a trade structure I will implement for ITB by the end of August.
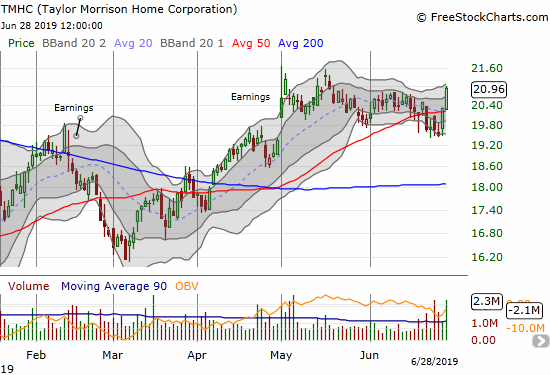
Taylor Morrison Home (TMHC) somehow managed to end the week on a very strong note. After sagging to a marginally new post-earnings low, buyers rushed in to take the stock right through 50DMA resistance on no news that I could find. This trading action is enough for me to make an exception to my rules on trading home builders. I generally avoid buying until or in anticipation of the seasonally strong period from November to April. I have been itching to get into TMHC since last year, so I am admittedly biased for action on this one! TMHC is still very cheap at 1.0 price/book and 0.5 price/sales. Its trailing P/E is 11.2 while its forward P/E is 7.4 (data from Yahoo Finance). Interestingly, KBH has almost the exact same valuation metrics.
Home builders are at a fascinating economic juncture. Demand picked up this year from the 2018-ending plunge precisely with the rapid drop in mortgage rates. Exceptionally low rates are the main driver propping up demand. I continue to think a lot of demand is being pulled forward as buyers want to make sure they do not miss this opportunity again. With prices continuing to outpace wage gains, loan structure is extremely important.
Yet at some point, the anticipated slowing of economic growth that drove rates so low is going to catch up with housing demand. If the bond market starts to price in higher inflation and/or stronger economic growth, the resulting increase in mortgage rates could bring a fresh chill in the housing market. In other words, I have low expectations for the rest of this year.
New Residential Construction (Single-Family Housing Starts) – May, 2019
After a sudden burst of activity to start the year, housing starts quickly cooled off.
Single-family housing starts for April were revised upward from 854,000 to 876,000. May starts decreased month-over-month by 6.4% to 820,000. On an annual basis, single-family housing starts decreased by 12.5%. The January surge is a confirmed anomaly in the middle of a downtrend: it remains the only month since September to register a year-over-year gain in starts.
Last June’s year-over-year decline was the first for housing starts since August, 2016, and June’s level sat as the lowest of the year until the October to December plunge. So far, 800,000 starts is the approximate level of support for 2019.
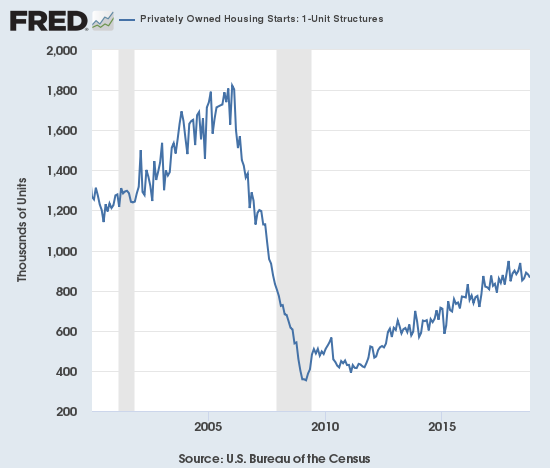
Source: US. Bureau of the Census, Privately Owned Housing Starts: 1-Unit Structures [HOUST1F], retrieved from FRED, Federal Reserve Bank of St. Louis, June 21, 2019.
The West’s on-going declines in starts finally took a break in April, but resumed in May along with all other regions. All but one of the declines was substantial. The Northeast, Midwest, South, and West each changed -25.8%, -27.6%, -5.1%, and -14.5% respectively. With these declines coming toward the end of the Spring selling season, I expect fresh weakness in new home sales later in the year despite the proclaimed optimism from several major builders in recent weeks.
Existing Home Sales – May, 2019
The monthly downtrend for existing home sales ended in February. However, the year-over-year declines continued in May for the 15th straight month. March and April sales data cast doubt on the case for a bottoming in sales, but May’s rebound from April gives more hope to the bottoming thesis.
The seasonally adjusted annualized sales in May of 5.34M were up 2.5% month-over-month from the upwardly revised 5.21M in sales for April. Year-over-year sales decreased 1.1%. Recall that in January, existing home sales were at their lowest level since November, 2015.

(As of the March, 2018 data, the NAR further reduced historical data to just 13 months. For historical data from 1999 to 2014, click here. For historical data from 2014 to 2018, click here) Source for chart: National Association of Realtors, Existing Home Sales© [EXHOSLUSM495S], retrieved from FRED, Federal Reserve Bank of St. Louis, June 22, 2019.
The National Association of Realtors (NAR) celebrated May sales as delivering the numbers it “expected.” Ironically, the now regular plea to home builders for more new inventory fell on closed ears as starts dropped sharply in May. In contrast, the inventory of existing homes has increased 10 months in a row with median prices ascending anyway.
Absolute inventory levels increased from 1.87M a year prior to 1.92M in May. Based on months of supply, inventory changes all pointed ever so slightly higher: “Unsold inventory is at a 4.3-month supply at the current sales pace, up from both the 4.2 month supply in April and from 4.2 months in May 2018.” Recall from the March Housing Market Review that the inventory situation is very different based on price ranges. In March, the most expensive homes, $1M and up, had 10 months of supply while homes in the two lowest tiers only had 3 to 4 months of supply. The NAR did not provide this breakdown for April or May. The (relative) scramble for lower-priced homes is another negative sign for the housing market.
While the median price of an existing home stayed effectively flat month-over-month in January, prices continued their year-over-year ascent in February with a 3.6% year-over-year increase. In March, price growth crept upward to a year-over-year gain of 3.8%, which included the largest nominal increase for a March in history. May delivered the 87th straight annual increase: 4.8%. Again, the evidence does not support the NAR’s on-going claims that rising inventories help affordability. For May, the NAR insisted that robust demand outpaced inventory: “Solid demand along with inadequate inventory of affordable homes have pushed the median home price to a new record high.”
March’s 33% share of first-time buyers was a notable jump over the 30% the year prior. The share dropped to 32% for April and stayed at 32% for May which was up 1% point from a year ago. The average share for first-time homebuyers for 2016 was 35%. The NAR’s 2017 Profile of Home Buyers and Sellers reported an average of 34% for 2017 and 33% for 2018.
Investors purchased 13% of homes in May, down significantly from April’s 16% and down from the 14% the year prior. I am surprised by these declines given tumbling interest rates make it a lot easier for speculators and investors to clamor for homes. Investor sales averaged a share of 15% in 2017 and 14% in 2016. I am still awaiting the average for 2018.
February just barely ended a 4-month streak of annual sales declines across all four regions. The broad-based declines resumed in March and continued in April. In May, only the South managed a year-over-year increase, another confirmation of the underlying weakness in existing home sales. The West suffered its eleventh consecutive month with a year-over-year decline. Here are the regional changes: Northeast 0.0%, Midwest -3.9%, South 1.3%, West -3.4%.
As usual, regional sale fluctuations had little to no relationship to the on-going year-over-year price run-ups: Northeast 6.6%, Midwest 5.6%, South 3.6%, West 4.1%.
Single-family sales increased 2.6% from April and decreased on a yearly basis by 0.8%. The median price of $280,200 was up a robust 4.6% year-over-year.
California Existing Home Sales – May, 2019
According to the California Association of Realtors (CAR), sales of existing homes in California hit a 10-year low in January. February’s month-over-month comeback of an 11.8% gain was enough to print a 6-month high and the biggest monthly gain since January, 2011. May sales increased from April by 2.6%, but it was a slight 0.6% year-over-year drop.
February’s median price was the lowest in 12 months. April’s median price jumped 6.5% from March. May’s median price continued the rebound with a 1.4% gain from April. At $611,190, the median price of an existing Californian home increased 1.7% year-over-year. CAR welcomed price softness in March, lamented the high prices in April, and kept up assurances in the face of May’s new record high median price: “While lower interest rates have spurred buyer demand in recent months, they also have played a role in ongoing price hikes…Buyers could offer higher prices without hurting their bottom lines and maintain the same level of affordability, as rates remain on a downward trend. With mortgage rates expected to stay low in the upcoming months, home prices may inch up further for another month or two before cooling off.”
The CAR recognized the affordability conundrum where lower rates may make homes more affordable in the very short-term but the increase buying power in inventory constrained markets facilitates an equilibrium of higher prices. The Federal Reserve lowers rates to help push asset prices higher after all.
May hit two key milestones:
- Sales rose over 400,000 for the first time since July 2018
- May’s year-over-year sales decline was the smallest in 13 months which followed an April had the smallest year-over-decline in 9 months.
New Residential Sales (Single-Family) – May 2019
The stark contrast between existing home sales and new home sales cropped up again. This time, month-over-month new home sales pulled back sharply while existing home sales jumped. The frequent inverse movement is likely a symptom of a market moving in fits and starts with little to no upward momentum.
The Census Bureau revised April sales of new single-family homes upward from 673,000 to 679,000. New home sales for May decreased 7.8% month-over-month and decreased 3.7% year-over-year to 626,000.
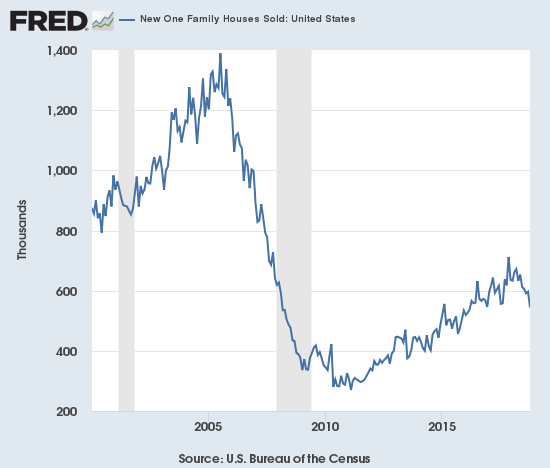
Source: US. Bureau of the Census, New One Family Houses Sold: United States [HSN1F], retrieved from FRED, Federal Reserve Bank of St. Louis, June 26, 2019.
In November, the median sales price of a new single-family home hit its lowest level of 2018 at $308,500. Before that time, prices were last that low February, 2017 ($298,000). After March’s median price dropped 7.5% year-over-year (revised), April’s median price rebounded 6.6% year-over-year to $342,200 (revised). This price stopped just short of the last peak in March, 2018. The revision also pushed the price much lower than the previous record set in November and December, 2017. May’s median price dropped 2.7% year-over-year and was down 8.1% month-over-month.
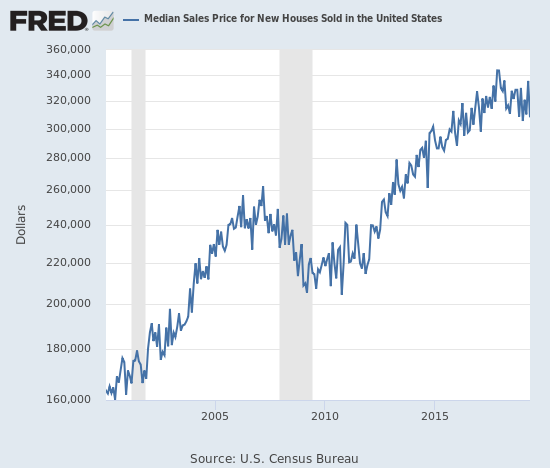
Source: U.S. Census Bureau and U.S. Department of Housing and Urban Development, Median Sales Price for New Houses Sold in the United States [MSPNHSUS], retrieved from FRED, Federal Reserve Bank of St. Louis; June 30, 2019
In June, 2018 the inventory of new homes for sale jumped to 6.0 months of sales, a perfect balance. Inventory trended upward from there until January’s 6.6. Inventory has drifted downward since: 6.1 in February, 6.0 in March, 5.9 in April, and 6.4 in May.
The Northeast suffered yet another double-digit decline in new home sales with a 15.2% drop. The Midwest gained 2.4%. The South gained 1.3%. The West plunged 17.2%, falling back into line with the persistent drops in the West for existing home sales. In the last Housing Market Review I concluded that the momentum in new home sales would “…end in short order”; that time may have already arrived.
Home Builder Confidence: The Housing Market Index – June, 2019
After a rough end to 2018, the Housing Market Index (HMI) steadily crept higher in 2019. After May’s HMI got within 2 points of the October 2018 high of 68, the HMI fell back 2 points to 64 in June. In the last Housing Market Review, I concluded that given HMI stalled at 68 after the 2018 Spring selling season, I did not expect any further gains. I also noted that increasingly challenging conditions in financial markets made me further doubt confidence would increase in coming months. The National Association of Home Builders (NAHB) focused on the range for HMI: “Sentiment levels have held at a solid range in the low- to mid-60s for the past five months.”
The chart below shows that each HMI component fell just slightly after several months of rebounding.
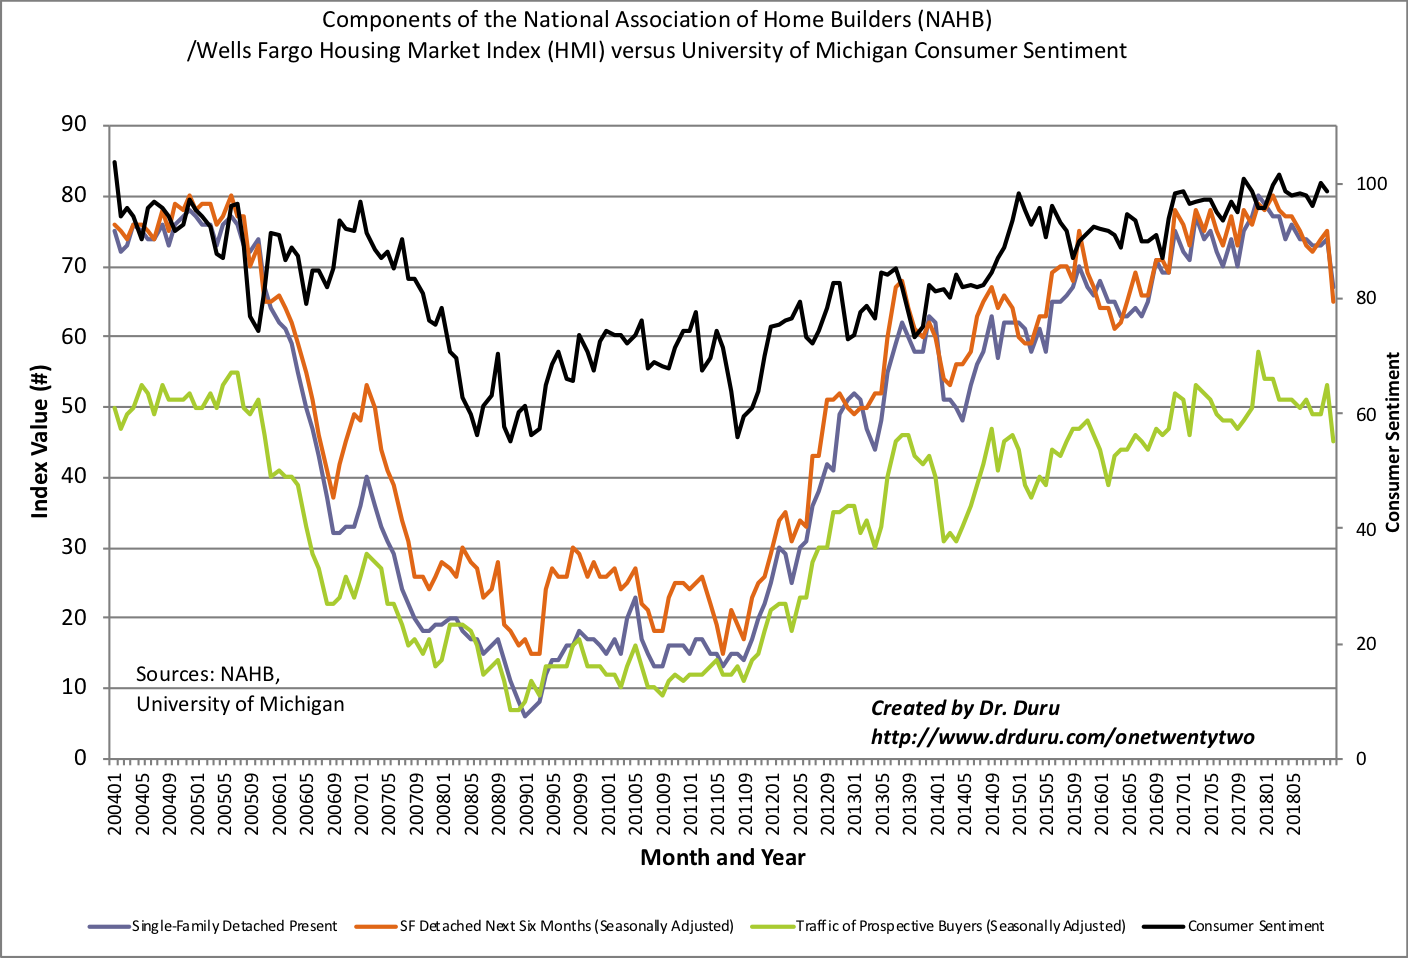
Source: NAHB
The Midwest was the only region that failed to increase its HMI in May. The regions were mixed in June. The Northeast plunged 5 points to 60 after a 10 point (revised) surge in May that took the region to levels last seen during the height of the housing bubble in 2005. While May was not revised downward as I expected, the pullback from such heights is not surprising given economic conditions. The Midwest increased slightly from 56 to 59 (an 11-month high) while the South remained flat at 68 – its high since last October. After delivering a surprise increase in May, the West’s HMI fell back to 69 from 73.
The drop in the West validated my outlook from the previous Housing Market Review. I continue to expect HMI to stay below its current high for the year until at least the Fall when builders start looking forward to the 2020 Spring selling season. However, I think HMI has significant downside risk given sales and/or prices are likely to materialize as expected by this optimistic set of builders.
Parting thoughts
My new pairs trade going long Redfin (RDFN) versus short Zillow Group (Z) has taken some twists and turns since I initiated it. An analyst upgrade gapped RDFN higher on June 11th, and the stock drifted higher into 50DMA resistance. Rather than take profits, I waited for a breakout. Instead of a breakout, RDFN fell hard in sympathy with Lennar. The stock lost enough to break below its 200DMA. RDFN now faces down declining 50DMA resistance again.
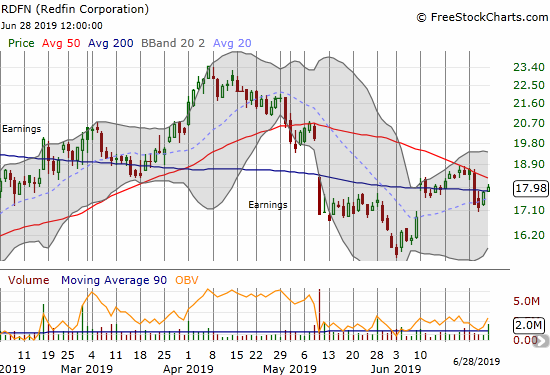
Zillow Group (Z) (ZG) fared better in its rebound. The stock’s out-performance against RDFN has thus returned.
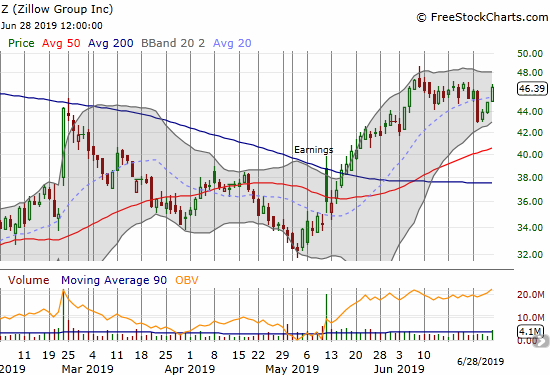
Source for all stock charts: FreeStockCharts
I went from a small profit to a small loss in the pairs trade. Time is running out on the pairs trade with a July 19 expiration on RDFN and July 12 expiration for Zillow. I will look to reload later in the summer.
In other news, pending home sales declined year-over-year for the 17th month in a row. The Marketplace blamed the trend on affordability: 75% of the U.S.’s counties are not affordable for the “average wage” household. Still, they went on to celebrate on the 25% of markets that ARE affordable like Houston, Detroit, Philadelphia, Memphis, Louisville, and Indianapolis.
Be careful out there!
Full disclosure: long RDFN calls, long Z puts, long KBH calendar call spread, long KBH puts