
Housing Market Intro/Summary
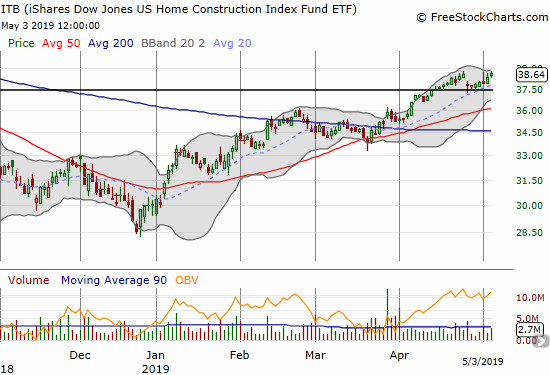
In the March Housing Market Review, I described how the iShares US Home Construction ETF (ITB) was breaking out despite an unimpressive collection of housing data (in the aggregate and trendwise). Last month, I updated my analysis of the seasonal trading strategy for home builders and pointed out the historical tendency for ITB to top out by April both in absolute terms and versus the S&P 500 (SPY). Last week proved that ITB is determined to do its best to beat the seasonal patterns and the shaky underlying macro data. ITB closed the week 10 cents above the April peak riding some very strong market reactions to the earnings reports of individual home builders.
This period is significant for home builders as sentiment in the space tends to be skeptical, wary of the cliff around the corner, and thus lags good data. Now, sentiment is strong and perhaps strengthening despite the questionable data. In other words, forward-looking optimism is running high. I need to do what I can not to dismiss this sentiment.
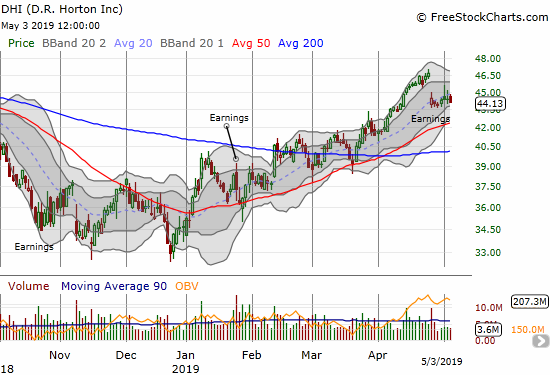
The big gap down on April 25th seemed to confirm that ITB would top in April. The drop was caused by a poor reaction to the earnings report from D.R. Horton (DHI). The company guided revenue down slightly versus consensus and talked about weakening pricing power (seen in the macro data below). Given DHI’s broad geographical reach, many home builders fell in sympathy.
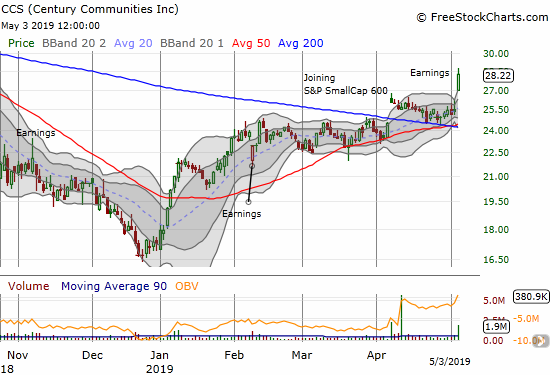
There are individual home builders whose stories are definitely bucking the seasonal trends. Century Communities (CCS) made a bullish breakout last month on news the stock would join the S&P SmallCap 600. The stock languished from there until an exceptionally strong reaction to its earnings report.
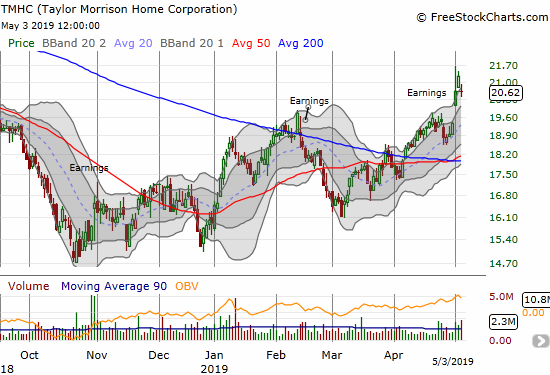
I dropped the ball on Talyor Morrison Home (TMHC). I bought into the stock in last year’s sell-off after identifying the stock as one of several home builders trading below book value. I took profits after it sank from the February earnings report. I stopped monitoring after it broke down below its 50DMA. Last week, TMHC broke out again in the wake of earnings. However, after another day of strong buying, sellers forced a bearish gap down on Friday. While the stock has likely topped out for now, I will be watching it more closely in case the tailwinds of strong sector sentiment revive the momentum.
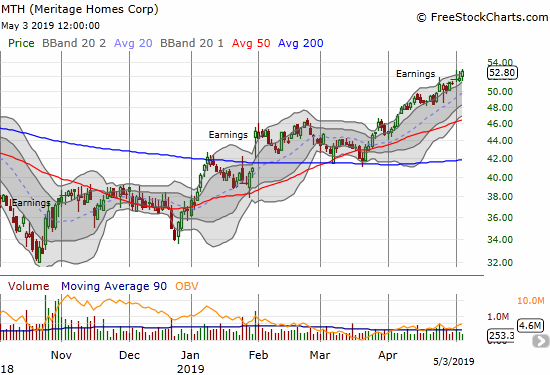
I am chronically under-invested in Meritage Homes (MTH) as I found myself with no shares despite a relatively healthy uptrend for most of 2019. My seasonal trading rules will now keep me out the stock until at least the Fall.
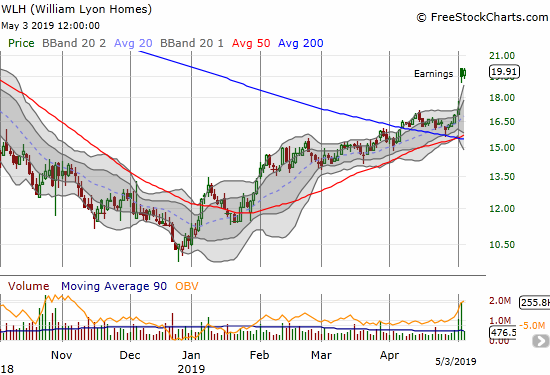
I do not follow William Lyon Homes (WLH) beyond the occasional, casual chart check, but the stock caught my interest this week with a very bullish post-earnings breakout. WLH is now on my “active” list!
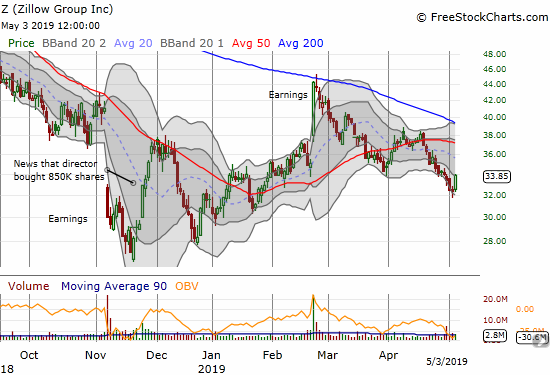
The optimism is not helping every stock in the sector. Zillow Group (Z) (ZG) jumped 4.7% on Friday but at one point last week end a day below the closing price from November 26, 2018 when news came of a big insider purchase. That purchase gave me the confidence to continue holding the stock after a large post-earnings surge that took Z right to downtrending resistance from its 200-day moving average (DMA). I finally unloaded that position after the last 50DMA breakdown in April. I will now wait for the next earnings report to decide on my next move, if any.
Source for charts: FreeStockCharts.com
The mixed picture makes sense given persistent investor optimism scraping against the reality of shaky housing data. Yahoo Finance interviewed the CEO of Clayton Homes during the Berkshire Hathway annual shareholder meeting on May 4th. He described the housing market as flat with housing affordability presenting a tremendous challenge. Under these circumstances, I expect optimistic sentiment to carry stocks in the sector only so far. Even if April was not the peak, the peak should arrive by the end of June as the glow from aggressive Spring selling fades.
New Residential Construction (Single-Family Housing Starts) – March, 2019
Plunges in housing starts in November and December confirmed a topping pattern in the data. A January surge delivered fresh prospects of a rebound. Another plunge in February brought January’s hopes to a quick end. March data further confirmed the slide in housing starts.
Single-family housing starts for February were revised downward from 805,000 to 788,000. March starts declined slightly month-over-month by 0.4% to 785,000. On an annual basis, single-family housing starts decreased by 11.0%, essentially making the January surge look like an out-sized anomaly in the middle of a downtrend. The earlier recovery in starts came on the heels of a decline that was steep enough to cause grave concerns about the health of the housing market. The data tell me that home builders are doing there best to boost results by incentivizing sales now (see below) while capping the costs of development and building.
Last June’s year-over-year decline was the first for housing starts since August, 2016, and June’s level sat as the lowest of the year until the October to December plunge. The market has transitioned from a slow motion breakdown to a break neck breakdown and perhaps to a volatile breakdown.
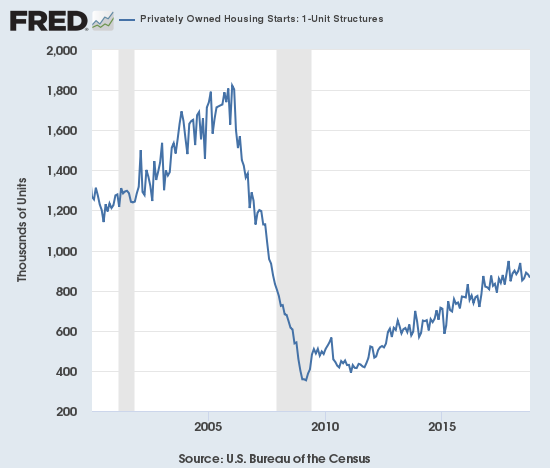
Source: US. Bureau of the Census, Privately Owned Housing Starts: 1-Unit Structures [HOUST1F], retrieved from FRED, Federal Reserve Bank of St. Louis, May 2, 2019.
When overall housing starts plunged in November, three of four regions experienced sharp declines led by the West. For December, the West and Midwest were the two declining regions both with exceptionally large changes. In the last Housing Market Review I concluded that the wide range in regional changes in January suggested that January’s surge was not likely sustainable; that projection panned out more spectacularly than I could have expected. The on-going decline in the West continues to be particularly concerning; February’s decline took housing starts in the West back to November levels which in turn were the lowest since June, 2016. The Northeast, Midwest, South, and West each changed -27.7%, 0.9%, 0.4%, and -32.0% respectively. The Northeast was likely hurt by severe Winter weather. However, I am then surprised the Midwest did not fare worse than it did.
Existing Home Sales – March, 2019
The monthly downtrend for existing home sales came to a resounding end in February. However, the declines continued in March for the 13th straight month with a year-over-year decline in sales. For January’s declines, the NAR did more projecting than usual in claiming that the down cycle had come to an end. At the time, I noted that nothing in the existing home sales data confirmed such an end. February’s abrupt surge seemed to build the case for a bottoming; March put that case right back into doubt.
The seasonally adjusted annualized sales in March of 5.21M were down 4.9% month-over-month from the slightly downwardly revised 5.48M in sales for February. Year-over-year sales decreased 5.4%. In January, existing home sales were at their lowest level since November, 2015. This roller coaster type of volatility makes expectations even more uncertain than usual.

Source for chart: National Association of Realtors, Existing Home Sales© [EXHOSLUSM495S], retrieved from FRED, Federal Reserve Bank of St. Louis, May 2, 2019.
In the November, 2018 report the NAR strained to paint a story of increasing demand. The NAR used the monthly gain in sales to celebrate: “After six consecutive months of decline, buyers are finally stepping back into the housing market…” With buyers still stepping away from the market, the NAR in February reached for a market bottom (emphasis mine): “Existing home sales in January were weak compared to historical norms; however, they are likely to have reached a cyclical low.” I countered that substantial year-over-year declines still indicated that the more meaningful trend remained downward. My claim stands.
During last month’s press conference, the NAR broke down the sales changes by price range. These data suggest that changes in tax laws are indeed having an outsized impact on higher-priced homes. The NAR did not offer an explanation for the plunge in the cheapest homes, but I suspect the drops there are an ominous sign of the health of lower-income families.
- <= $100K: -13%
- $100 – $200K: -5%
- $250 – $750K: +1%
- $750K – $1M: -6%
- >= $1M: -11%
The NAR continues to point to rising inventories as a positive sign. In the November report, the NAR noted that “increasing housing inventory has brought more buyers to the market.” For December, the NAR declared: “Several consecutive months of rising inventory is a positive development for consumers and could lead to slower home price appreciation.” For January, the NAR spun the shift of market power to buyers as a positive: “Decelerated sales and the increases in inventory will work in favor of potential homebuyers, putting them in a better negotiating position heading into the spring months.” For March, the NAR once again applauded higher inventories: “Further increases in inventory are highly desirable to keep home prices in check.” Yet, despite the rise in inventories, now eight months running, median prices continue to increase and sales keep trending downward. Until proven otherwise, higher inventories are a sign of a weakening, not strengthening, market for existing homes.
Absolute inventory levels increased from 1.64M a year prior to 1.68M in March. Based on months of supply, inventory changes all pointed higher: “Unsold inventory is at a 3.9-month supply at the current sales pace, up from 3.6 months in February and up from 3.6 months in March 2018.” The inventory situation is very different based on price ranges: the most expensive homes, $1M and up, have 10 months of supply while homes in the two lowest tiers (see above) only have 3 to 4 months of supply (data from the press conference).
While the median price of an existing home stayed effectively flat with January, prices continued their year-over-year ascent in February with a 3.6% year-over-year increase – above January’s 2.8% year-over-year gain (which was the slowest price growth since February, 2012). In March, price growth crept upward to a gain of 3.8% year-over-year: the 85th straight annual increase. During the press conference, the NAR noted that March’s price gain was the largest nominal increase for a March in history – hardly a sign that increasing inventories are improving affordability!
The share of sales going to first-time buyers bounced back from January’s decline. For February, the share returned to 32% from 29% in January (32% in December) and January of last year. The share crept upward one more percentage point in March; the 33% share of first-timers was a notable jump over the 30% from a year ago. The average share for first-time homebuyers for 2016 was 35%. The NAR’s 2017 Profile of Home Buyers and Sellers reported an average of 34% for 2017 and 33% for 2018.
Investors purchased 18% of homes in March, up from February’s 16% and the 16% the year prior. Investor sales averaged a share of 15% in 2017 and 14% in 2016. I am still awaiting the average for 2018.
February just barely ended a 4-month streak of annual sales declines across all four regions. The broad-based declines resumed in March. In particular, the West suffered a ninth consecutive month in the red year-over-year; March was another double-digit decline. Here are the regional numbers with February, January, December, November, October and September’s year-over-year changes in parentheses respectively listed for comparison (any revisions are not included): Northeast -1.5% (+1.5%, -1.4%, -6.8%, -2.6%, -6.8%, -5.6%), Midwest 8.6% (0%, -7.9%, -10.5%, -4.3%, -3.1, -1.5%), South -2.1% (-0.4%, -8.4%, -8.7%, -5.6%, -2.3%, -0.5%), West -10.7%, (-7.9%, -13.8%, -15.0%, -15.4%, -11.2%, -12.2%).
As usual, regional sale fluctuations had little to no relationship to the on-going price run-ups. (February, January, December, November, October, September in parentheses without accounting for revisions): Northeast 2.5%, (3.8%, 0.4%, 8.2%, 6.5%, 3.0%, 4.1%), Midwest 4.6%, (5.4%, 1.4%, 0.0%, 2.6%, 2.4%, 1.9%), South 2.4% (2.5%, 2.5%, 2.5%, 3.2%, 3.8%, 3.0%), West 3.1% (3.0%, 2.9%, 0.2%, 1.8%, 1.9%, 4.1%).
Single-family sales declined 4.9% from February and decreased on a yearly basis by 4.7%. The median price of $261,100 was up 3.8% year-over-year.
California Existing Home Sales – March, 2019
According to the California Association of Realtors (CAR), sales of existing homes in California hit a 10-year low in January. February’s month-over-month comeback of an 11.8% gain was enough to print a 6-month high and the biggest monthly gain since January, 2011. March sales dropped just slightly from February by 0.2%, but it was a 6.3% year-over-year drop.
Price growth flattened out starting in 2014 but over the past year it has declined. February’s median price was the lowest in 12 months. March’s median price jumped 5.9% from February to $565,880, just a 0.2% year-over-year increase. CAR welcomes the overall price softness: “The flattening home prices, coupled with low mortgage rates, bode well for housing affordability and may bring more buyers who may have given up back to the market.” Given the expense of living in California, only significant price drops will bring the average buyer back. The slew of tech IPOs could be a an adequate support for housing in the near-term, but such dynamics will also further worsen the affordability crisis in California.
New Residential Sales (Single-Family) – March, 2019
The stark contrast between existing home sales and new home sales continued in March. While existing home sales languish and trend downward, new home sales are experiencing a dramatic comeback. Softness in existing home sales helped motivate me to predict that November, 2017 represented a sustained peak in new home sales. Now, the peak looks ready to fall this Spring selling season.
The Census Bureau revised February sales of new single-family homes downward from 667,000 to 662,000. New home sales for March increased 4.5% month-over-month and increased 3.0% year-over-year to 672,000.
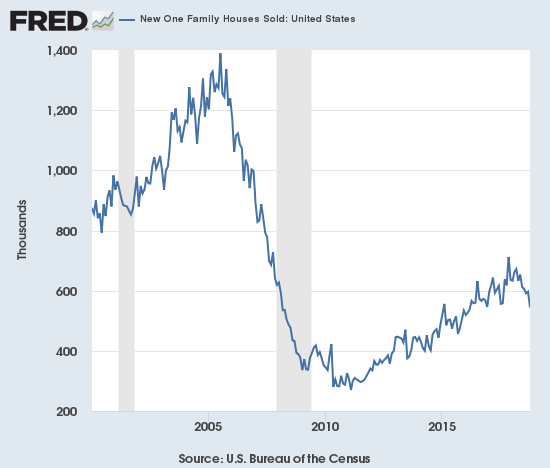
Source: US. Bureau of the Census, New One Family Houses Sold: United States [HSN1F], retrieved from FRED, Federal Reserve Bank of St. Louis, May 4, 2019.
The contrast between new home sales and housing starts also continues. The inverse relationship makes it look like home builders are rushing to unload inventory. Certainly, the current drop in median home prices suggests a “firesale” is underway.
In November, the median sales price of a new single-family home hit its lowest level of 2018 at $308,500. Prices were last that low February, 2017 ($298,000). March’s median dropped a whopping 9.7% year-over-year to $302,700 as the distribution of sales shifted sharply to homes priced $199,999 and lower. The 6% share of homes sold under $150,000 is the highest share since 6% in February, 2016.
In June, 2018 the inventory of new homes for sale jumped to 6.0 months of sales, a perfect balance. Inventory has trended upward from there. October’s inventory jumped to 7.2. After falling down for a few months, inventory bounced back to 6.6 in January. Inventory pushed back to 6.1 in February and 6.0 in March.
The Northeast suffered yet another double-digit decline in new home sales with a 20.0% drop. The Midwest gained 1.2% and ended the South’s two-month streak as the only region to gain year-over-year. The South gained 9.3% and clearly led the continued rebound in new home sales. The West dropped 4.3%. The momentum in new home sales is poorly distributed and thus not likely to last much longer.
Home Builder Confidence: The Housing Market Index – April, 2019
The Housing Market Index (HMI) ended 2018 at an average 66.4, just slightly below 2017’s average of 67.8. The HMI fell off a cliff in the last two months of 2018 after finally giving in to the weight of declining components. The year 2019 has delivered relief. The HMI perked back up 2 points to 58 in January, tacked on another 4 points to 62 in February, held at 62 for March and gained another point to 63 in April. For March, I concluded that the sharp decline in the traffic of prospective buyers indicated a topping out of HMI. That component rebounded three points. All three components are still under a downtrend line drawn from the peaks in December, 2017. That downtrend is perhaps the most important feature of HMI given the parallel decline in housing starts.
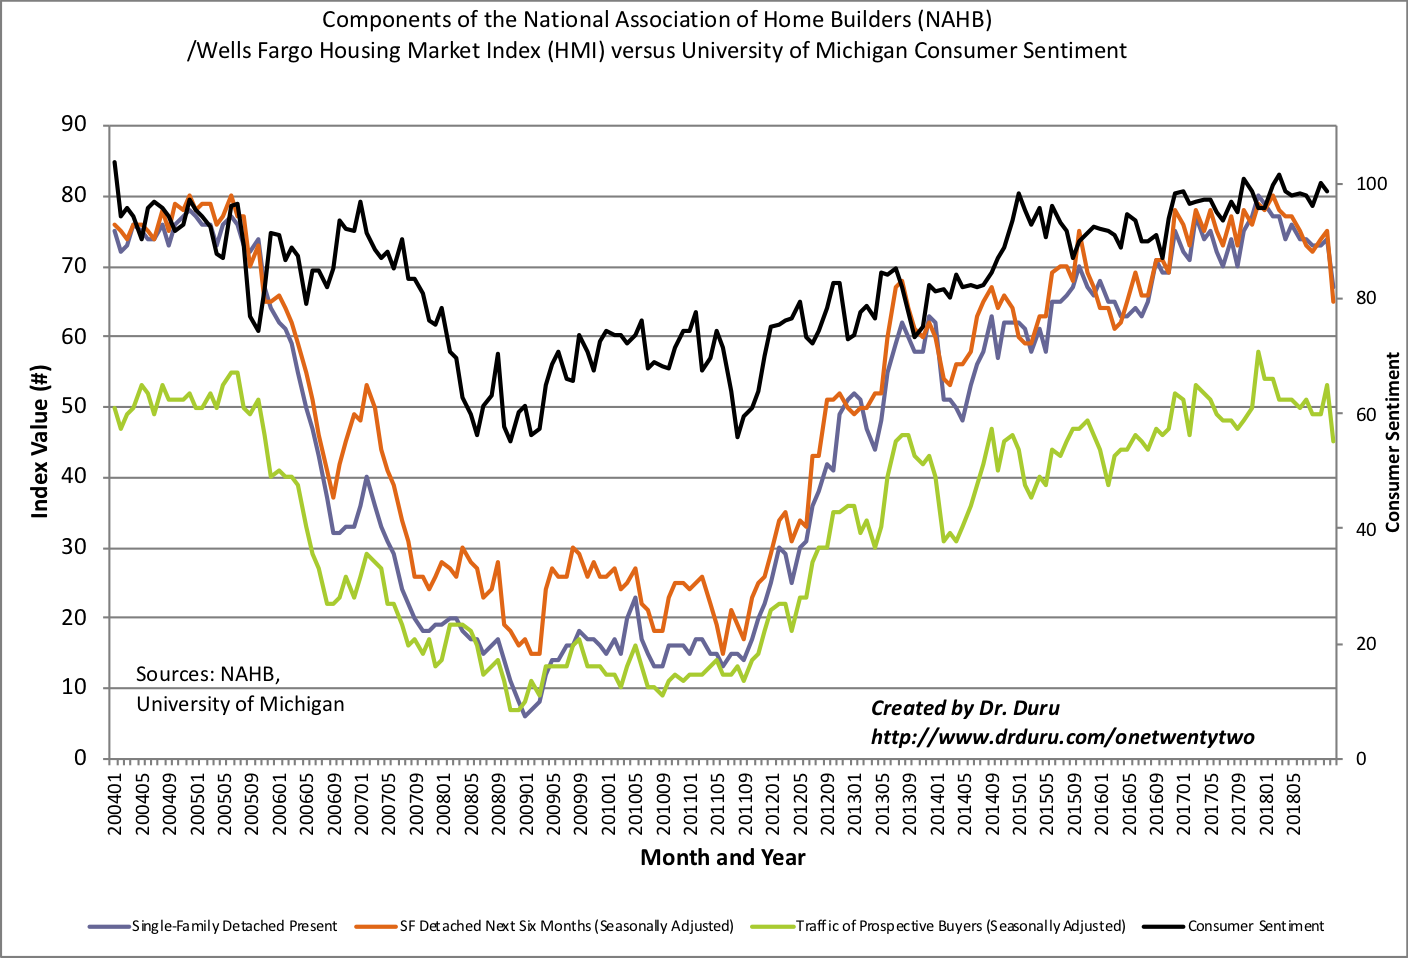
Source: NAHB
The NAHB used this occasion to deliver another grave warning on costs: “…supply-side headwinds that are putting upward pressure on housing costs will limit more robust growth in the housing market.” Given there are no near-term catalysts to reduce those costs, I have to assume costs are yet one more reason to believe that the ITB will peak sooner than later.
Although the HMI is recovering, the regional story remains mixed and includes surprising contrasts with the regional new home sales data. After all four regions ended 2018 at multi-year lows, just two regions gained in January and February. For March, 3 of 4 regions gained, but the Midwest fell back to a 4 1/2 year low. The Northeast jumped to an 11-month high at 56. The Midwest jumped to a 7-month high to 56. The South dropped for the first time since December and sits at 66. The West jumped to a 6-month high. It is ironic the South led the charge for new home sales but was the only region with an HMI dropping from March. The sentiment in the Northeast and the West fly directly in the face of sharply declining sales in those regions.
Parting thoughts
The last month delivered a series of interesting stories and reports on the housing market, all told well by MarketPlace. I post these stories below.
The New York Federal Reserve produced a report suggesting that the tax reform law made housing less affordable in high cost-of-living counties. I suspect the NAR piggybacked on this report in breaking down the price ranges for the drops in the sales of existing homes.
Housing affordability is an issue even in markets with relatively lower cost-of-living metrics. In Atlanta, “inclusionary zoning” is a potential solution. The approach is controversial, and it could exact lasting damage on incentives to add housing supply.
The following story helped motivate me to take my remaining profits in Zillow (Z). More players are getting interested in flipping homes through digital platforms. Zillow planned to make this market a strategic differentiator; that window is closing rapidly.
Be careful out there!
Full disclosure: long CCS