
Bitcoin (BTC/USD) continues to provide great data points for using Google Trends to assess the sustainability of significant price movements. So many milestones have occurred in such a short period of time that I decided to name this process: the Google Trend Momentum Check or “GTMC” for short.
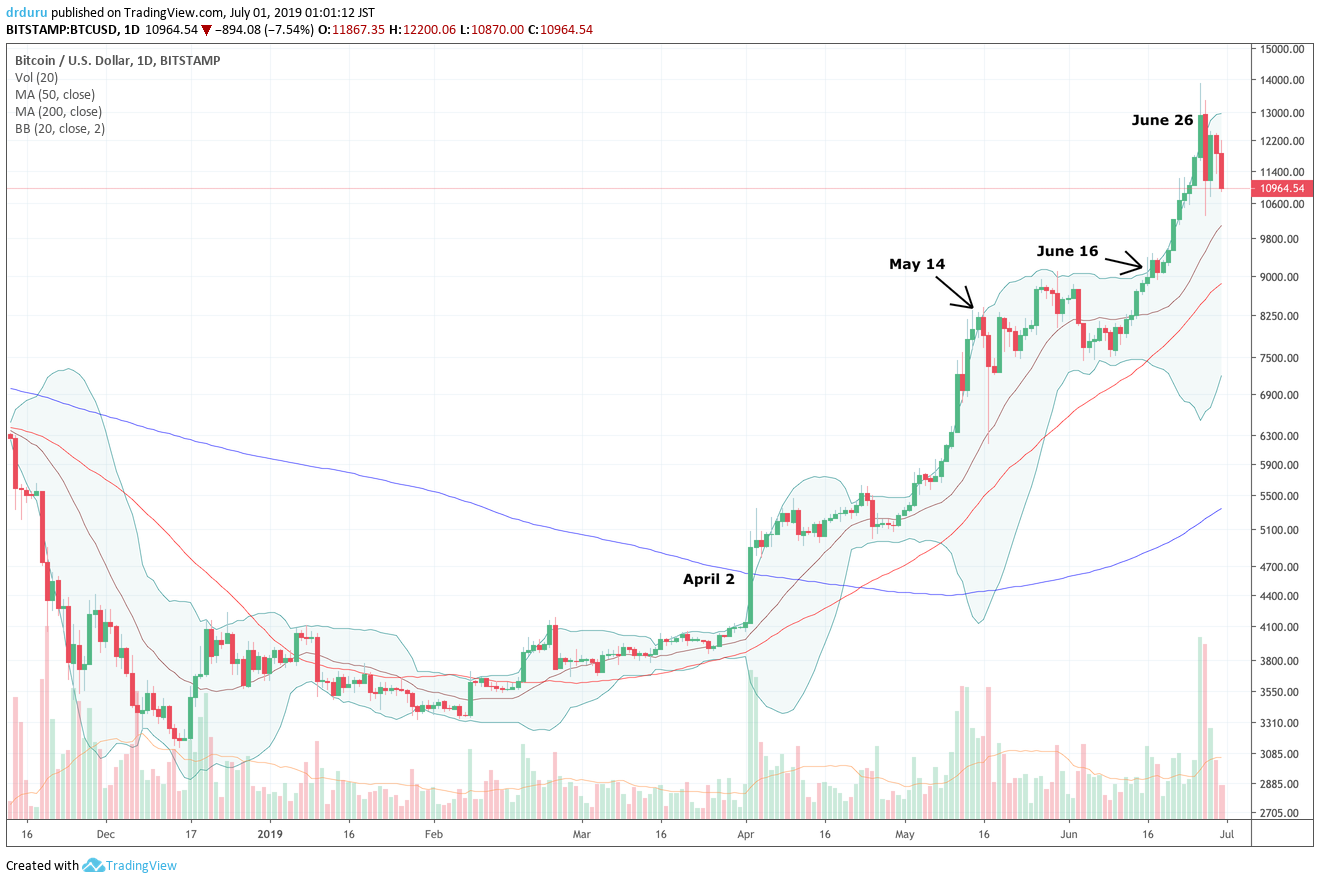
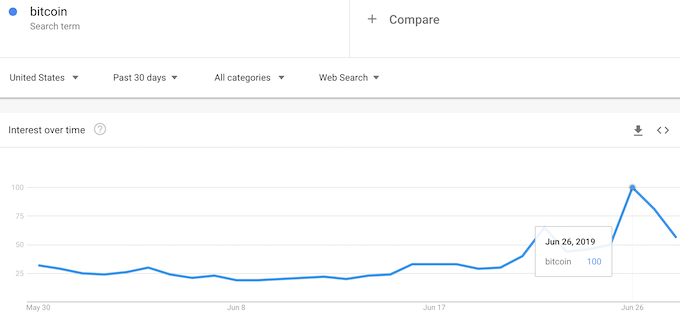
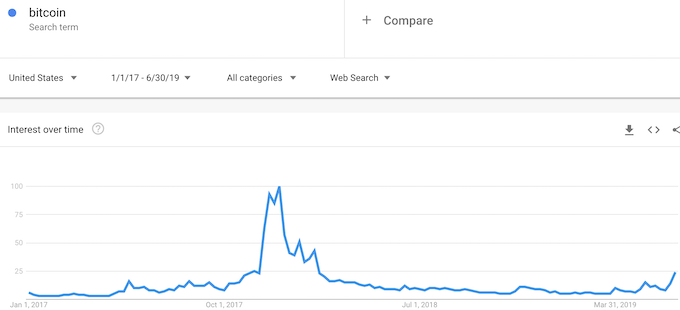
The latest example of the GTMC occurred when Bitcoin surged on June 26th as much as 18% to $13,880 (using Tokyo time). It was one of the largest one day moves on a percentage basis in months and placed BTC/USD at a price last seen on January 14, 2018…pushing into the immediate wake of the bursting of the last big Bitcoin bubble. At the same time, the Google Trends index surged to its highest point since mid-February, 2018. The parallel surges signaled a likely topping in price. Sure enough, both the Google Trends index and the price of Bitcoin pulled back. Bitcoin in particular pulled back sharply with the gains of June 26th evaporating the very next day. At the time of writing, sellers remain in firm control of the price action.
As a reminder, recall that Google Trends is an index that measures the relative popularity of a search term (on search volume). Google measures the index relative to a chosen timeframe; the most popular point in that timeframe gets a score of 100. All other time points are scaled downward from there. The surge for the search “Bitcoin” on June 26th was a breakout that built up over 6 days or so.
Source for charts: Google Trends
The above Bitcoin chart marks other validation pints for the Google Trend Momentum Check. I wrote about each one. (Use the tag “Bitcoin” or “BTC-USD” to review my posts on Bitcoin).
- November 23, 2018: Bitcoin’s Latest Price Plunge Finally Wakes Up (Search) Interest
- April 2, 2019: Bitcoin Reawakens: Price and Search Trends Signal A Sustained Bottom (I bought my first ever Bitcoin)
- May 14, 2019: Bitcoin Price Gets Extreme Relative To A Surge In Interest (I sold my two tranches of Bitcoin trades ahead of this piece)
- June 16, 2019: Bitcoin Breakout: A 13-Month High Confirmed By Google Search Trends
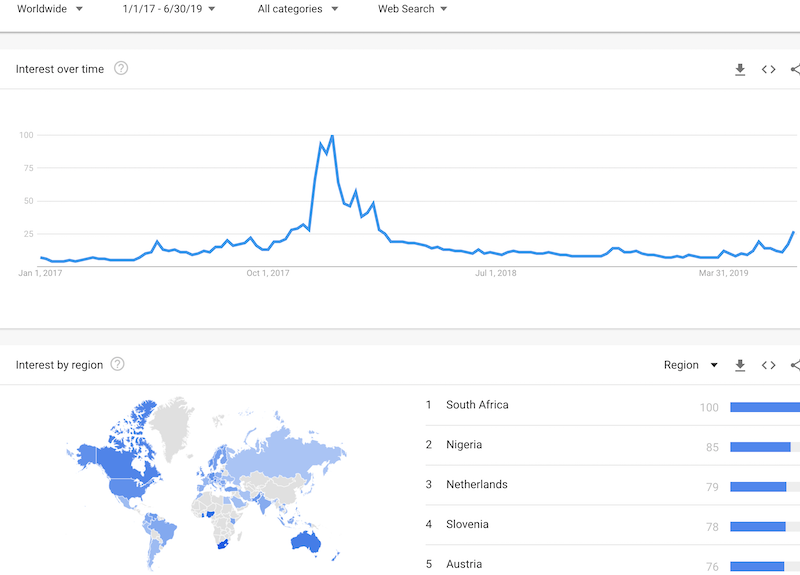
The current milestone is so important, I took a look at the worldwide trend looking for further confirmation. Sure enough, the pattern is exactly the same. The U.S. does not even dominate the search activity. South Africa and then Nigeria top the list followed by three small European countries. The U.S. shows up as number 13, even far behind #6 Ghana.
Source: Google Trends
Even when zooming into the last 30 days, the top 5 countries have a similar dominance pattern: Nigeria moves up to #1, South Africa drops to #2, Austria jumps to #3, Switzerland is a new entrant at #4, and the Netherlands drops to #5. Slovenia drops all the way to #13 just behind the U.S. at #12.
With the price of Bitcoin dropping sharply off the June 26th peak, the Google Trend Momentum Check once again proved useful in assessing the sustainability of the price momentum. As a reminder, here are my working explanations for how and why the Google Trend Momentum Check works:
- When a search extreme accompanies an extreme price movement in the direction of an uptrend, a frenzy of activity attracts many of the willing buyers into the market. Once the buying ends, the price momentum loses its fuel and the path of least resistance becomes downward. The GTMC does not predict how long the top will last or the steepness of the subsequent pullback.
- When a search extreme accompanies an extreme price movement in the direction of a downtrend, prices are finally dropping low enough to attract fresh interest. This new interest brings in buying activity that replaces the “exhausted” sellers. The path of least resistance turns upward and risk/reward favors buyers. Bitcoin provided one example of this relationship last November.
- When a search extreme accompanies a breakout in price, fresh buying interest has entered the market to revive upward momentum. A breakout marks either a change in price momentum or a new high after a previous pullback. This association is a new one for me and only came from studying the GTMC with Bitcoin.
As long as Google remains the dominant gateway for information on the internet, I expect the GTMC to continue working. So far, searches in English continue to prove sufficient for understanding the GTMC.
I have been itching to make another trade in Bitcoin using the Google Trends Momentum Check, but I have yet to do so. I still consider myself to be in a learning mode rather than an active trading mode, so my threshold for making a trade is exceptionally high. Off the current pullback, I might be willing to buy a small amount of Bitcoin again in the $9000-$10,000 range. I will post any trades I decide to make.
Be careful out there!
Full disclosure: no position
No shout out?
Sorry, man! I should of course acknowledge such a crypto king for getting me into this (dragged, kicking and screaming at first). I am pretty sure I acknowledged you anonymously in my first post or two. I will have to check…. 🙂