
AT40 = 63.4% of stocks are trading above their respective 40-day moving averages (DMAs)
AT200 = 55.1% of stocks are trading above their respective 200DMAs
VIX = 12.9
Short-term Trading Call: neutral
Stock Market Commentary
The stock market is keeping the faith.
The previous week ended with a U.S. GDP report for Q1 2019 that represented well the state of the stock market: on the surface, strong headline numbers, but underneath nagging reasons for doubt. Last week ended with a strong headline jobs number for April that was celebrated quite emphatically by Larry Kudlow, President Trump’s Director of the National Economic Council…
…and yet the U.S. dollar (DXY) sank inexplicably in response to this strong report. Reuters backed into an explanation that undermined the headline good news of the jobs report:
The dollar slipped against a basket of currencies on Friday as traders focused on the weaker aspects in the April U.S. payrolls report, brushing aside a stronger-than-forecast in hiring and a drop in the jobless rate to an over 49-year low. Traders turned their attention to the modest 0.2% monthly pace of wage growth and the drop in the job participation rate, which analysts blamed for the catalysts for some selling in the greenback.
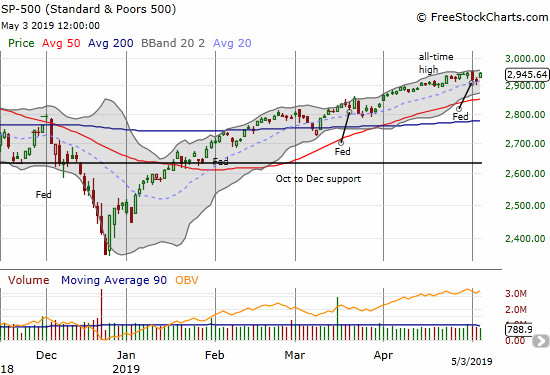
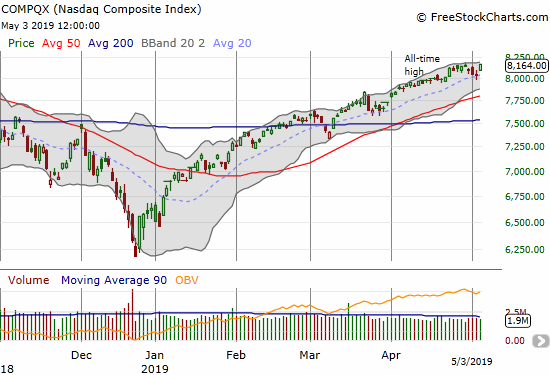
Ironically, a weaker dollar translates into a “risk on” bias for currency traders which in turn flows into other financial assets. The end result was a strong stock market rally that sent the S&P 500 (SPY) just short of its all-time high and the NASDAQ (NDX) to a new all-time high. These moves erased the previous two days of weakness.
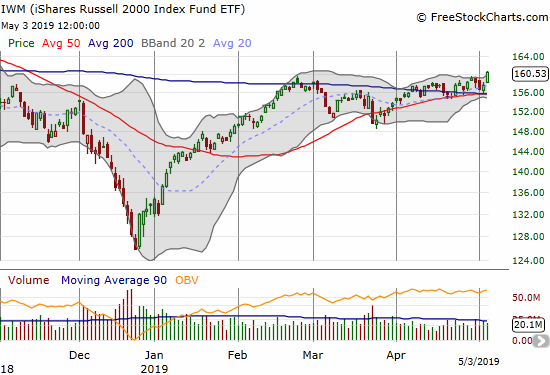
Small-caps also woke up. The iShares Russell 2000 ETF (IWM) broke out to 7-month highs after churning through a month long consolidation period. The 1.9% gain is also bullish given the bounce off converged 50 and 200DMA support. Unlike the last two bounces off 50DMA support, I was not prepared with fists full of call options. My earlier attempt to buy fell short as I set my limit price too low. This was a BIG miss.
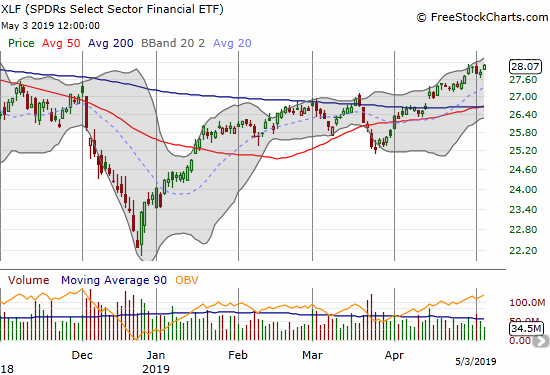
The Financial Select Sector SPDR ETF (XLF) also jumped back into action. XLF is still scraping its way to a complete recovery of the October, 2018 breakdown.
A Fed decision on monetary policy was once again behind stock market weakness; the narrative for the day was a market disappointed in the Fed’s seemingly unwillingness to promise an imminent rate cut. I thought of the slight pullback as the beginning of confirmation of the market’s bearish divergence. Like every other confirmation over the last 2 months or so, the pullback was shallow and brief. AT40 (T2108), the percentage of stocks trading above their respective 40-day moving averages (DMAs), rebounded from a one-month low to a high of the week at 63.4%. If not for the strength in AT200 (T2107), the percentage of stocks trading above their respective 200DMAs, I might have stayed bearish on the stock market instead of waffling at neutral. AT200 has taken on the mantle of reassurance and serving the faithful. AT200 closed at a new 7+ month high at 55.1%. (Note that a waft of bearish engulfing patterns on Wednesday motivated me to enter a slew of fresh bearish positions on Thursday).
The volatility index, the VIX, sprang to life once again and managed to close on its high after the Fed’s decision. My call options on Ultra VIX Short-Term Futures ETF (UVXY) had suffered so much time decay that Wednesday’s surge was insufficient to get me back to even (I once again regretted not taking profits the previous week!). For a brief moment on Thursday I was back in the green, but I was far too slow in taking profits. I ended up taking a loss and rolling the funds into a call spread. Upon seeing the U.S. dollar plunging at the market open on Friday, I bought UVXY put options for the first time in a long time. I was able to flip them for a profit at the close.
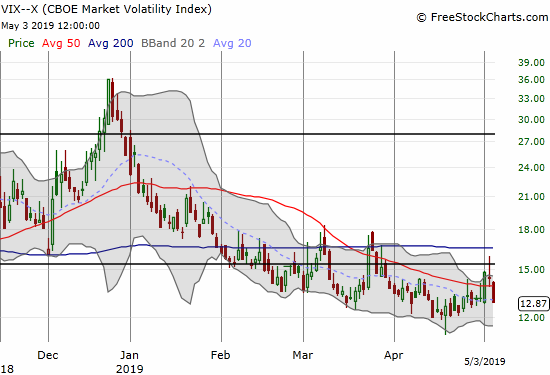
My latest experiences trading volatility made me take a step back. My approach has been to hold a rotation of UVXY call options to be prepared for sudden market disruptions. All the while, the on-going downtrend is the more salient feature in the VIX. Trying to stay vigilant for the profit opportunities long volatility is much harder than playing the trend. David Lincoln posted a timely lesson on the VIX and the current contango in the VIX futures. His play to buy a June put spread makes a LOT of sense under current conditions. I will keep a small number of UVXY call options in my back pocket, but I will now turn my attention to fading volatility until it manages to close above the 15.35 pivot. (Late breaking news: President Trump is ratcheting up the pressure on China with more tariff threats. Monday should provide an ample opportunity to fade the VIX again!)
Bearish Divergence
The lingering case for bearish divergence still rests with the Australian dollar versus the Japanese yen (AUD/JPY). AUD/JPY ended the week testing the lower bound of its trading range. Something has to give soon: either the S&P 500 delivers a more lasting pullback or the Australian dollar experiences a revival.
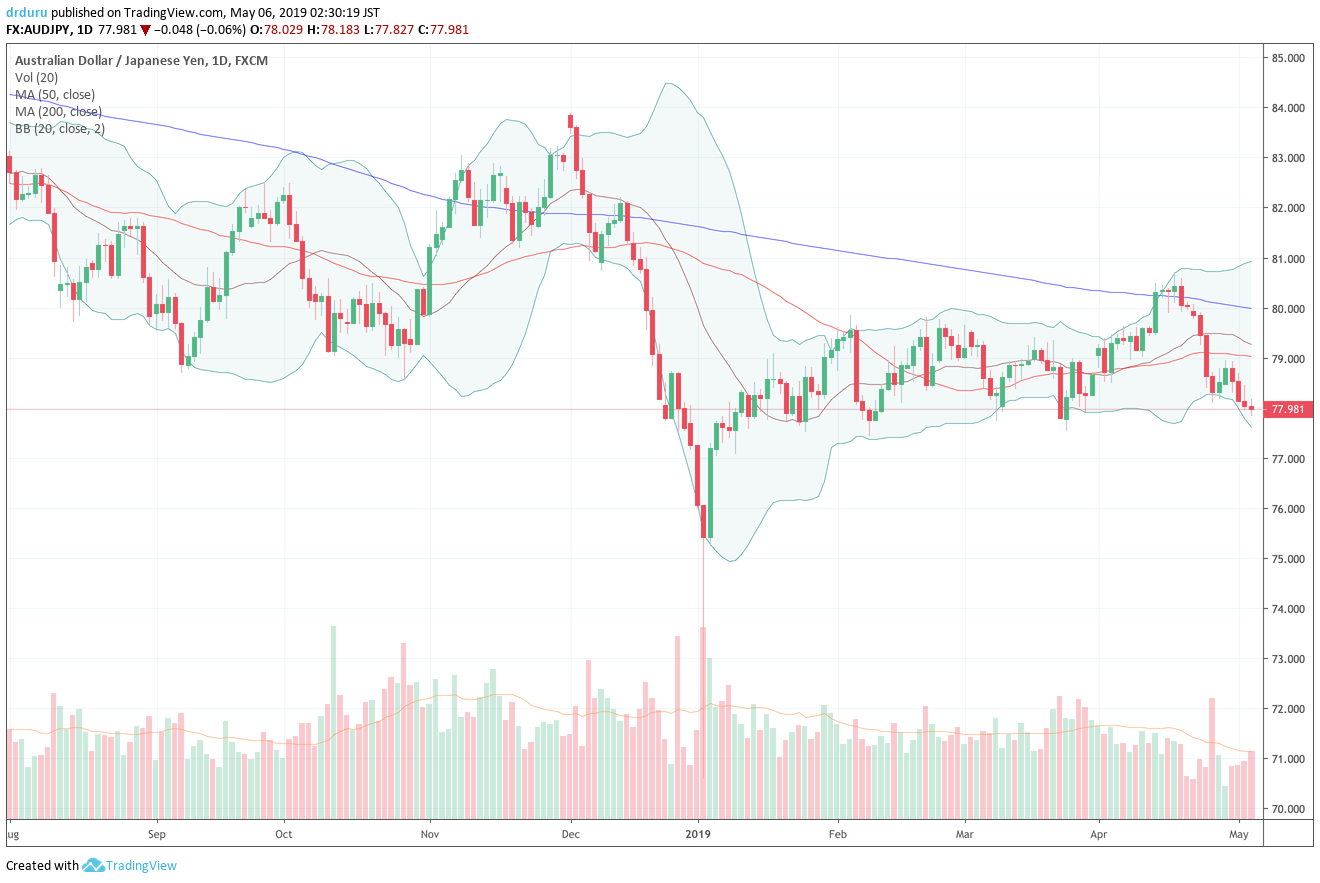
Source: TradingView
Stock Chart Reviews – Bullish
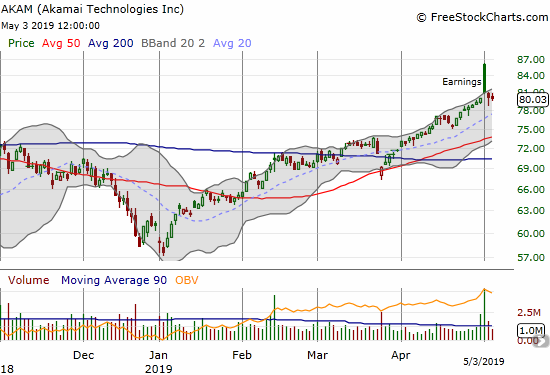
Akami (AKAM)
At first blush Akami (AKAM) looks bearish given the massive post-earnings gap and crap. While sellers quickly closed the gap, they have yet to deliver follow-through. I am looking for a “calm after the storm” setup to go long and ride a resumption of upward momentum. Follow-through selling would put a 50DMA test into play.
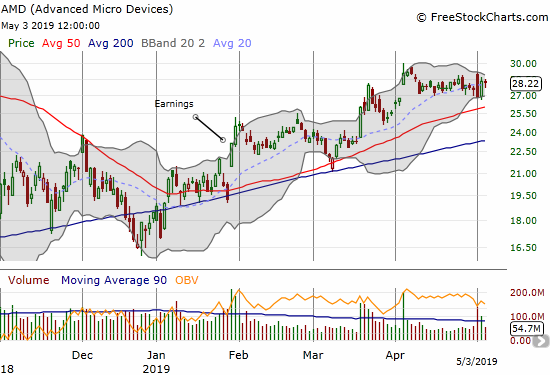
Advanced Micro Devices (AMD)
I played Advanced Micro Devices (AMD) for a post-earnings sell-off with a put spread hedged with a call option. The post-earnings reaction was the exact opposite of what I wanted: an initial gap up with a fade to a small loss on the close. I lost on both ends. The stock’s immediate rebound on Thursday keeps this stock in the bullish column as consolidation continues.
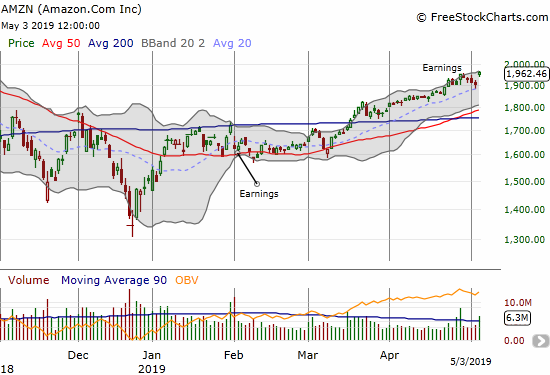
Amazon.com (AMZN)
Amazon.com (AMZN) wobbled post-earnings going from a gap open to closing the gap to a 7-month high all in one day. The stock dribbled lower from there until news that Warren Buffett’s Berkshire Hathaway (finally) invested in AMZN. Ironically, Buffett made it abundantly clear during Saturday’s annual shareholder meeting that the AMZN investment was not his idea. Still, he gave his team a vote of confidence by clarifying that buying quality companies is always a good deal: “all investing is value investing.”
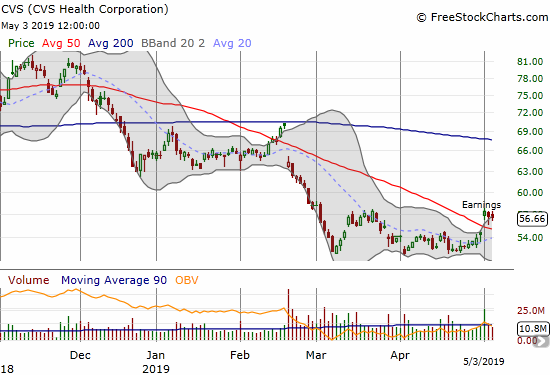
CVS Health Corporation (CVS)
I am still bearish on pharmacies, but the post-earnings chart of CVS Health Corporation (CVS) (which is now more than a pharmacy) undeniably has green shoots of bullishness with its leap over 50DMA resistance and a double bottom spread over March and April.
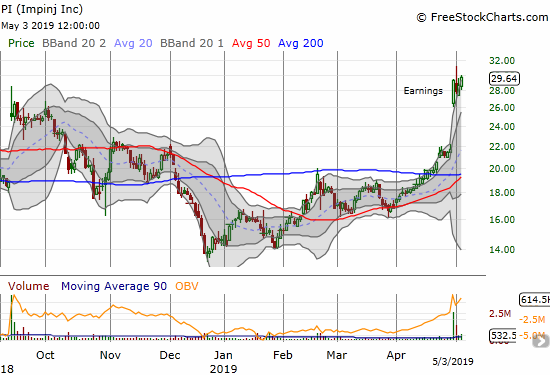
Impinj (PI)
I wish I could say I was smart enough to follow through on my bullish call on Impinj (PI) with a nifty pre-earnings position. The chart says it all….
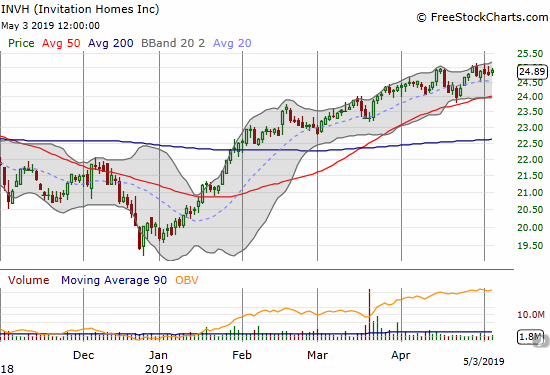
Invitation Homes (INVH)
Invitation Homes (INVH) is one of those stocks I just buy and tuck away. I posted about INVH soon after it came to the public markets. The stock is not exciting by any means but I want to ride the secular trend of rental properties.
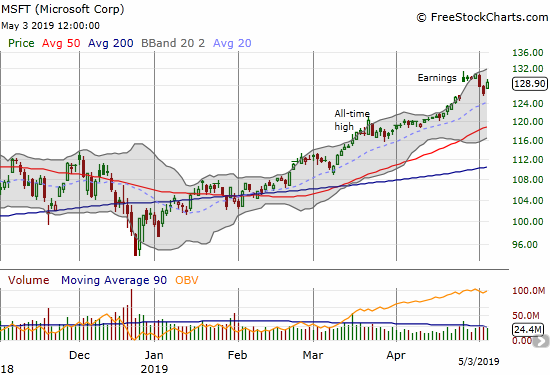
Microsoft (MSFT)
Microsfot (MSFT) finally hit the $1 trillion mark…and promptly reminded us how hard it is for $1 trillion stocks to hold that mantle. I was surprised by Wednesday’s selling and bought a calendar call spread in anticipation of a quick rebound. That rebound did not come until Friday, but I am in a decent position if the stock can continue trickling back to $130/$131 by the end of the week…renewed trade tensions notwithstanding.
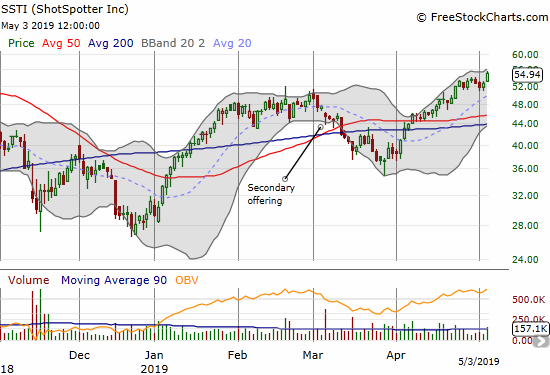
ShotSpotter (SSTI)
ShotSpotter (SSTI) is clearly now highly correlated with the rest of the small cap sector. Friday’s breakout provided to me big relief given my earlier concern about the secondary offering. The stock continues to reward the faithful.
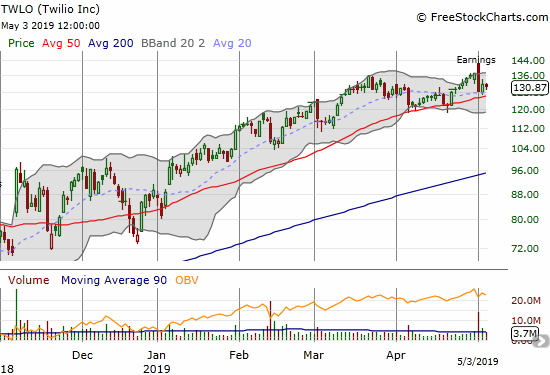
Twilio (TWLO)
Twilio (TWLO) was one of several stocks that refused to follow through on a bearish engulfing pattern. TWLO even seemed to confirm 50DMA support on Thursday.
Stock Chart Reviews – Bearish
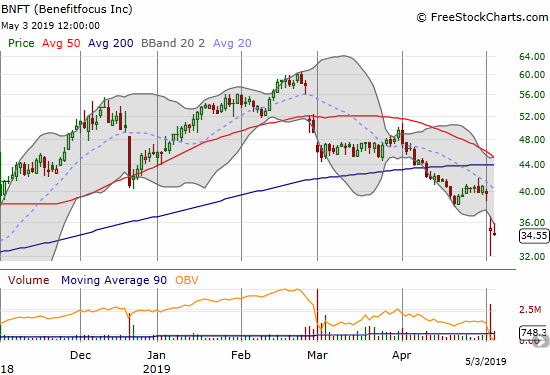
Benefitfocus (BNFT)
Can Benfitfocus (BNFT) compete with Workday (WDAY)? Fresh doubts came up with last week’s big post-earnings loss. BNFT confirmed its 200DMA breakdown. Imagine what could happen once (if?) the general stock market turns ugly again.
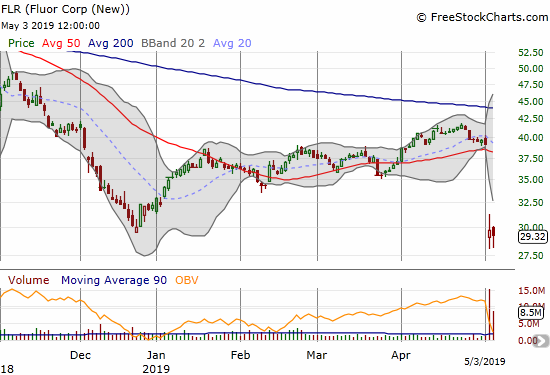
Fluor Corp (FLR)
I WANT to say Fluor Corp (FLR) has a bullish chart given its massive post-earnings collapse is clinging to the December and 10 1/2 year low. The stock is also well below its lower Bollinger Band (BB). Yet, a 24.1% post-earnings collapse is always bearish unless proven otherwise with a strong follow-on buying effort. In earlier posts I expressed my long-term confidence in FLR, and I used last year’s sell-off to buy in. The steady rise this year lulled me into confidence. The recent “kumbaya” talk about Democrats and Republicans cooperating on $2 trillion in infrastructure spending sealed the deal on my contentment. The post-earnings collapse erased all my profits and then some. I am going to stubbornly hang in there for at least one more earnings cycle…
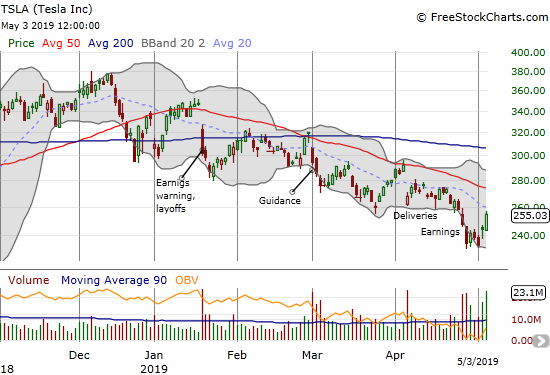
Tesla (TSLA)
The trading call for Tesla (TSLA) depends on your perspective. I am keeping it in the bearish category given the persistent downtrend all year defined by the 50DMA. I can see the bullish case given the positive reaction to the company’s announced secondary offering. Sellers were unable to punch through the $230 level. I am now holding the long side of a calendar put spread.
A reminder about a useful app called SenseEV for Tesla departure schedules. With SenseEV you can control the climate of your Tesla remotely. Try it out!
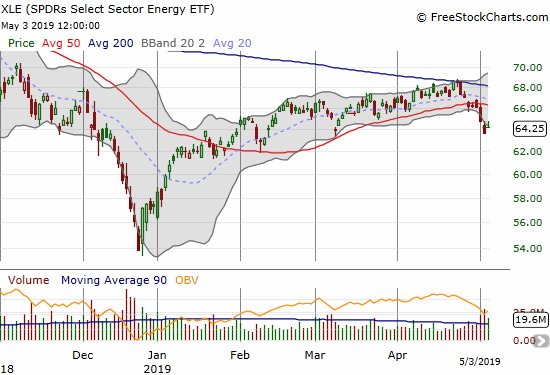
Energy Select Sector SPDR ETF (XLE)
The Energy Select Sector SPDR ETF (XLE) only benefited slightly from the recent run-up in the price of oil. Last week’s 50DMA breakdown plants XLE solidly in the bearish camp. I will look to accumulate puts.
— – —
FOLLOW Dr. Duru’s commentary on financial markets via email, StockTwits, Twitter, and even Instagram!
“Above the 40” uses the percentage of stocks trading above their respective 40-day moving averages (DMAs) to assess the technical health of the stock market and to identify extremes in market sentiment that are likely to reverse. Abbreviated as AT40, Above the 40 is an alternative label for “T2108” which was created by Worden. Learn more about T2108 on my T2108 Resource Page. AT200, or T2107, measures the percentage of stocks trading above their respective 200DMAs.
Active AT40 (T2108) periods: Day #83 over 20%, Day #81 over 30%, Day #80 over 40%, Day #25 over 50%, Day #1 over 60% (overperiod ending 2 days under 50%), Day #42 under 70%
Daily AT40 (T2108)
")
Black line: AT40 (T2108) (% measured on the right)
Red line: Overbought threshold (70%); Blue line: Oversold threshold (20%)
Weekly AT40 (T2108)

*All charts created using FreeStockCharts unless otherwise stated
The T2108 charts above are my LATEST updates independent of the date of this given AT40 post. For my latest AT40 post click here.
Related links:
The AT40 (T2108) Resource Page
You can follow real-time T2108 commentary on twitter using the #T2108 or #AT40 hashtags. T2108-related trades and other trades are occasionally posted on twitter using the #120trade hashtag.
Be careful out there!
Full disclosure: long UVXY call spread, long FLR, long INVH, long MSFT calls, long SSTI, long TSLA put, long XLF calls, long AUD/JPY, net long the U.S. dollar including short AUD/USD, long TWLO
*Charting notes: FreeStockCharts stock prices are not adjusted for dividends. TradingView.com charts for currencies use Tokyo time as the start of the forex trading day. FreeStockCharts currency charts are based on Eastern U.S. time to define the trading day.