
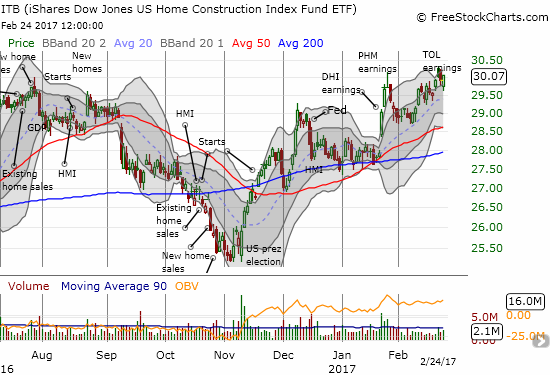
The last Housing Market Review covered data reported in January, 2017 for December, 2016. At that time, the iShares US Home Construction (ITB) was rebounding strongly from a brief pullback from an earnings-driven 6-month high. I described the setup as a coiled spring. The coiled spring did not release to great effect, but earnings from Toll Brothers (TOL) pushed ITB over the hump to a fresh 6-month high. Uptrends in the 20, 50, and 200-day moving average suggest the coiled spring is at least uncurling up and to the right…
Source: FreeStockCharts.com
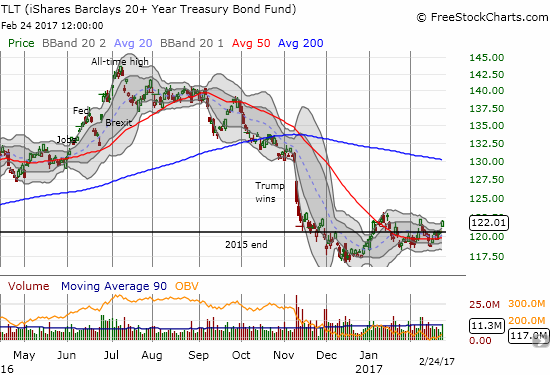
Fed fears continue to fade into the distance. Treasury yields are certainly helping investors forget about the potential for more rate hikes from the U.S. Federal Reserve. Bond yields are back to their lowest point of 2017. As a result, iShares 20+ Year Treasury Bond (TLT) is challenging its highs for the year.
Source: FreeStockCharts.com
The latest round of housing data once again put strong uptrends on display. Interestingly, accelerating existing home sales contrasted with decelerating new home sales. Standing in the balance was homebuilder sentiment which experienced its second monthly drop in a row after hitting a new post-recession peak in December. The stock market took the data in stride as earnings generally dominated the trading action in home builders. The pullback I wanted for rebuilding housing positions ahead of the Spring selling never materialized. I now look to play smaller pullbacks and/or play earnings stories.
New Residential Construction (Housing Starts) – January, 2017
Single-family housing starts for December were revised upward from 795,000 to 808,000. January starts managed a modest monthly gain of 1.9% to 823,000. This small change leaves intact the post-recession uptrend. On an annual basis, single-family housing starts leapt 11.1%, above the previous year-over-year increase of 9.3%.
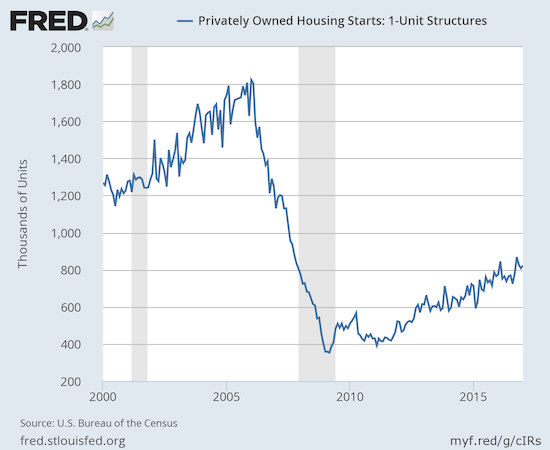
Source: US. Bureau of the Census, Privately Owned Housing Starts: 1-Unit Structures [HOUST1F], retrieved from FRED, Federal Reserve Bank of St. Louis, February 5, 2017.
Starts were mixed year-over-year across the regions. The West was the big laggard with a 1.2% drop. This decline followed a 13.5% year-over-year gain in December. The South was the big winner with a 17.4% year-over-year jump which makes up for the previous 1.7% decline. The Northeast and the Midwest were similar with gains of 9.3% and 8.8% respectively.
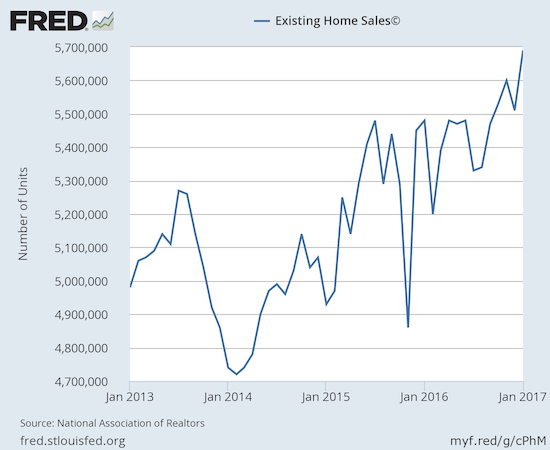
Existing Home Sales – January, 2017
For January, existing home sales returned to gains. The National Association of Realtors (NAR) was greatly encouraged by the strong start to the year.
“Much of the country saw robust sales activity last month as strong hiring and improved consumer confidence at the end of last year appear to have sparked considerable interest in buying a home…Market challenges remain, but the housing market is off to a prosperous start as homebuyers staved off inventory levels that are far from adequate and deteriorating affordability conditions.”
The seasonally adjusted annualized sales of 5.69M were up 3.3% month-over-month from an upwardly revised 5.51M in sales for December (previously 5.49M). Year-over-year sales increased an equally robust 3.8% (compare to November’s 15.4% year-over-year pop and December’s 0.7% increase). Sales have not been this high since February 2007 when they were 5.79M.
(recall that the NAR no longer makes data available before 2013. For more historical data to 1999 click here)
Source: National Association of Realtors, Existing Home Sales© [EXHOSLUSM495S], retrieved from FRED, Federal Reserve Bank of St. Louis, February 23, 2016.
The jump in sales demonstrate once again the strength in the housing market despite scarce inventory and the resulting increase in prices. With Spring selling season about to kick off, buyers are likely to face an ever tightening market. Per the NAR: “Competition is likely to heat up even more heading into the spring for house hunters looking for homes in the lower- and mid-market price range.” Fortunately, first-time buyers continue to hang in there. They edged up to 33% of sales; up from 32% over the last two months.
The inventory of existing homes has fallen year-over-year for 20 straight months. In January it actually increased 2.4% over December, but the 1.69M homes for sale represented a 7.1% decrease from the previous January. The recent year-over-year declines have been remarkable: August -10.1%, September -6.8%, October -4.3%, November -9.3%, and December -6.3%. Inventory hit a new absolute low measured from 1999 when the NAR began tracking. Inventory sat at 3.6 months of sales, the same as December. The market for existing homes is severely out of balance.
In this month’s report, the NAR was critical of the deal Fannie Mae struck with Invitation Homes (INVH) to securitize debt underwritten by Wells Fargo (WFC). The implication is that INVH’s rapacious appetite for buying up homes pressures the inventory of single-family homes for sale. Blackstone is a majority shareholder of INVH which recently went public. INVH is one of the largest owners of single-family rental homes. Given my bullishness in this space, I loaded up on INVH on the first day of trading.
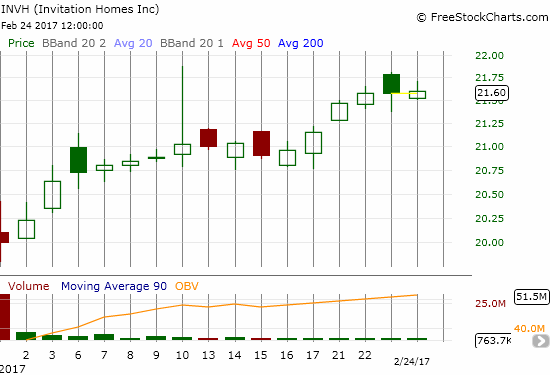
Source: FreeStockCharts.com
The share of investors remained flat at 15% of sales. In October that share dropped from 14% to 13% which was the same share in August. In November, investor share of sales dropped to 12%. The share was 11% in July. As context, recall July’s share was the lowest share since 9% in July, 2009. In February, investors bought 18% of existing homes which was the highest share since April, 2014. Investor interest has been quite volatile.
The NAR did not provide much detail on regional existing home sales except to say that “all major regions except for the Midwest saw sales gains last month.”
January’s 7.1% year-over-year increase in the median price of an existing home represents the 59th consecutive month of year-over-year increases. The median price of $228,900 is a small drop from December’s $232,200. With the all-time record fading further into the distance ($247,700 set in June, 2016), it is becoming increasingly possible that a year-over-year DECLINE in price may finally occur this year.
Single-family sales increased on a monthly basis (2.6%) and increased on a yearly basis by 3.7%. November’s 16.2% year-over-year surge is looking more and more like an anomaly. The median price of $230,400 dropped below December’s $233,500 and November’s $236,500, and increased 3.8% year-over-year. Like overall existing home sales, it is starting to look like 2017 could be the year when a year-over-year decline in price actually happens for single-family homes.
“Single-family home sales grew 2.6 percent to a seasonally adjusted annual rate of 5.04 million in January from 4.91 million in December 2016, and are now 3.7 percent above the 4.86 million pace a year ago. The median existing single-family home price was $230,400 in January, up 7.3 percent from January 2016.”
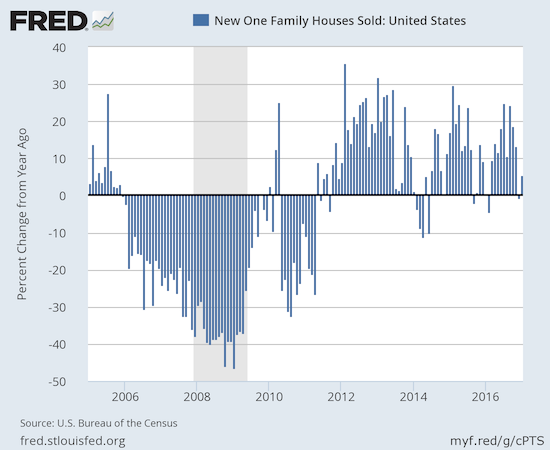
New Residential Sales – January, 2017
New home sales were the big headline in August as July sales soared to 622,000 and a fresh post-recession high. I predicted that post-recession peak would not get challenged until the next Spring selling season. While new home sales in January increased 3.7% over December and 5.5% above January, 2016, my assessment still looks well intact with the Spring selling season right around the corner. January’s new home sales hit 555,000, 12% below the post-recession peak.
New single-family home sales for December were revised downward slightly from 536,000 to 535,000. Recall that December brought an end to an impressive streak of year-over-year gains: November +17.7%, October +17.8%, September +24.9%, August +10.7%, July +24.9%, and June +18.2%. January’s print seems to confirm that the hot streak will be over for a while. Note that I am FAR from bearish on new home sales. The extremely tight inventory conditions for existing homes supports the flow of sales for new homes.
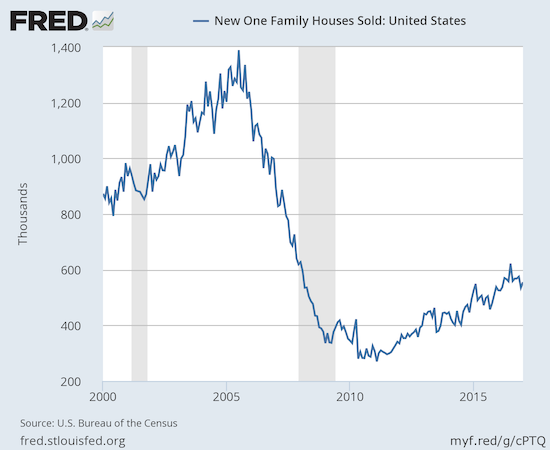
Source: US. Bureau of the Census, New One Family Houses Sold: United States [HSN1F], retrieved from FRED, Federal Reserve Bank of St. Louis, February 7, 2017.
New home inventory slid slightly from 5.8 months of supply to 5.7. This level sits in (surprisingly) sharp contrast with the much more scarce inventory of existing homes.
New home sales again exhibited a large range of year-over-year changes across regions. The Northeast followed December’s torrid 48.4% gain with a 22.2% gain for January. The Midwest only gained 4.5% while the West soared by 16.2%. The Southeast was the big laggard with a 1.0% drop; the region was flat in December.
Home Builder Confidence: The Housing Market Index– February, 2017
The Housing Market Index (HMI) was the most impressive data point of my Housing Market Review to end 2016. The story so far in 2017 is a cooling of this red hot confidence.
The Housing Market Index (HMI) registered at 65 for February. This is a 2 point drop from January and a 4 point drop from 2016’s historically strong close. As I noted in December, I do not expect confidence to get much higher than the recent high because sentiment was last that high at the top of the last housing bubble. The current pullback seems to confirm that sentiment has peaked for now.
The National Association of Home Builders (NAHB) implied in November that the HMI might drop in the wake of the election. In December, the NAHB gave credit to the election for a surge in the HMI. For January, the NAHB referred back to December’s observations. The NAHB has taken the two month pullback in stride by implying that sentiment had overheated. (Yes, the NAHB keeps backing into explanations for the changes in the HMI!). Thus, the NAHB has confirmed my assessment of a likely top in sentiment.
“While builders remain optimistic, we are seeing the numbers settling back into a normal range…With much of the decline this month resulting from a decrease in buyer traffic, builders continue to struggle to minimize costs while dealing with supply side challenges such as a lack of developed lots and labor shortages…Despite these constraints, the overall housing market fundamentals remain strong and we expect to see continued growth this year as some of these concerns are addressed.”
All three components of the HMI dropped with the traffic of prospective buyers taking a plunge back to October’s level. This component looks like it “overheated” the most. This component is back to levels it has briefly visited over the past 4 years, so it has truly normalized.
Click for a larger view…
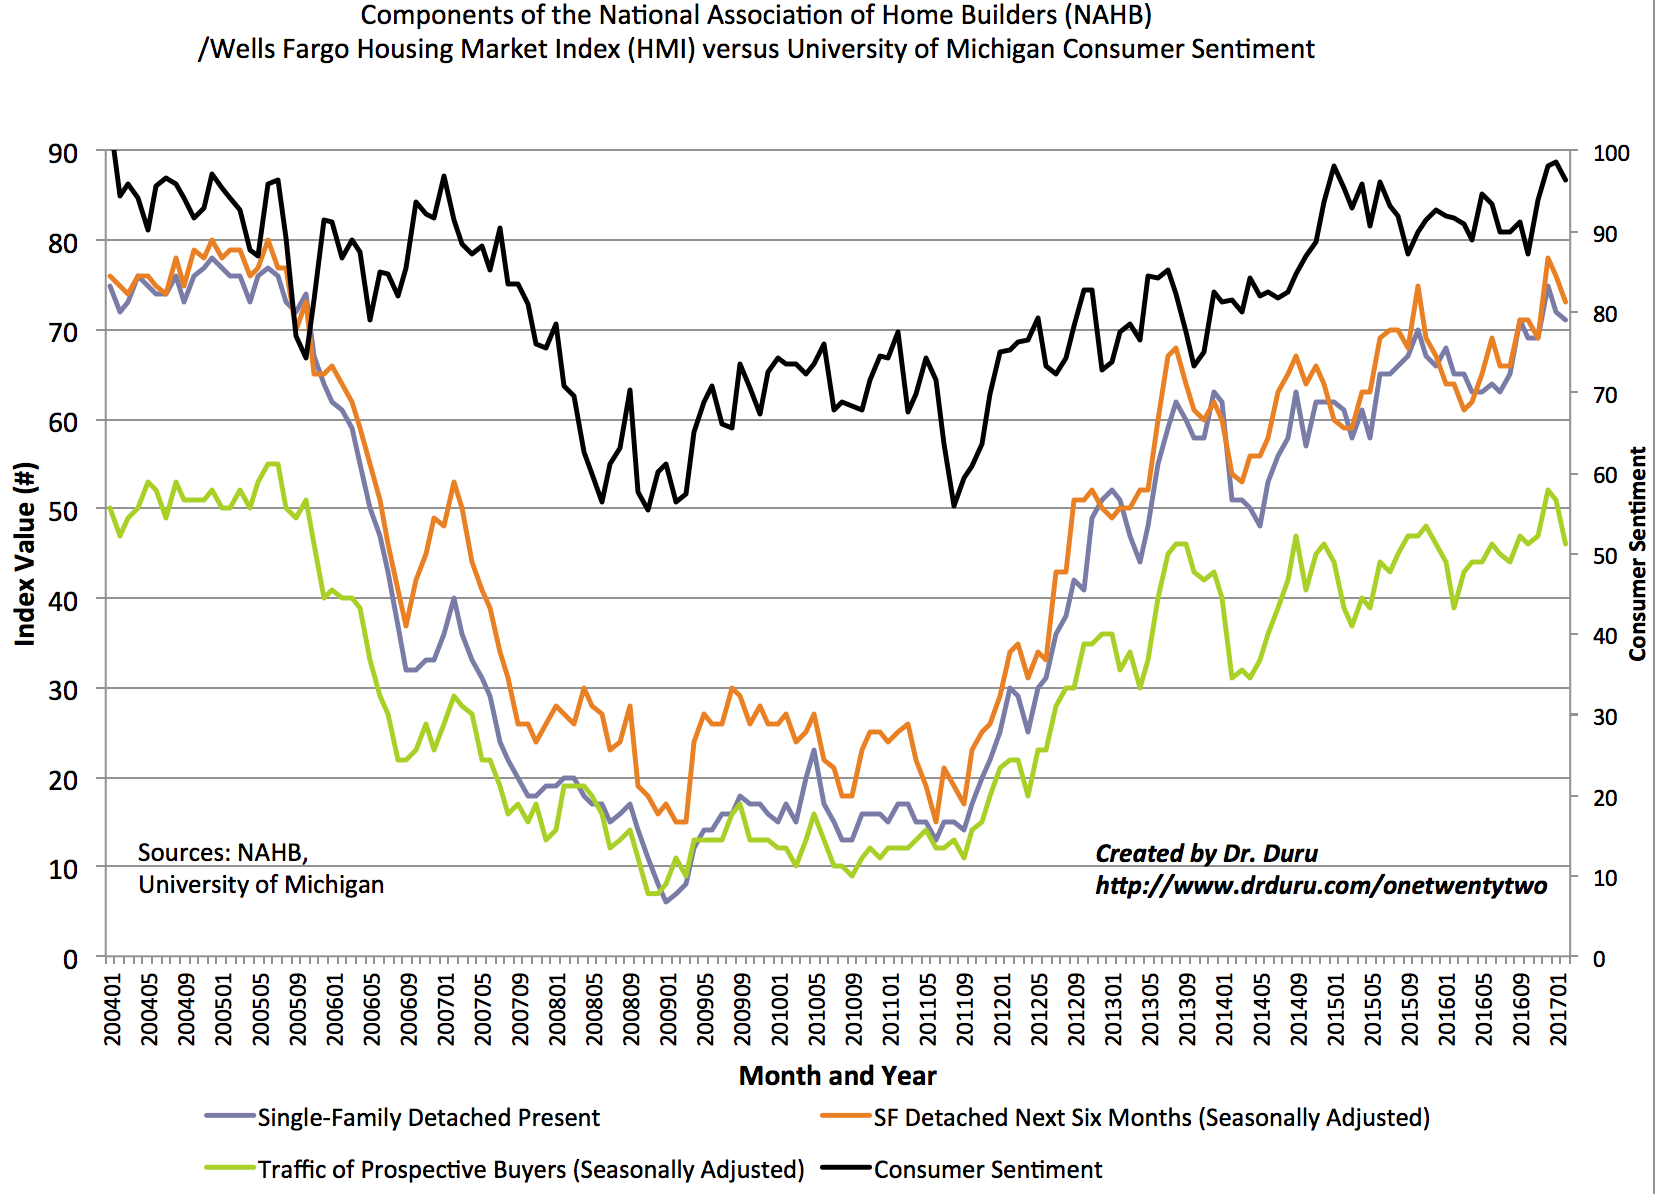
Source: NAHB
The regional changes in HMI were again mixed. Surprisingly, the West stayed flat at 75, but its big plunge happened in January as December closed out at 86. As I noted before, more “normal” readings in the West by themselves should keep overall HMI capped. The Midwest and the South dropped while the Northeast experienced its own plunge from January’s 51 to 41 in February.
This kind of volatility in the HMI is a bit unusual, so I am definitely on watch for a major and sustained shift in HMI’s trend and/or dynamics.
Parting thoughts
Toll Brothers (TOL) stole the spotlight from home builders in recent weeks. Investors gapped TOL to a new 14-month high in response to earnings this week. TOL initiated a $.08/share dividend which should provide a bit of support for the stock. However, I strongly suspect that this dividend is a signal that TOL does not expect a burst of accelerated growth anytime in the near future.
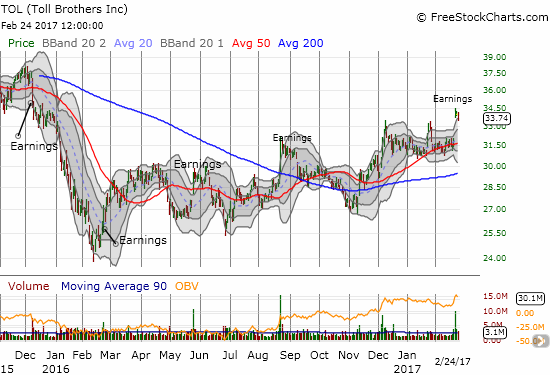
Source: FreeStockCharts.com
Century Communities (CCS) reported strong earnings two weeks ago. The market’s initial response was positive but CCS reversed all its post-earnings gains from there. I will take this reversal as a small buying opportunity especially since at least one analyst (FBR & Co.) reiterated its outperform rating on CCS and hiked its price target from $26 to $27. I am hearing anecdotally that the Atlanta housing market has heated up again, and it seems the move CCS made into Atlanta may prove quite timely (note that I was very skeptical about the move). I plan to review the earnings report soon. From a technical perspective, CCS has printed a relatively normal and benign pullback from a quick spurt to an all-time high.
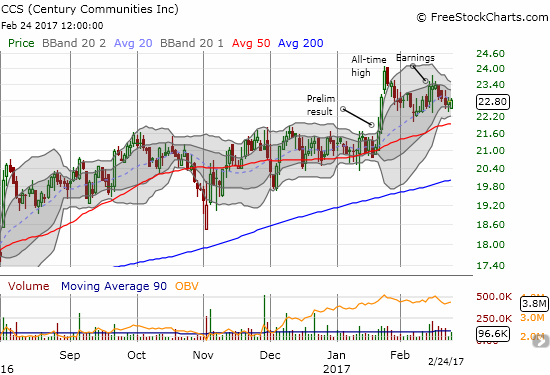
Source for charts: FreeStockCharts.com
CCS and TOL have two of the most promising charts among the home builders I follow. An interesting dichotomy has developed between stocks that are breaking down like Meritage Homes (MTH) and LGI Homes (LGIH) and stocks right on the edge of a fresh breakout like D.R. Horton (DHI) and KB Home (KBH). Pulte Homes (PHI) had an excellent January capped by its earnings report, yet the stock has failed to make any new progress since then. Surprise of the month goes to M.D.C. Holdings, Inc. (MDC) which broke out to a new 18-month high. I have some catching up to do on this little followed regional builder! The stock is still VERY cheap at 1.2 price/book and only 0.7 price/sales. The trailing P/E is 14.9 and forward P/E is 10.9. (Data from Yahoo Finance).
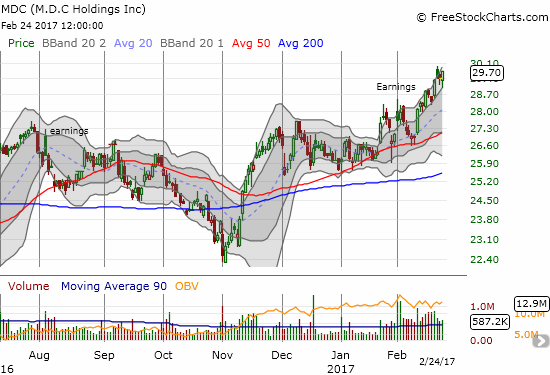
Source for charts: FreeStockCharts.com
Stay tuned for additional trade ideas as the housing sector will likely experience extra volatility from all sides in the coming months: political, economic, fiscal, and monetary.
Be careful out there!
Full disclosure: long TOL and INVH