
AT40 = 63.3% of stocks are trading above their respective 40-day moving averages (DMAs) (25th overbought day)
AT200 = 41.0% of stocks are trading above their respective 200DMAs
VIX = 15.7
Short-term Trading Call: cautiously bearish
Stock Market Commentary
The broken record in the stock market finally came to an end. The small nick in the overbought period opened wide enough to bring an end to the overbought period which began almost two calendar months ago. The stock market is overbought when AT40 (T2108), the percentage of stocks trading above their respective 40-day moving averages (DMAs), closes above 70%. This latest overbought period lasted 27 days. Over this time, the S&P 500 (SPY) gained 4.0%. This performance is exactly in line with expectations as defined by the trendline below (see “S&P 500 Performance During Overbought and Oversold Trading Conditions” for more details).
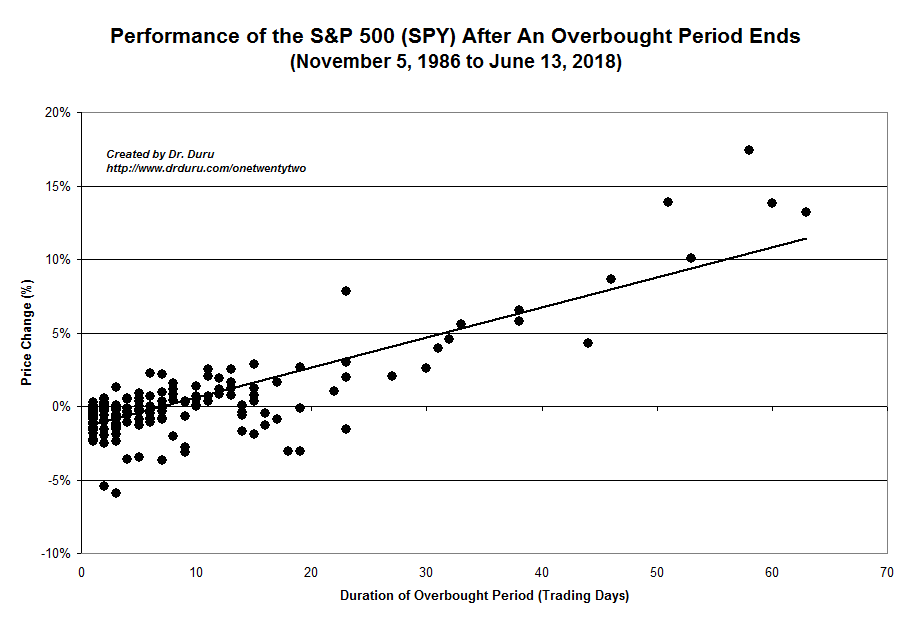
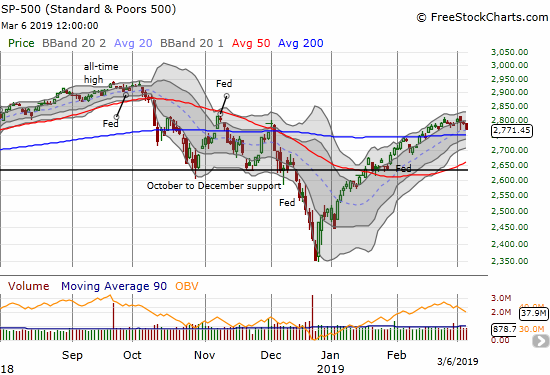
As I noted in the last Above the 40 post, the overbought period could end without a dramatic pullback. Indeed, the S&P 500 closed today with just a 0.7% loss. It is the index’s third straight down day, but it is still only off 1.1% from its overbought peak. Note that the S&P 500 has not traded down three straight days since the climactic December low.
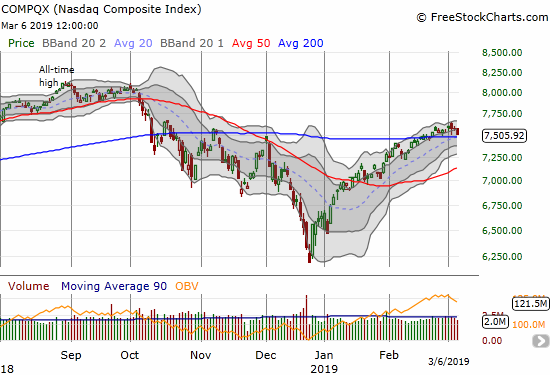
While the S&P 500 still looks benign, a broader view reveals a more precarious, and telling, context for the stock market. The NASDAQ (NDX) is already hovering just above its 200DMA after a 0.9% loss on the day.
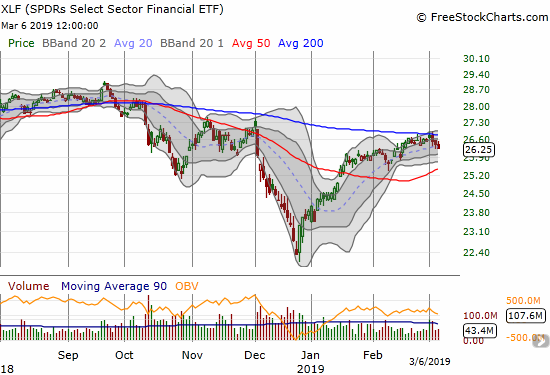
Financials look more and more precarious as the Financial Select Sector SPDR ETF (XLF) is losing its battle with 200DMA resistance. XLF looks ready to test rising 50DMA support.
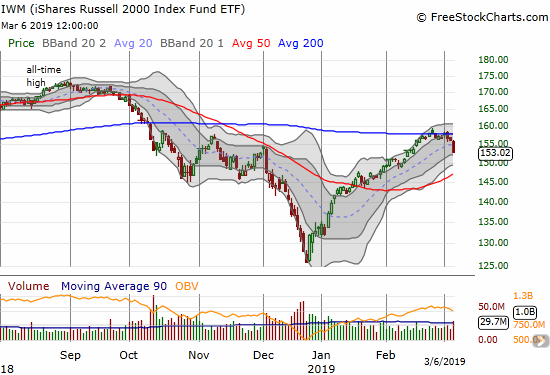
The iShares Russell 2000 ETF (IWM) lost its battle with 200DMA resistance in definitive style with a 2.0% pullback. A test of rising 50DMA support is in play.
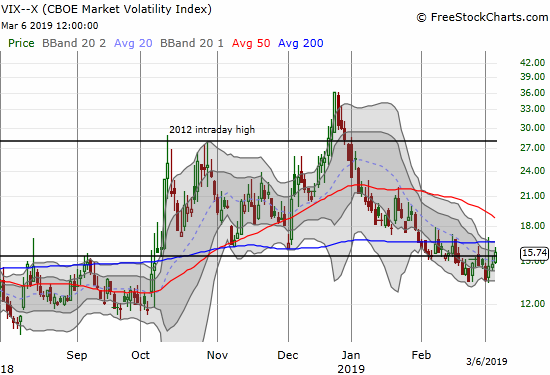
With a range of weakness in the major indices, I am not surprised to see the volatility index, the VIX, perk up enough to push through its 15.35 pivot line. This close is a 3-week high and represents just a hint of reawakening concern about the increasingly precarious trading landscape.
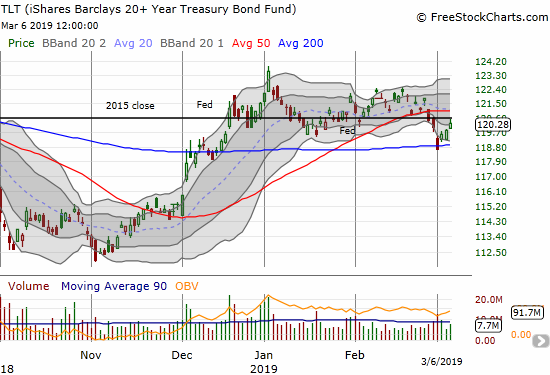
Bond yields are backing down as if to confirm the rising concerns. The iShares 20+ Year Treasury Bond ETF (TLT) has closed up 3 straight days. I missed the last swing down; this time, I am primed to buy put options as a hedge to my new cautiously bearish short-term trading call.
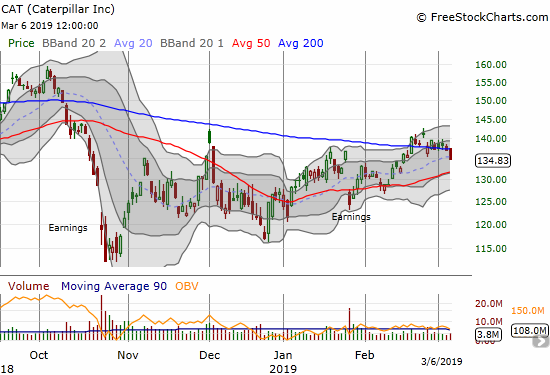
Per rule, I switched my short-term trading call to (cautiously) bearish with the end of the overbought period. With the stock market in a more precarious position, I decided not to wait to make some bearish trades. I started small and tentative with a few puts in Caterpillar (CAT); recall from previous posts that I was waiting for CAT to drop below its 200DMA before trading it.
Close to the end of trading, the market weakness looked assured. I loaded up on put options on SPY. With its 200DMA at $275, I bought two tranches of weekly puts at the $275 strike. I chose a quick expiration in expectation that the end of overbought trading will resolve quickly: a rapid swoosh into a 200DMA test and maybe even breakdown or a rapid rebound. In the case of a rapid rebound, I will turn my attention to indices trading below their 200DMA for fresh bearish plays.
The downgrade in my short-term trading call to cautiously bearish means several things. First and most importantly, I will not buy any more stocks or call options except in the most unique of setups (see some charts below). Second, I will actively seek out bearish plays and assuming supports will break and resistances will hold. Third, I am now inclined to take profits quickly on any short-term bullish plays. I am NOT, however, hitting the outright sell button because the S&P 500 still has two layers of support, its 50 and 200DMAs, between here and a return to an outright bearish market. If the market rebounds quickly back into overbought trading, I will be even MORE bearish once that fresh overbought period ends.
Stock Chart Reviews
Ambercrombie & Fitch(ANF)
Ambercrombie & Fitch (ANF) printed an impressive post-earnings breakout. The stock closed at a 6-month high and above what now looks like a bottoming pattern with a wide consolidation range. ANF is a clear buy-the-dip stock with a stop below 200 or 50DMA support (depending on timeframes and risk tolerance). This is NOT the time to chase a stock like ANF higher. It trades well above its upper Bollinger Band (BB); under bearish conditions, ANF should settle back to $24 soon and perhaps quickly test 200DMA support.
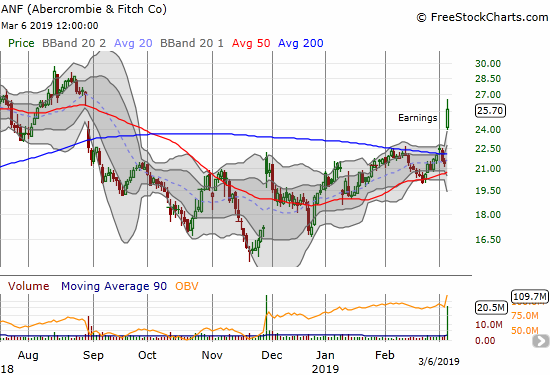
Ambercrombie & Fitch (ANF) broke out above its 200DMA for a 20.4% gain.
Apple (AAPL)
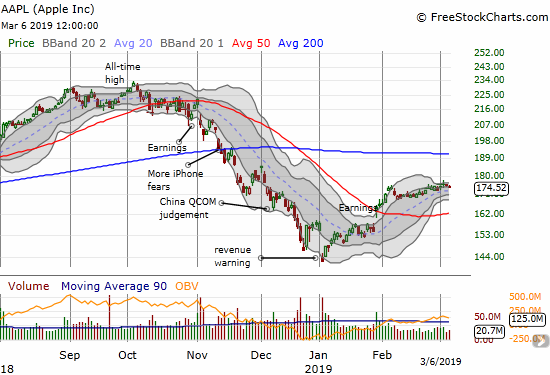
I was looking forward to trade Apple (AAPL) in the direction of a burst from a Bollinger Band (BB) squeeze. That squeeze came and went with absolutely zero fireworks. AAPL continues to drift along looking for a catalyst.
Salesforce.com (CRM)
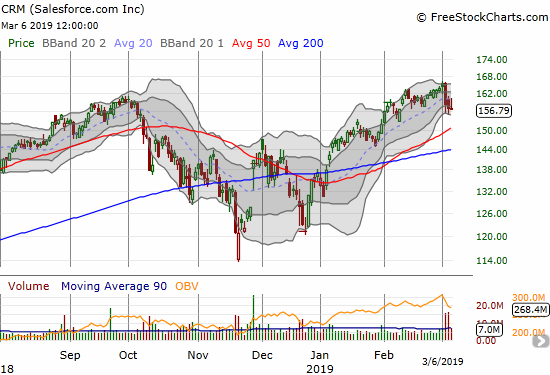
Salesforce.com (CRM) suffered a large pre-earnings drawdown on Monday along with a large group of cloud stocks. The post-earnings action was much more dramatic in the after hours than the next two days of trading. CRM even spent some time in positive territory. The stock does not look toppy in a bearish way, but I think the stock is well overdue for a rest and some consolidation time. I expect the 50/200 DMAs will provide solid support for any deeper pullback.
Dillard’s (DDS)
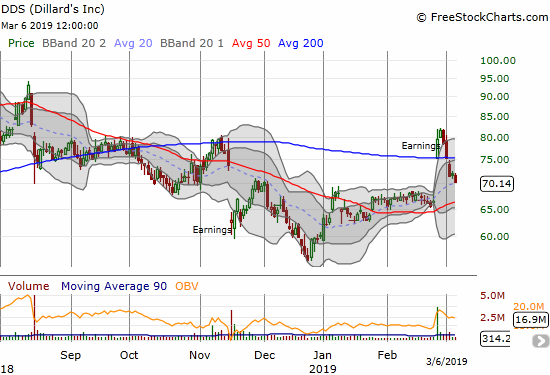
Investors are struggling to make up their post-earnings minds on retailers like Dillard’s (DDS). The stock soared 19.8% on a post-earnings 200DMA breakout. After one day of follow-through, sellers returned with a vengeance. The stock closed today on its rising 20DMA support but looks ready for a test of 50DMA support.
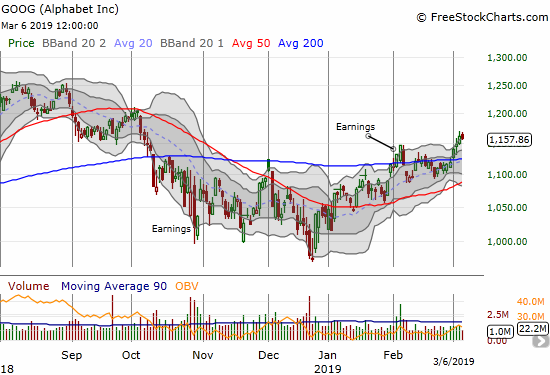
Alphabet (GOOG)
The market’s “safety” stocks are making themselves known in the current pullback. While the stock market stalled and swooned from Friday to today, Alphabet (GGOG) broke out above 200DMA resistance and confirmed the move with follow-on buying. I bought a 1160/1170 call spread expiring this Friday on the breakout. The spread still has some profit, but I decided to hold the position given I think GOOG will soar further if the market turns right around from the end of overbought conditions. The relative strength is intriguing as well.
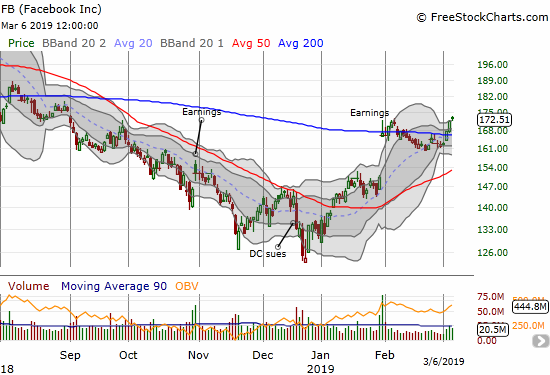
Facebook (FB)
Like GOOG, Facebook (FB) has been ignoring the softening tone of the market with 200DMA breakout fireworks. My strategy to pair call options with short FB shares is staying even. I am thinking of getting more aggressive on the call side given this relative strength suggests FB will not come back down again easily. I took profits on one call on Monday’s breakout. I rolled over the remaining position today from a $167.50 strike to a $175 strike expiring next week, going from 2 to 3 calls.
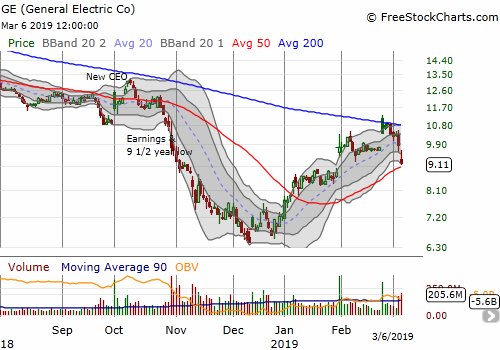
General Electric (GE)
I threw up my hands on General Electric (GE) at the end of October when the stock cratered to a new 9 1/2 year low. I held onto my call options with the January, 2019 calls already near worthless at that time. My remaining January 2020 $15 calls are clinging to value and I have very low expectations. The stock finally traded back to that late October level at the end of January, and it gave one last gasp of hope with a gap up into 200DMA resistance in late February. Sellers have been in control ever since. Poor guidance from the CEO sealed the deal today. I have no interest in GE until/unless it retests the December lows and/or confirms a 200DMA breakout.
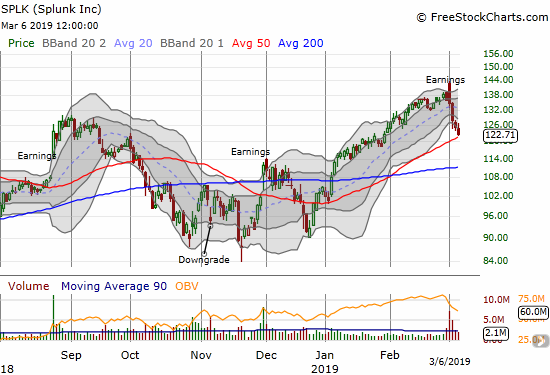
Splunk (SPLK)
Last week, I described the post-earnings topping pattern in Splunk (SPLK). On Monday I jumped into a March $130/125 put spread the next day. With the stock already testing 50DMA support under the $123 level, I will likely take profits well ahead of expiration.
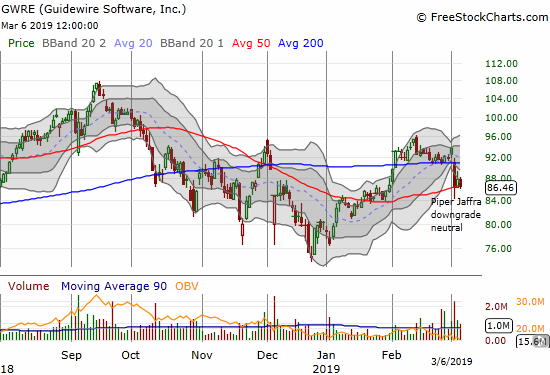
Guidewire (GWRE)
I laid out the case for Guidewire (GWRE) a month ago and bought shares shortly after that. Another analyst had different ideas and knocked the stock for a loop this week. With my short-term trading call at cautiously bearish, I am not in a rush to add to my position here.
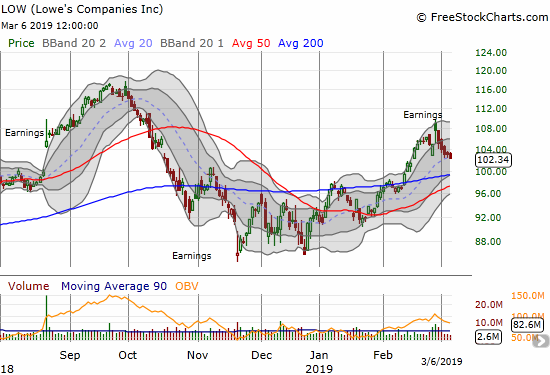
Lowe’s Companies (LOW)
Lowe’s Companies (LOW) was looking good after earnings even with an intraday low that at one point erased the entire gain on the day. Sellers have not stopped since then. LOW is an example of a stock I will consider trading on the bullish side on a test of rising/converged support at its 50 and 200DMAs almost no matter what AT40 is signalling at the time.
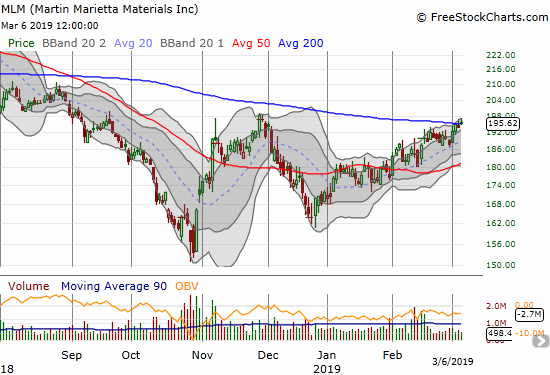
Martin Marietta Materials (MLM)
Before today, I had MLM on a buy list in anticipation of a clean 200DMA breakout. I put the stock back on the shelf and now doubt it can push past the November peak in the short-term. I will reconsider strategy on a 50DMA test.
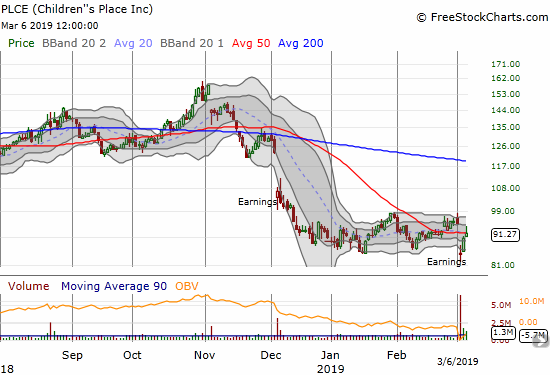
Children’s Place (PLCE)
Children’s Place (PLCE) continues to fascinate me. The stock suffered a post-earnings gap down and a 10.3% loss to a 2 year 3 month loss. Buyers stepped in right after that. I did not even think about making a contrarian buy this time. Today the stock closed the entire gap for a brief moment. If the stock stabilizes around its 50DMA, I will consider jumping back in once my short-term trading call is not some flavor of bearish.
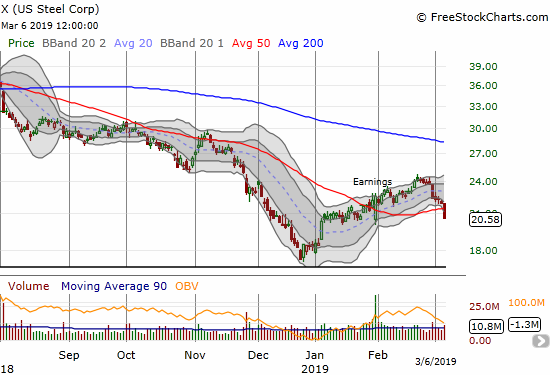
U.S. Steel (X)
When the stock market launched into the last overbought period, I charted U.S. Steel (X) as a stock that would soon test and breakout above its 50DMA. U.S. Steel was able to ride the coattails of the overbought market for most of February. The gas finally ran out last week. Today the stock lost another 6.0% on a 9th straight down day. Given my cautiously bearish trading call, U.S. Steel is a candidate for a short on a retest of 50DMA resistance. I do not want to chase it downward.
— – —
FOLLOW Dr. Duru’s commentary on financial markets via email, StockTwits, Twitter, and even Instagram!
“Above the 40” uses the percentage of stocks trading above their respective 40-day moving averages (DMAs) to assess the technical health of the stock market and to identify extremes in market sentiment that are likely to reverse. Abbreviated as AT40, Above the 40 is an alternative label for “T2108” which was created by Worden. Learn more about T2108 on my T2108 Resource Page. AT200, or T2107, measures the percentage of stocks trading above their respective 200DMAs.
Active AT40 (T2108) periods: Day #42 over 20%, Day #40 over 30%, Day #39 over 40%, Day #38 over 50%, Day #34 over 60% (overperiod), Day #1 under 70% (underperiod ending 27 days over 70%)
Daily AT40 (T2108)
")
Black line: AT40 (T2108) (% measured on the right)
Red line: Overbought threshold (70%); Blue line: Oversold threshold (20%)
Weekly AT40 (T2108)

*All charts created using freestockcharts.com unless otherwise stated
The T2108 charts above are my LATEST updates independent of the date of this given AT40 post. For my latest AT40 post click here.
Related links:
The AT40 (T2108) Resource Page
You can follow real-time T2108 commentary on twitter using the #T2108 or #AT40 hashtags. T2108-related trades and other trades are occasionally posted on twitter using the #120trade hashtag.
Be careful out there!
Full disclosure: long UVXY calls, long CAT puts, short FB shares and long FB calls, long GOOG call spread, long GE calls, long SPLK put spread, long GWRE, long SPY puts, net long AAPL
*Charting notes: FreeStockCharts.com stock prices are not adjusted for dividends. TradingView.com charts for currencies use Tokyo time as the start of the forex trading day. FreeStockCharts.com currency charts are based on Eastern U.S. time to define the trading day.