
AT40 = 76.8% of stocks are trading above their respective 40-day moving averages (DMAs) (25th overbought day)
AT200 = 45.8% of stocks are trading above their respective 200DMAs
VIX = 13.6
Short-term Trading Call: neutral
Stock Market Commentary
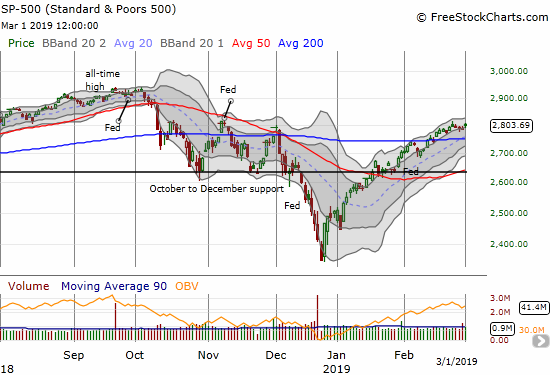
The trading action on the major indices is practically a broken record. An extended overbought rally just grows older and the major indices churn and churn with an ever so slight upward bias. The slog of the US-China trade negotiations adds to the tantalizing nature of the trading as extreme optimism about the wheeling and dealing helps motivate the market’s patient levitation.
Last week, I looked at the burst of optimism Sunday night over the latest trade headlines and found skepticism from the behavior of the currency markets. Sure enough, the S&P 500 (SPY) gapped higher on Monday only to fade its way to a near flat close. The index spent the next three days drifting ever so slightly downward. Friday delivered a 0.7% gain that left the week in positive territory and maintained that ever so slight upward bias.
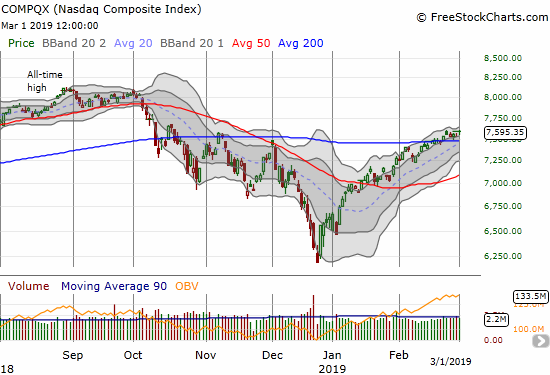
The NASDAQ followed the same script as the S&P 500 except the tech-laden index managed to leap off the bottom of its upper Bollinger Band (BB) and reach for the top of the channel.
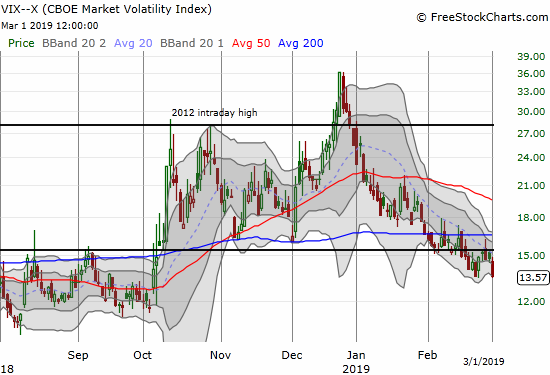
The volatility index, the VIX, put another exclamation point on the benign trading environment with a resounding drop that closed even with a 5-month low. The 15.35 pivot is now starting to look more like resistance than a pivot.
The trading action on bonds took me by surprise; bond yields took a leap higher. The iShares 20+ Year Treasury Bond ETF (TLT) lost 1.1% and even closed below its 200DMA. I missed a trade on this move because I blithely assumed that the Federal Reserve’s recent capitulation would keep a downward bias on rates. The 50DMA breakdown was a clear signal to go short and/or buy put options. I am also surprised the stock market rallied alongside this rate surge.
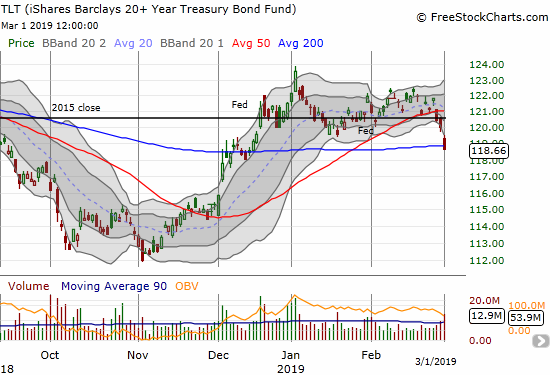
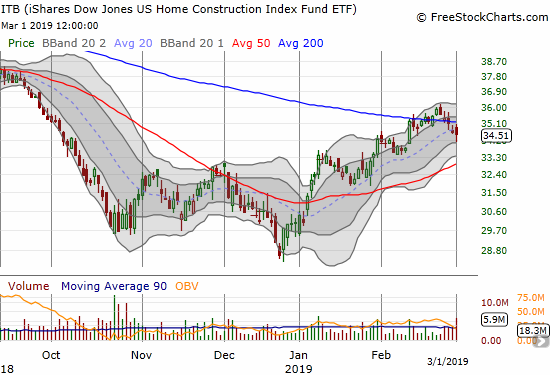
The rate surge put further pressure on the stocks of home builders and my remaining seasonal trades. This past week took down my April call options on the iShares US Home Construction ETF (ITB) from a nice gain to a loss. I am sticking by the trade with an expectation that the one-day surge in February will provide support for the next 200DMA breakout. Given time is running out, I will have to take profits on the next (presumed) upswing.
AT40 (T2108), the percentage of stocks trading above their respective 40-day moving averages (DMAs), no longer underlines the benign trading environment. While AT40 is on day #25 of an overbought period, it finally fell out of the 80% overperiod. That lofty level lasted an incredible 12 days. AT40 has not closed this low since January 30th when my favorite technical indicator first punched above 80% during this overbought period. This drop is a small nick in the overbought period that borders on a bearish divergence. The next week of trading should provide more clarity.
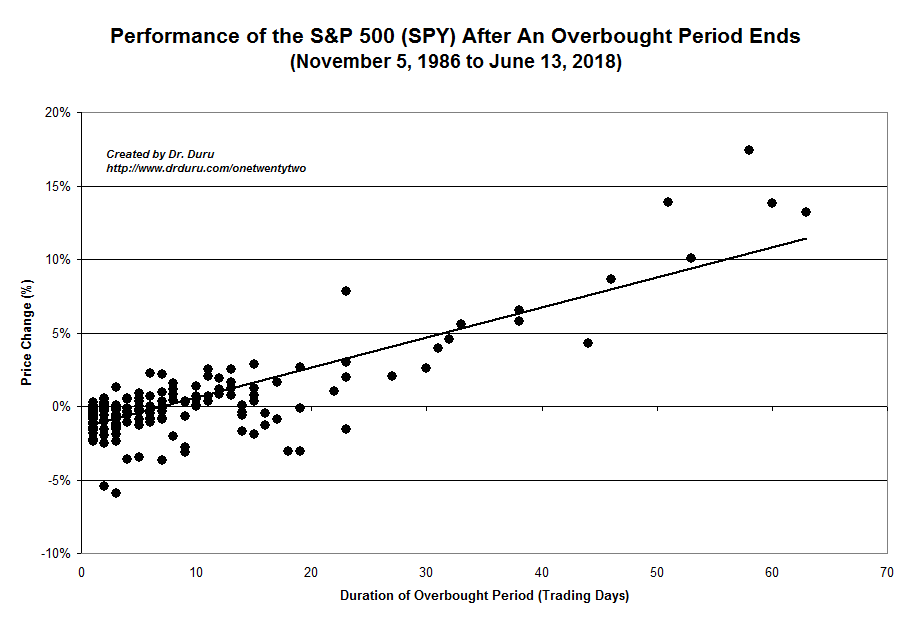
The S&P 500 is up 5.2% during this extended overbought rally. The chart below shows that the index should have a strong upward bias from here if the overbought period continues. The index’s performance is also about 1 percentage point above where it would be if the overbought period ended on this 25th day. In other words, the overbought period could easily end in the next few days without a dramatic pullback and stay well within expectations. This observation is yet one more reason why it makes sense to wait for the overbought period to end before flipping bearish on the stock market.
Stock Chart Reviews
Box (BOX)
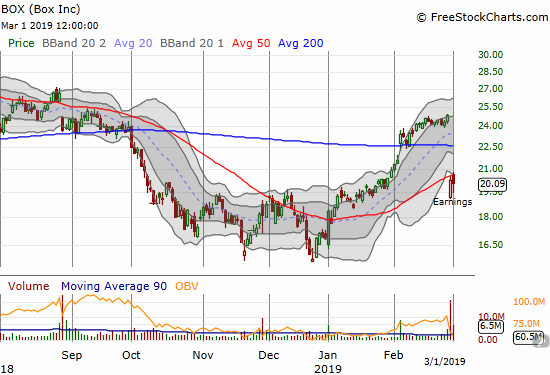
Box (BOX) suffered a post-earnings plunge on Thursday. Sellers returned Friday to keep 50DMA resistance intact. The industry for cloud storage solutions is crowded and competitive. I am still waiting for some kind of shakeout. In the meantime, BOX is a short with a tight stop on a close above 50DMA resistance.
Caterpillar (CAT)
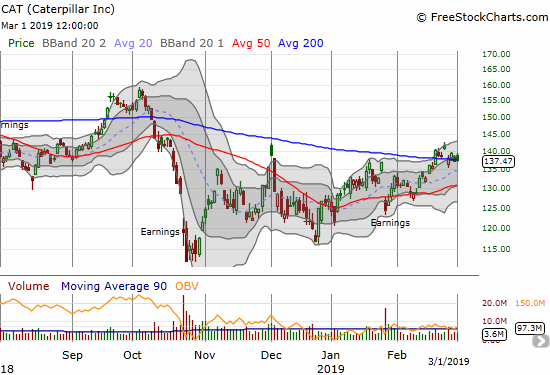
Caterpillar (CAT) is tightly pivoting around its 200DMA. I am surprised the stock did go down for a loss given the surge in interest rates. CAT is still the perfect hedge on a negative reaction to the US-China trade negotiations. However, as I mentioned in an earlier post, the sluggish and benign nature of trading means that there is little point in buying puts until a clean 200DMA breakdown. Even then, the rising 50DMA will likely provide an extended rest stop for the next pullback in CAT. I realize this approach leaves me vulnerable to a sudden drawdown in the stock market, so I am looking to extend some short positions in stocks.
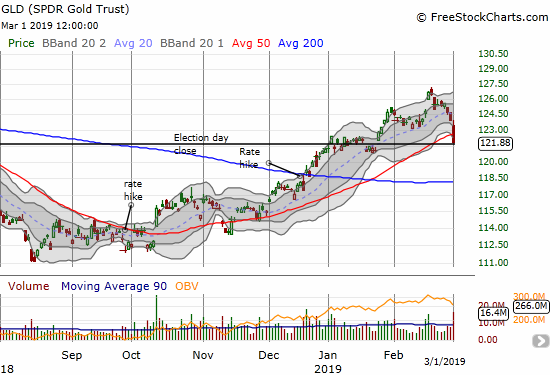
SPDR Gold Trust (GLD)
The surge in interest rates knocked precious metals for a loop. SPDR Gold Trust (GLD) suffered a 50DMA breakdown on high volume. The move looks very bearish for gold. I was very optimistic when GLD gapped up and broke out to a 10-month high. That moment turned out to be peak optimism as sellers have pressured GLD ever since. The stop I mentioned in that post triggered two days later and preserved some profit in my call options. I will buy call options again on a test of 200DMA support or a fresh move above the 50DMA.
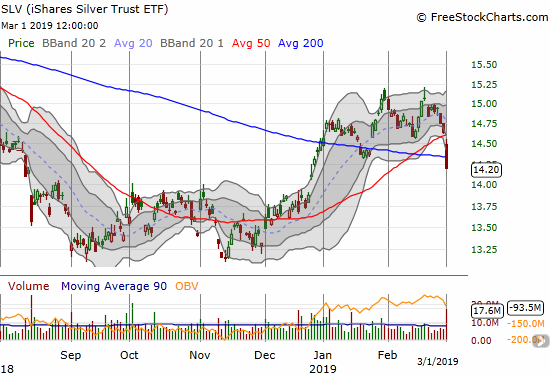
iShares Silver Trust ETF (SLV)
The iShares Silver Trust ETF (SLV) suffered an even worse breakdown than GLD in the face of the surge in rates. Unlike my GLD call options, I did not put in a stop for the SLV calls. Now, I will just ride them out to the March expiration. SLV also looks more toppy than GLD, so I am NOT looking to refresh a short-term trade in SLV anytime soon.
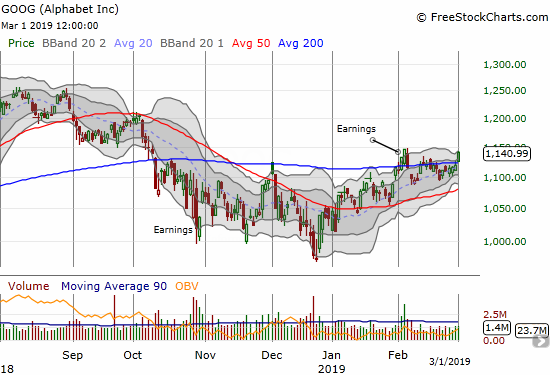
Alphabet (GOOG)
If Alphabet (GGOG) is any indication, big cap tech stocks are finally ready to power the next move higher in the major indices. GOOG made its second 200DMA breakout in a month. The odds favor the second time being a charm, so I have GOOG on my list of “buy the dip” stocks. If Monday opens higher, I will start with a call spread expiring in two weeks and/or a calendar call spread with the short side expiring this week.
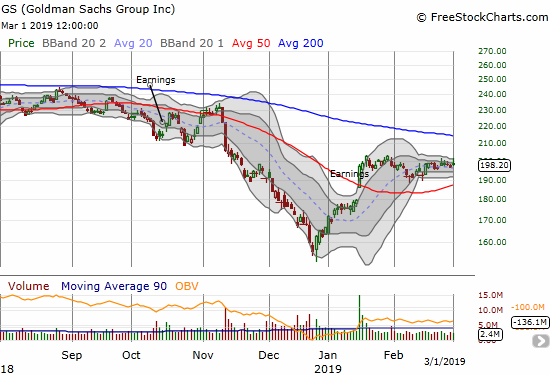
Goldman Sachs (GS)
Goldman Sachs (GS) delivered a profit shortly after I shorted the stock. I decided to hold for at least a test of 50DMA support, yet the stock rebounded quickly. Now I am back to flat in the position and waiting for the next move out of this elongating period of consolidation. I will add to the position on a test of 200DMA resistance if the test comes before the next pullback.
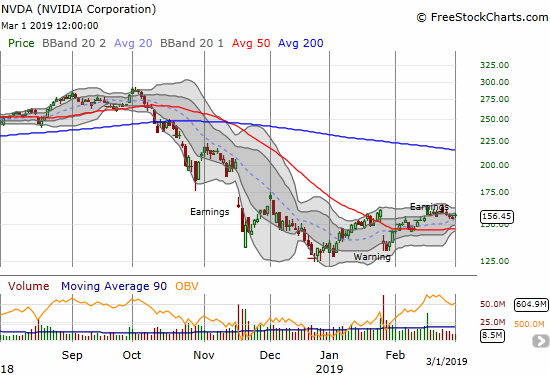
Nvidia (NVDA)
Nvidia (NVDA) has fallen into its own post-earnings consolidation period. While the stock quickly reversed its post-earnings gains, this is still a stock to watch. It is a buy on a breakout and even better buy on a test of 50DMA support. The January and December lows are obvious spots for stop-losses.
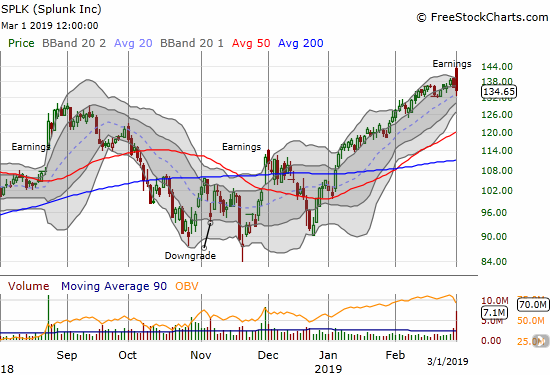
Splunk (SPLK)
Splunk (SPLK) had a wild post-earnings ride. After gapping up right from the open, traders quickly faded the stock for a small loss. This is toppy action. I am looking to buy puts on follow-through selling.
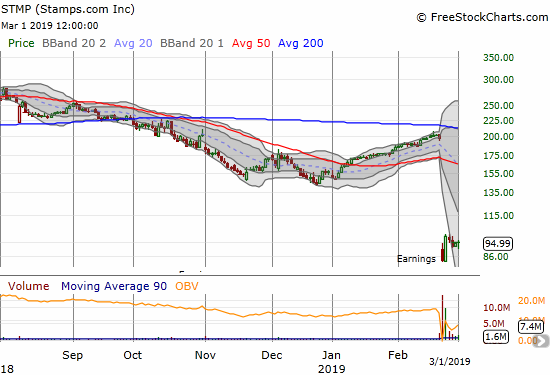
Stamps.com (STMP)
I laid out post-earnings trading rules for Stamps.com (STMP) last week. After seeing the stock perfectly rally off the post-earnings low, I pulled the trigger on a long a little early with a March 1/8 $95 calendar call spread. The stock kept soaring higher right to $100. I ended up wishing I had gone with straight calls AND waited for the close to look for a short opportunity. The stock pulled back from $100 and drifted lower. A small rally to close the week took me out the calendar call position at my targeted profit level. My new trading rule for STMP rule is to go long over $100 and short under last week’s low ($91.96).
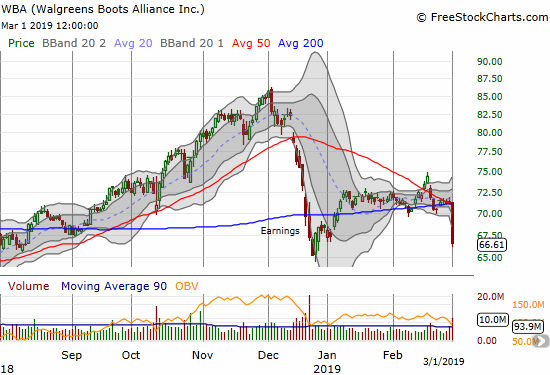
Walgreens Boots Alliance (WBA)
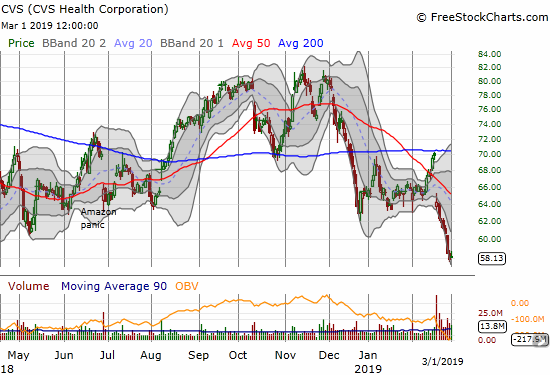
Walgreens Boots Alliance (WBA) took a 6.4% plunge after providing disappointing guidance to investors. I read through the transcript of the company’s comments at the Leerink Partners Global Healthcare Conference for some signs that my bearish thesis is playing out. There are still no clear signs, but I have seen GoodRX commercials and some more brand awareness.
WGA described two key headwinds: 1) reimbursement pressures that the company has not been able to mitigate as expected through negotiated contracts, and 2) price deflation from generic drugs. Current cost reductions are a small tailwind to the business. The company is also dealing with dynamic competitive pressures from CVS Health Corporation (CVS) which merged with Aetna last year. Aetna’s business has naturally migrated toward CVS, but WBA says that negative comps are going away soon. There are several challenges with international retailing as well.
The company is under-going a major cost restructuring program and digitizing its business with data to make it smarter and more efficient. These are tailwinds I cannot ignore. So, if the stock does not soon break through the December lows, I will take profits on my latest short position and rethink my strategy.
— – —
FOLLOW Dr. Duru’s commentary on financial markets via email, StockTwits, Twitter, and even Instagram!
“Above the 40” uses the percentage of stocks trading above their respective 40-day moving averages (DMAs) to assess the technical health of the stock market and to identify extremes in market sentiment that are likely to reverse. Abbreviated as AT40, Above the 40 is an alternative label for “T2108” which was created by Worden. Learn more about T2108 on my T2108 Resource Page. AT200, or T2107, measures the percentage of stocks trading above their respective 200DMAs.
Active AT40 (T2108) periods: Day #39 over 20%, Day #37 over 30%, Day #36 over 40%, Day #35 over 50%, Day #31 over 60%, Day #25 over 70% (80% overperiod lasted 12 days and ended Wednesday)
Daily AT40 (T2108)
")
Black line: AT40 (T2108) (% measured on the right)
Red line: Overbought threshold (70%); Blue line: Oversold threshold (20%)
Weekly AT40 (T2108)

*All charts created using freestockcharts.com unless otherwise stated
The T2108 charts above are my LATEST updates independent of the date of this given AT40 post. For my latest AT40 post click here.
Related links:
The AT40 (T2108) Resource Page
You can follow real-time T2108 commentary on twitter using the #T2108 or #AT40 hashtags. T2108-related trades and other trades are occasionally posted on twitter using the #120trade hashtag.
Be careful out there!
Full disclosure: long UVXY calls, long ITB calls, short WBA, long GLD, long SLV shares and calls
*Charting notes: FreeStockCharts.com stock prices are not adjusted for dividends. TradingView.com charts for currencies use Tokyo time as the start of the forex trading day. FreeStockCharts.com currency charts are based on Eastern U.S. time to define the trading day.