
The latest airing of Marketplace included a segment titled “Making sense of housing market data.”
The segment explained the five key housing data points that Marketplace uses to gauge the health of the housing market: housing starts, new home sales, existing home sales, pending home sales, and the Case-Shiller Home Price Index. In my monthly reviews of the housing market, I find it most useful and sufficient to analyze housing starts (single family), new home sales, existing home sales, the Housing Market Index (HMI), and the price of the stocks of home builders, especially the iShares US Home Construction ETF (ITB).
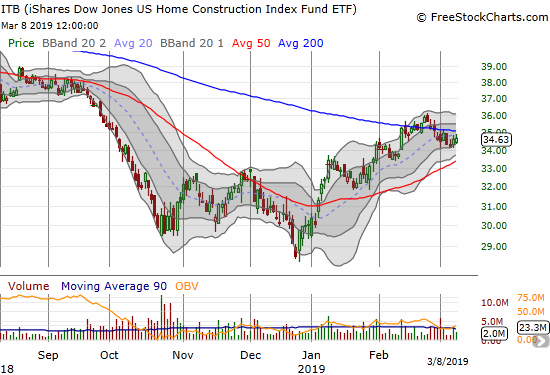
Source: FreeStockCharts.com
Not only do I have a different, albeit overlapping, list of key housing indicators, I have a difference in analysis from Marketplace when it comes to the relationship between U.S. recessions and housing starts. Marketplace made the following strong assertion (emphasis mine): “…housing starts are seen as an important measure of consumer demand and construction employment. Large declines have preceded every recession since 1960.” This claim particularly stood out because it was the only observational claim Marketplace made of its key indicators of the housing market. While this claim does not require a predictive relationship, the claim is of little use otherwise. Regardless, I suspected that this claim was too strong, so I took a look at the data.
Sure enough, there is one of seven recessions that failed to follow a large decline in housing starts. Moreover, some recessions followed multiple large declines or extended declines, suggesting more factors were required to make a definitive interpretation of the declines.
Since Marketplace did specify total, 1-unit, or 5-unit housing starts, I started with total; most media outlets do not bother making distinctions unless one of the components of housing starts very distinctly drives the total. The St. Louis Federal Reserve includes start data back to 1959, so I suspect that was the limiting factor to Marketplace’s assertion.
The chart below shows the duration of recessions in the vertical shaded areas. Since 1960, the U.S. has suffered through seven recessions. Here are the approximate relationships between housing starts and each recession since 1960:
- 1970 false positive AND true positive: Housing starts sharply declined from 1965 to 1966 and rebounded without a subsequent recession. Starts declined again from 1969 to 1970 going into the recession. Starts rebounded sharply throughout the recession.
- 1974-1975 true positive: starts sharply declined from 1972 through the end of the recession.
- 1980 false positive AND true positive: a steep two month plunge occurred in early 1979 while a sharp rebound brought stabilized starts until September, 1979. After that, starts declined sharply before bottoming halfway through the recession.
- 1981-1982 true positive: starts sharply declined from late 1980 through most of 1981.
- 1990-1991 false positive: starts declined consistently from 1986 to the end of the recession. So while technically starts did sharply decline ahead of the recession, the duration of the decline means it cannot serve as a good leading indicator.
- 2001 false negative: housing starts NEVER sharply declined in the years ahead of the 2001 recession. In fact, starts were mostly rising or stable in this period. Starts even rose going into the recession and for the first few months of the recession.
- 2009 true positive…barely: housing starts plunged for two years before the recession officially began and continued to decline throughout the recession. If the decline had lasted another 6-12 months ahead of the recession, I would have classified this as a false positive just like the 1990-1991 recession. With the hindsight of knowing the depths of the 2009 recession, I am inclined to classify the relationship with declining housing starts as a true positive.
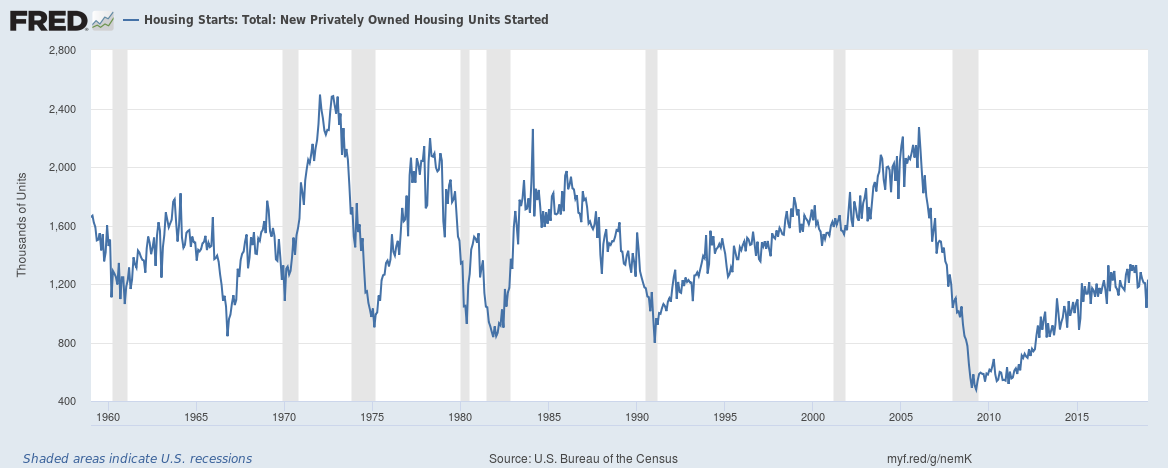
Source: U.S. Bureau of the Census and U.S. Department of Housing and Urban Development, Housing Starts: Total: New Privately Owned Housing Units Started [HOUST], retrieved from FRED, Federal Reserve Bank of St. Louis, March 10, 2019.
So the data do not support the strong claim that housing starts have suffered large declines ahead of every recession since 1960. If you read this claim as predictive, you would have struggled to make good timing calls. You would have completely missed the 2001 recession. You would have generated a lot of skepticism calling for a recession month after month for years ahead of the 1990 recession. The 2009 recession would have occurred “just in time” to vindicate your calls for a recession month after month. People would have stopped listening to as you called for a recession while housing starts sharply increased for over two years from a trough in 1966.
In other words, housing starts can provide a starting point to discuss the potential for a recession, but it is far from sufficient for that discussion.
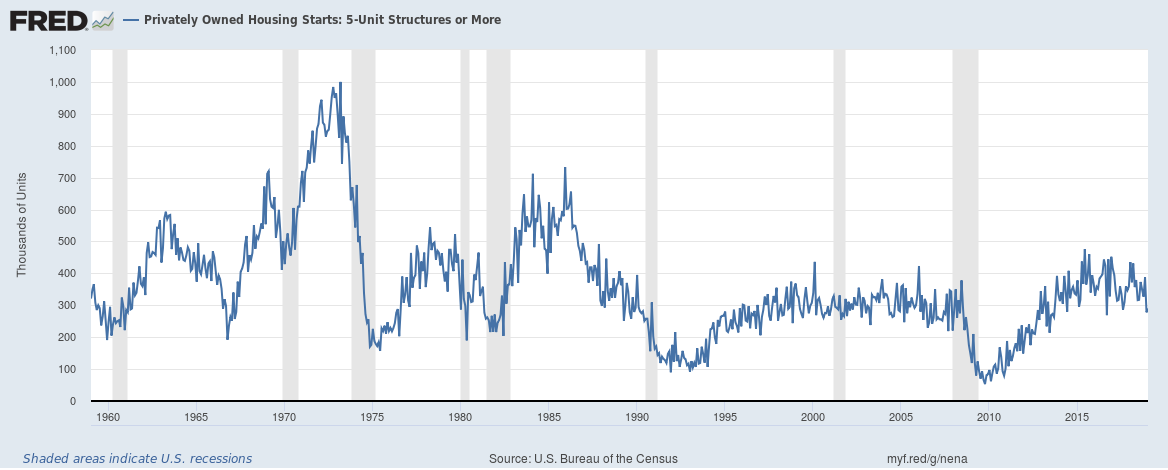
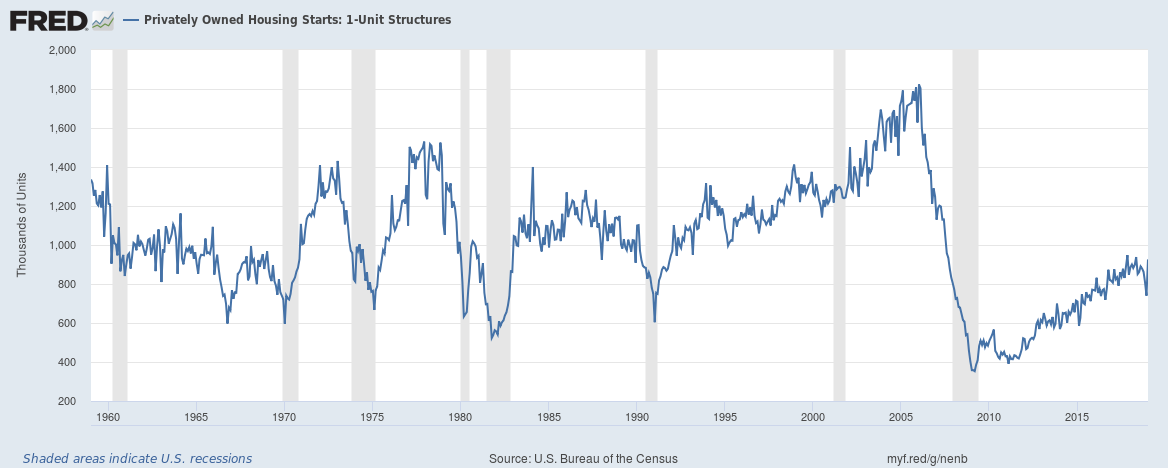
I present the charts for 1 and 5-unit housing starts for completeness. Each one similarly refutes the claim from Markeplace. In fact, I can imagine in real-time, one or the other would be used by economists to allay fears of a recession suggested by the total starts number.
Source:
U.S. Bureau of the Census and U.S. Department of Housing and Urban Development, Privately Owned Housing Starts: 1-Unit Structures [HOUST1F], retrieved from FRED, Federal Reserve Bank of St. Louis, March 10, 2019.
Source:
U.S. Bureau of the Census and U.S. Department of Housing and Urban Development, Privately Owned Housing Starts: 5-Unit Structures or More [HOUST5F], retrieved from FRED, Federal Reserve Bank of St. Louis, March 10, 2019.
Be careful out there!
Full disclosure: long ITB call options