
AT40 = 44.5% of stocks are trading above their respective 40-day moving averages (DMAs)
AT200 = 30.3% of stocks are trading above their respective 200DMAs (just above a 32-month low)
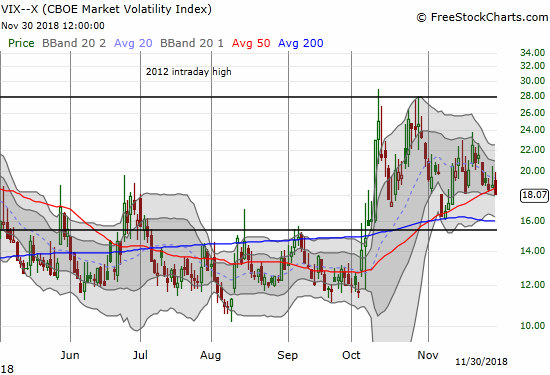
VIX = 18.1
Short-term Trading Call: neutral
Commentary
Last week was a week where the stock market seemed to force its way into the endzone by any means necessary. Just like Cleveland Browns tight end David Njoku last Sunday, the market body surfed its way higher along with helpful headlines.
David Njoku scores the TD with a little help from his friends 🤗 pic.twitter.com/AahkQyqZcZ
— FanDuel (@FanDuel) November 25, 2018
The most helpful headline was the supposed change of heart by Federal Reserve Chair Jerome Powell. In a speech on November 28th, Powell turned more dovish by simply saying: “Interest rates are still low by historical standards, and they remain just below the broad range of estimates of the level that would be neutral for the economy‑‑that is, neither speeding up nor slowing down growth.” Hope now springs eternal that the Fed is once again the market’s friend and is close to ending its campaign of rate hikes. Interestingly, at the time of writing, the odds for a rate hike in December are much higher (83% vs 65%) than they were two weeks ago. The odds for the next rate hike after December still favor a June rate hike. In other words, nothing much has changed in market expectations for the rate hike horizon; only the interpretations have changed. Rate expectations beyond June are of little relevance because too much can change along the way. Even June is a stretch for hanging hats.
The market may have already been moving toward more optimism over the outcome of this weekend’s G20 meeting. President Trump and China’s President Xi Jinping agreed to a 90-day truce in the trade war. As of the time of writing, the best evidence of a positive reaction to this announcement is in the surge in the Australian dollar (FXA). AUD/JPY gapped up well above its upper Bollinger Band (BB). This move looks like a setup for a fade given this truce promises to deliver more hand-wringing headlines of trade conflict. But I will wait to see what happens during Monday’s trade.
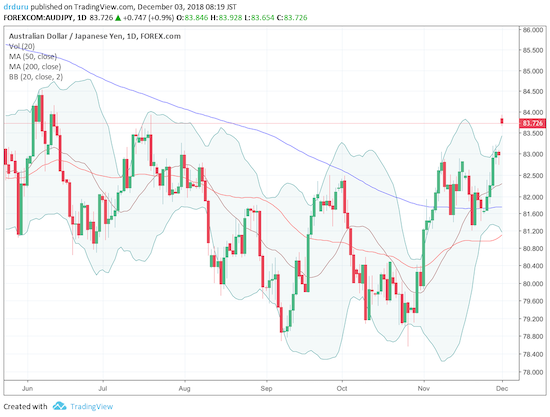
Source: TradingView
S&P 500 futures are also up about 2% at the time of writing. I put a lot less significance in the futures because the market seems highly manipulated, especially over the weekend. A lot can still change between now and the open of U.S. trading to cool the trigger fingers. Again, we’ll see.
Even with these headlines, AT40 (T2108), the percentage of stocks trading above their respective 40-day moving averages (DMAs), sticks out to me as the most important indicator. Last week on November 20th, AT40 dropped close to oversold conditions. At the same time, AT200 (T2107), the percentage of stocks trading above their respective 200DMAs, dropped to a new 32-month low. With a whole host of poor reactions to company earnings reports, the stock market looked like it was barely holding on. The conditions were so bad that even CNBC’s Jim Cramer capitulated on the market. On Monday, November 26th, he even called the rally last week a bear market rally.
Talk about classic bear market behavior. We crater all week and then we open up huge on nothing, but because we are so oversold it is hard to let things go…
— Jim Cramer (@jimcramer) November 26, 2018
On air on CNBC, Cramer exclaimed (emphasis mine):
“I’ve been bearish ever since October 3rd or 4th…It’s very hard to be very positive about this market unless you’re an idiot. Let it go up for 3 or 4 days and then sell some. But honestly. What do we want?”
I am calling this moment the Cramer bottom. It looked like a classic rock bottom in sentiment.
To wit, the “idiots” never looked back. The S&P 500 gained 2.3% in the wake of the Fed on Wednesday and AT40 surged to 43.0% and a 2-month high. Normally, that kind of surge would have at least flipped me cautiously bullish, but the S&P 500 still had to contend with 200DMA resistance. Fast-forward to post-G20, and Cramer now thinks the market is good for at least another 5%. Conditions change, opinions change.
We should be up 5% on this news….I just don't like us being up huge because there was so much buying Friday.. But we were oversold… https://t.co/6tpMU7ZVuW
— Jim Cramer (@jimcramer) December 2, 2018
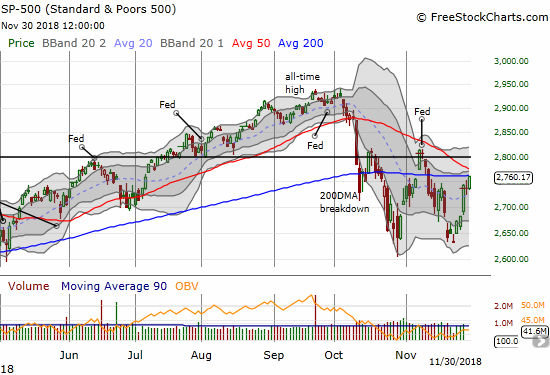
My short-term trading call remains at neutral. I am content to wait out the trading action on Monday to determine my next trading call. With a double peak around 2805 awaiting the S&P 500 after a 200DMA breakout, I am inclined to think a large gap up on Monday should be faded. I will certainly be unloading a bunch of long positions into the rally, and I will certainly (re)fade Caterpillar (CAT) as a hedge on remaining short-term positions (see chart reviews below).
These charts look like blasts from the past given the likely gap up on Monday, but they still deserve a review as a baseline for interpreting the coming action.
The S&P 500 slammed into 200DMA resistance on the heels of a 0.8% gain. The declining 50DMA looks menacing without knowing how Monday actually opens.
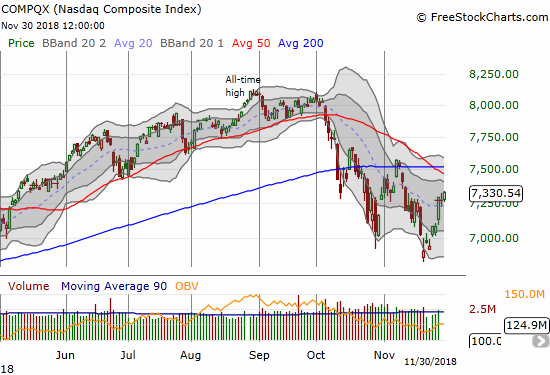
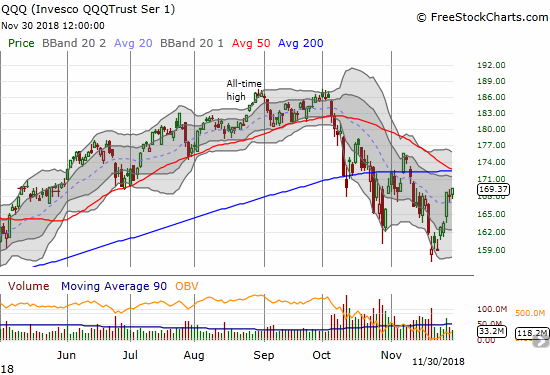
The NASDAQ and the Invesco QQQ Trust (QQQ) both ended the week well below 50 and 200DMA resistance levels. They look all clear to put those resistance levels into play. In fact, they may be better fades than the S&P 500 on a monster Monday rally.
The volatility index, the VIX, ended the week avoiding a close above the 20 level. Assuming the VIX plunges below 16 and heads for the 15.35 pivot, the fear gauge will suddenly have the look of a topping pattern with lower highs and lower lows.
This latest cycle has been a fascinating one. The mild bullish divergence that I essentially dismissed before last week’s rally turned out to be meaningful. I have duly noted this latest lesson!
CHART REVIEWS
With the market up for a monster rally on Monday, my chart reads will be colored by expectations of a higher open.
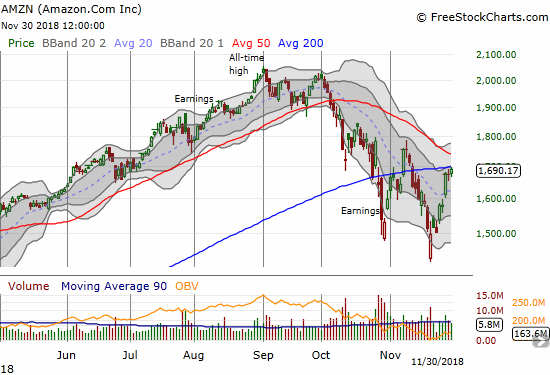
Amazon.com (AMZN)
Like the tech-laden indices, AMZN soared last week right into 200DMA resistance. I think a 50DMA breakout would firmly return AMZN into bullish territory. I REALLY wish I had a fresh long position right now!
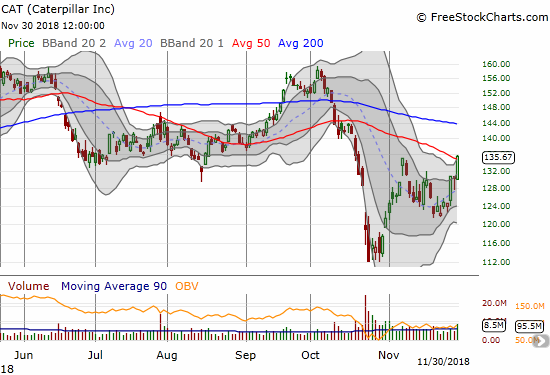
Caterpillar (CAT)
CAT gained 10.9% for the week. It even closed above 50DMA resistance and above its upper Bollinger Band. A gap higher toward or even past 200DMA resistance is a move I want to fade because the stock would be so over-extended at that point.
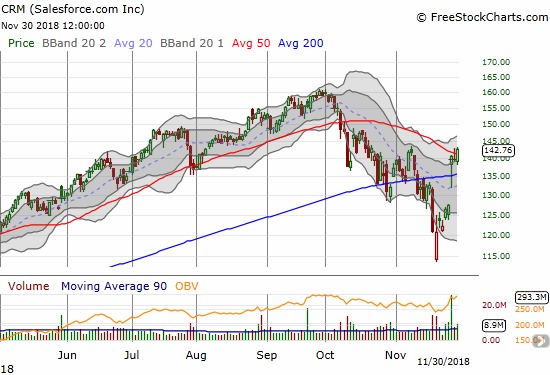
Salesforce.com (CRM)
CRM officially made it safe to love cloud stocks again. Post-earnings, sellers tried to take the stock back down below its 200DMA but failed. CRM ended the week with a close above 50DMA resistance. The all-time high at $160 is in play.
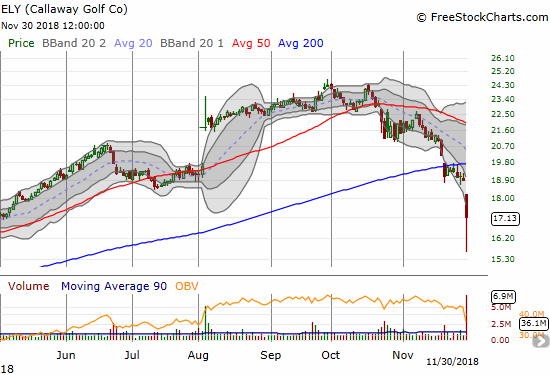
Callaway Golf Company (ELY)
ELY announced the acquisition of a sports apparel company and was promptly punished. Not even reassuring earnings guidance stemmed the tide. With the stock down 17% and well below its lower BB, I took the plunge and bought stock. My upside target is the lower BB, but I suspect the stock could continue climbing from there with the stock market in a better mood. ELY closed with a 9.4% loss on the day.
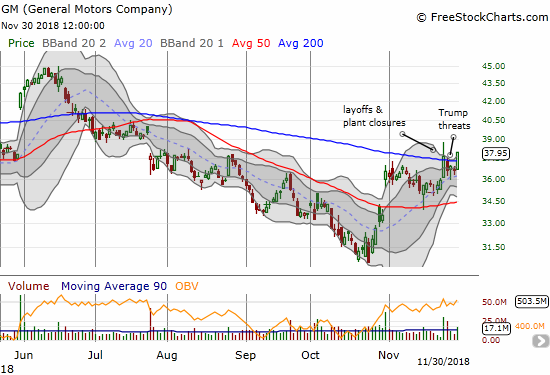
General Motors (GM)
In the early months of President Trump’s term, the “Trump Trade” was popular. One version was to buy a stock if it sold off after a Trump threat. I have not seen such trades in a long time. GM finally brought that trade back in style. Trump’s threat to deprive GM of government subsidies seemed to ruin a bullish 200DMA breakout after the company announced layoffs and plant closures. I loaded up on call options to give the Trump Trade a try. Friday delivered the big payoff with a fresh 200DMA breakout. Not wanting to risk the profits to the outcome of the G20 talks, I sold the call options. GM remains on my radar as a buy on the dips.
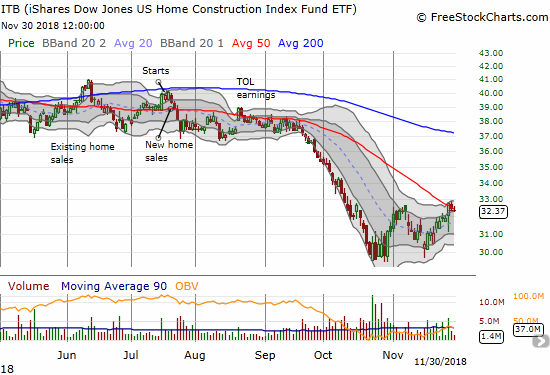
iShares US Home Construction ETF (ITB)
ITB benefited from the dovish interpretation of Powell’s speech on Wednesday. The November report on new home sales initially took ITB down for a notable loss. ITB rebounded sharply post-Powell. ITB has stalled since then at downtrending 50DMA resistance.
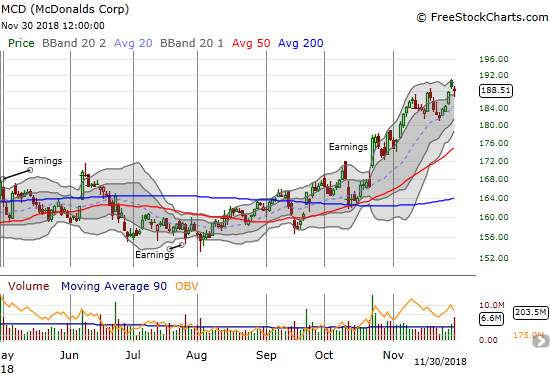
McDonalds (MCD)
MCD is on an incredible run. I never should have sold it! The stock broke out to a new all-time high on November 5th and has remained strong since then.
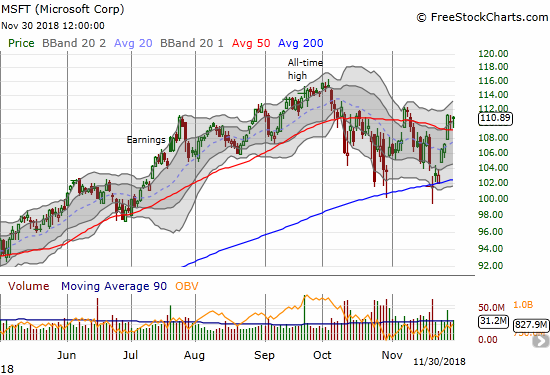
Microsoft (MSFT)
I singled out MSFT as a stock to play in case the market showed signs of life. I loaded up on MSFT call options as soon as I could on Monday. I took profits on the 50DMA breakout.
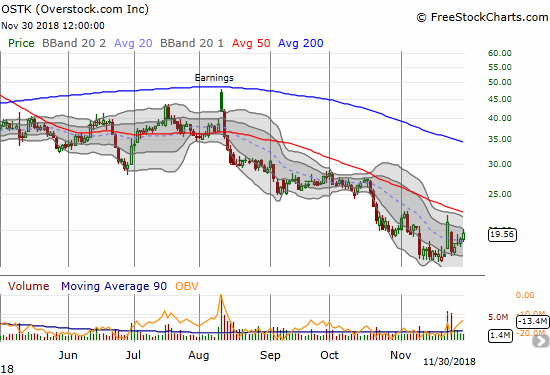
Overstock.com (OSTK)
OSTK has swung wildly on stock-specific news. OSTK gapped and crapped post-earnings in August. The selling barely took a pause until it launched higher 23.3% on the heels of news that OSTK would sell its retail unit to focus on blockchain technologies. The response looked extreme, so I did not hesitate to load up on put options. As a hedge I bought some shares. True to form, OSTK plunged the very next day. I took profits on the puts and kept the shares. I bought back a single put to now hedge the shares as I watch OSTK slowly crawl upward for a (re)recovery.
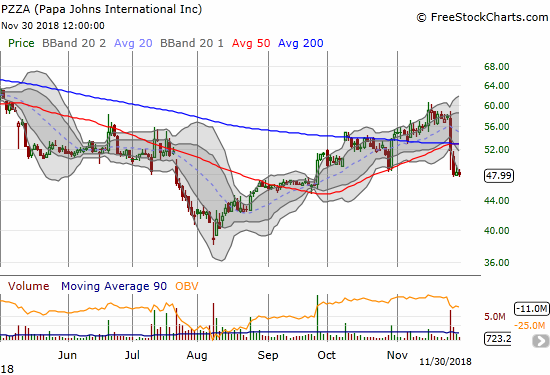
Papa Johns International (PZZA)
No deal? PZZA sold off last week on news that Train Fund Management is actually not interested in buying the company. I always look at such episodes with a small amount of suspicion. Whether or not this deal was ever genuine, PZZA is now right back in bearish territory. However, I have to believe it is still a target for some “value” buyer. PZZA also sports a heavy short interest with 25.2% of its float sold short. The stock should thus be subject to a lot more big moves in the near future.
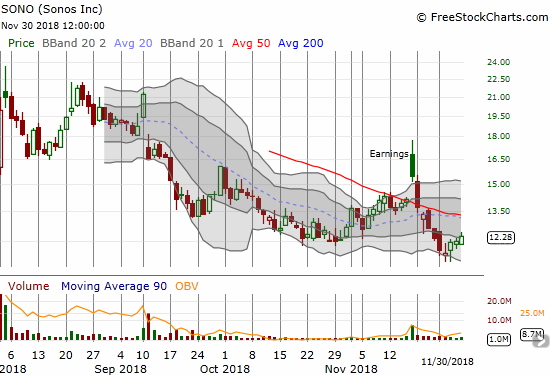
Sonos (SONO)
On November 28th, Swingtradebot flagged SONO with a “stochastic buy signal.” That was all I needed to see to load up on more shares.
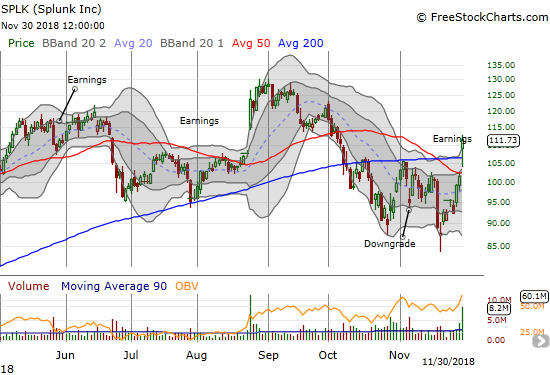
Splunk (SPLK)
SPLK made a bullish post-earnings 200DMA breakout. Sellers tried to ruin the setup but failed. SPLK is a buy with a stop below Friday’s intraday low.
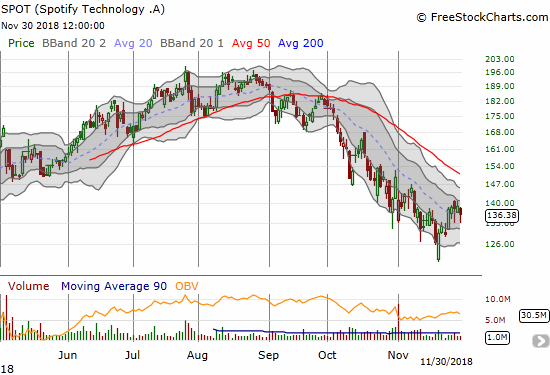
Spotify Technology (SPOT)
I am highly skeptical of the long-term viability of the business model for a stand-alone streaming music service (similar to my critique of Pandora), but that opinion does not prevent me from making a short-term play. SPOT got attractive to me because it returned to where it traded shortly after the stock rolled out to the public markets. The stop is below the intraday low that marks so many tech and speculative stocks well below the lower Bollinger Band.
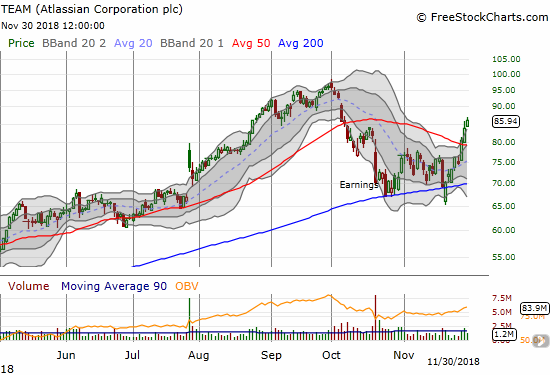
Atlassian Corporation (TEAM)
TEAM is yet one more cloud stock which is trading with renewed vigor. The 50DMA breakout last week was bullish and makes the stock a buy on the dips.
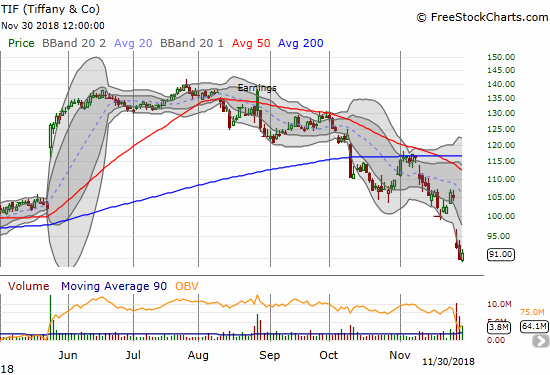
Tiffany (TIF)
It only took 6 months for TIF to go from darling to disaster. The stock now trades right back to where it churned for months during much of 2017.
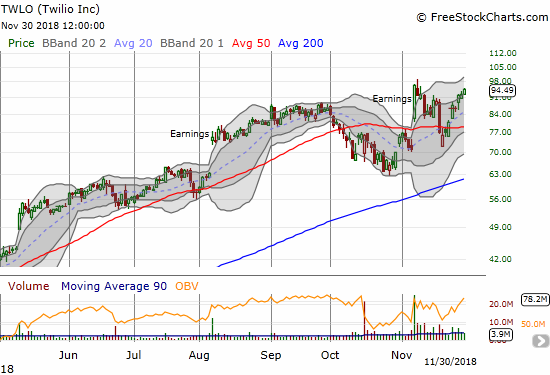
Twilio (TWLO)
TWLO is another stock I singled out as a play for a stronger market. Unlike with MSFT, I did not take an all-out bullish position. I bought a calendar call spread assuming it would take a while for TWLO to get as high as $88 and beyond. I left a LOT of money on the table. With TWLO surging above $94 to end the week, I could not profit from the nice move. I am holding onto a hedge position from being assigned the short side of the trade; I want to see whether a profitable scenario can still develop this week.
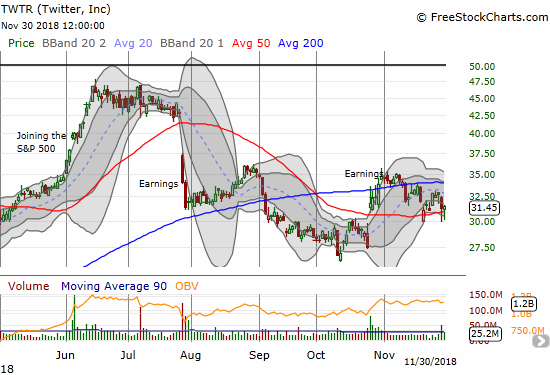
Twitter (TWTR)
TWTR is still surviving through the onslaught descending upon social media. I am still holding my position and remain bullish.
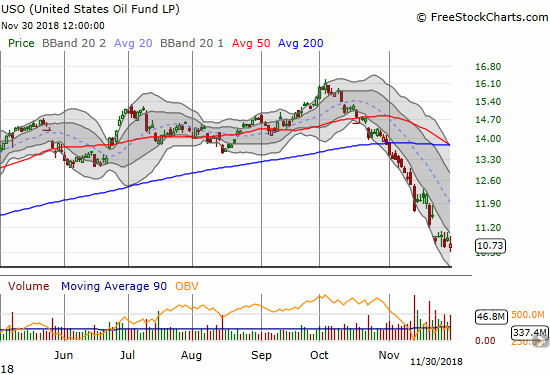
United States Oil (USO)
Is the sell-off in oil finally ending? Last week, USO finally stopped going straight down and somewhat held its ground. A break below this attempted consolidation should lead to a fresh wave of sharp selling. I will assume a push above $11.20 will confirm a bottom.
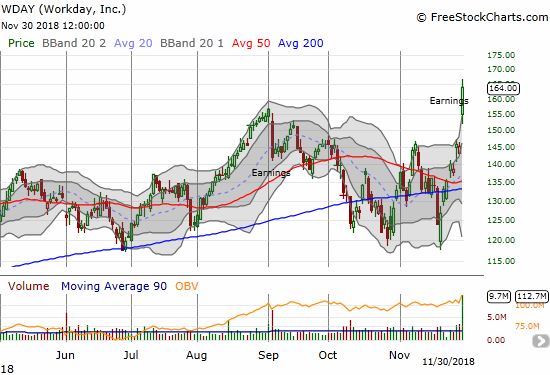
Workday (WDAY)
You got it – another cloud stock. WDAY is now a champ with a 12.9% post-earnings gap up that produced a new all-time high.
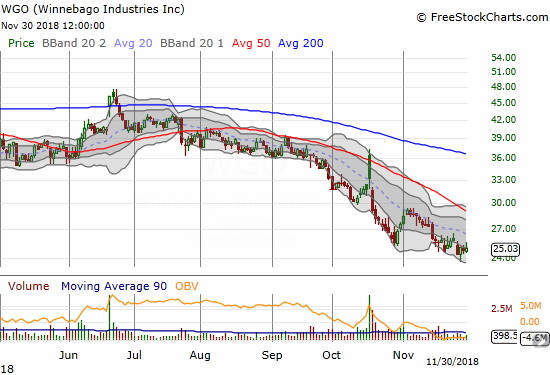
Winnebago Industries (WGO)
I keep watching the RV space for an entry point, but it continues to disappoint. WGO had a nasty gap and crap post-earnings response in October. The sellers retained control from there. Last week’s market rally did not stir buying interest. The stock now trades at an 18-month low.
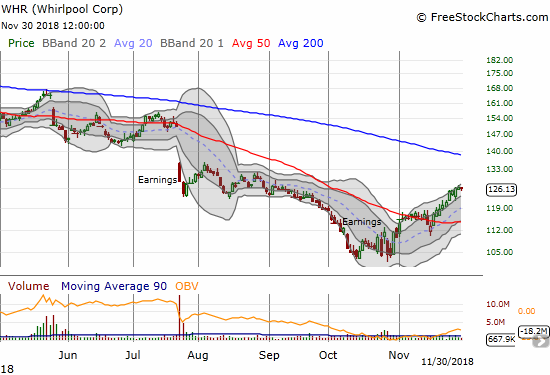
Whirlpool (WHR)
The buying in WHR continues apace. The 50DMA breakout was confirmed a while back. I am assuming a test of 200DMa resistance is in play.
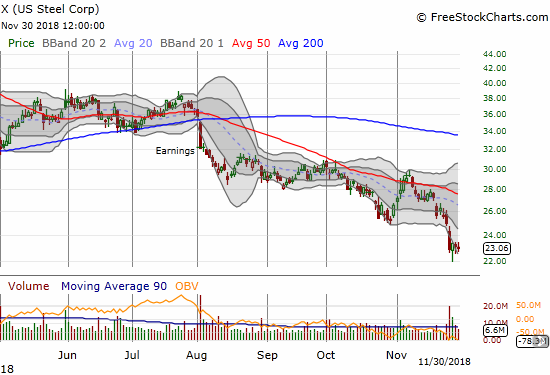
U.S. Steel (X)
U.S. Steel did not benefit from last week’s optimism. It closed the week at a 16-month low and looks as bearish as ever.
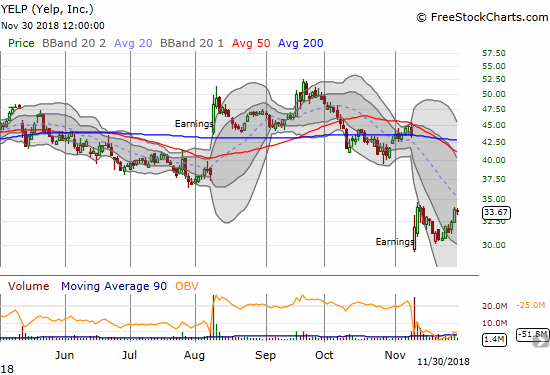
Yelp (YELP)
YELP announced a stock buyback program last week that no doubt enabled it to take advantage of last week’s rally. The stock stopped cold at its post-earnings high. I am holding a position I grabbed after the market delivered the post-earnings dip I was looking for. The stock is now well set up to get as far as a complete reversal of its post-earnings loss.
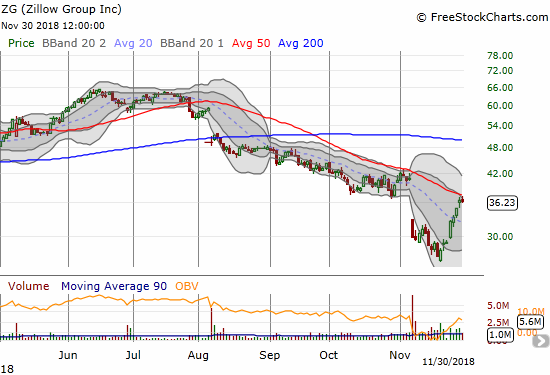
Zillow Group (ZG)
I am still looking for a dip in Zillow (Z) for a buy. The momentum continued after the news of massive insider buying. The stock closed right at downtrending 50DMA resistance. I am now eyeing related Redfin (RDFN) for a buy. That stock broke through 50DMA resistance last week.
— – —
FOLLOW Dr. Duru’s commentary on financial markets via email, StockTwits, Twitter, and even Instagram!
“Above the 40” uses the percentage of stocks trading above their respective 40-day moving averages (DMAs) to assess the technical health of the stock market and to identify extremes in market sentiment that are likely to reverse. Abbreviated as AT40, Above the 40 is an alternative label for “T2108” which was created by Worden. Learn more about T2108 on my T2108 Resource Page. AT200, or T2107, measures the percentage of stocks trading above their respective 200DMAs.
Active AT40 (T2108) periods: Day #21 over 20%, Day #5 over 30%, Day #3 over 40% (overperiod), Day #49 under 50% (underperiod), Day #65 under 60%, Day #118 under 70%
Daily AT40 (T2108)
")
Black line: AT40 (T2108) (% measured on the right)
Red line: Overbought threshold (70%); Blue line: Oversold threshold (20%)
Weekly AT40 (T2108)

*All charts created using freestockcharts.com unless otherwise stated
The charts above are my LATEST updates independent of the date of this given AT40 post. For my latest AT40 post click here.
Related links:
The AT40 (T2108) Resource Page
You can follow real-time T2108 commentary on twitter using the #T2108 or #AT40 hashtags. T2108-related trades and other trades are occasionally posted on twitter using the #120trade hashtag.
Be careful out there!
Full disclosure: long SSO, long QQQ calls, long ELY, short TWLO and long calls, long SPOT, long TWTR, long YELP calls, long SONO, long OSTK and puts, long CAT puts
*Charting notes: FreeStockCharts.com stock prices are not adjusted for dividends. TradingView.com charts for currencies use Tokyo time as the start of the forex trading day. FreeStockCharts.com currency charts are based on Eastern U.S. time to define the trading day.