
AT40 = 51.6% of stocks are trading above their respective 40-day moving averages (DMAs)
AT200 = 55.3% of stocks are trading above their respective 200DMAs
VIX = 13.2
Short-term Trading Call: neutral
Commentary
The indicators barely changed from the last Above the 40 post, but the technical winds are likely changing yet again.
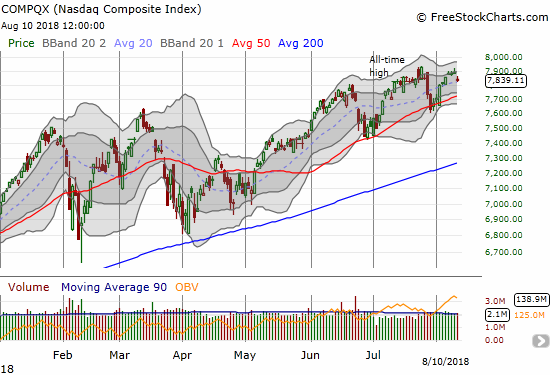
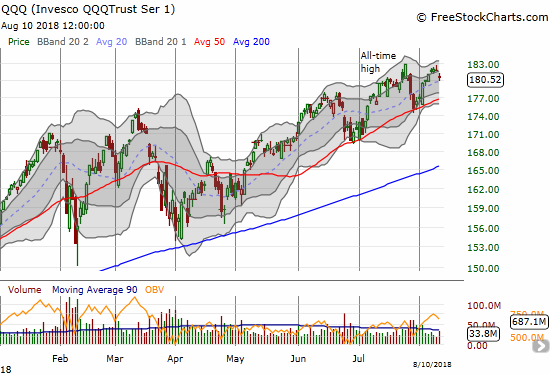
A little over a week ago, Apple’s (AAPL) trillion dollar tailwind was willing the stock market higher. Since then, AAPL has gone exactly nowhere. AT40 (2108), the percentage of stocks trading above their respective 40-day moving averages (DMAs), has lost one percentage point. Like AAPL, AT200 (T2107), the percentage of stocks trading above their respective 200DMAs, has gone exactly nowhere. The NASDAQ and the Invesco QQQ Trust (QQQ) are up marginally (about half a percent). The volatility index, the VIX, is the only one of my major indicators and indices with a notable change since the last post: the VIX is up a point or 8.2% since then.
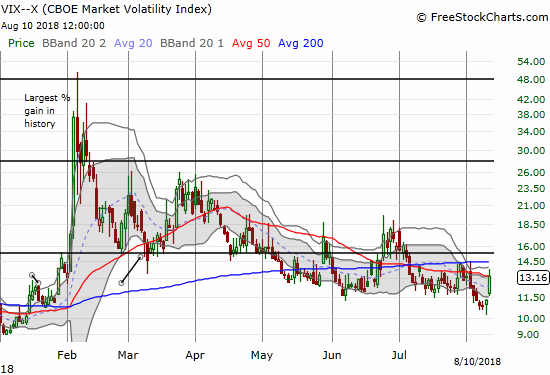
As planned, I held a fist full of call options in ProShares Ultra VIX Short-Term Futures (UVXY) ready. I also took profits quickly given how regularly VIX faders succeed in pushing down these pops. I reloaded on Thursday as I conceded that the last tranche of UVXY calls would go out with a whimper. I was a bit surprised that the VIX held as well as it did even with the fade from its intraday high. As a result, I was not able to reload on UVXY call options at my preferred price point. I feel a little light on bearish bets with a single September SPY put option in place in addition to my small assortment of various shorts. Note well that the VIX jumped from extremely low levels (below 11). Those levels are typically a bullish indicator. However, in recent years the end of a period of ELV (Extremely Low Volatility) has tended to precede a large pullback (greater than 5%). The February swoon was a particularly significant example.
The heightened sense of risk came from screaming headlines about increasing tensions between the U.S. and Turkey (North Korea might soon be the last country with a deep beef with the U.S.). In a tweet, President Trump essentially bragged about taking down the Turkish lira (USD/TRY) as he threatened a doubling of aluminum and steel tariffs on the economically struggling country. The resulting volatility and plunge in value completely upset a neat strategy I had in place short USD/TRY to collect carry and short-term swings with long EUR/TRY.
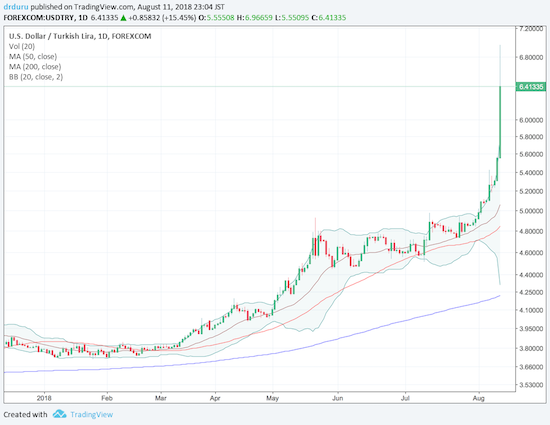
Source: TradingView.com
Ironically, I was in the short USD/TRY and long EUR/TRY trade as a partial hedge on long U.S. dollar positioning. Needless to say, I had to abandon ship. Adding to my own pain is that the dollar surged against almost all major currencies at a point where I had a minimal long position in the dollar. The euro suffered the most as fears of currency contagion cascaded from Turkey to European banks.
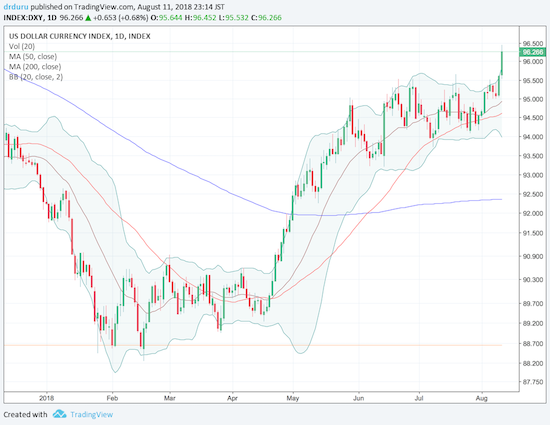
Source: TradingView.com
I am still as bullish as ever on the U.S. dollar. Yet with the index trading well above its upper-Bollinger Band (BB), I will have to exercise patience in rebuilding my next phase of dollar longs. Note well that inflation numbers (Consumer Price Index (CPI)) came in “hot” on Friday, essentially guaranteeing two more rate hikes from the Federal Reserve this year even as increasing macro-economic turmoil keeps tossing in major caveats. From the Bureau of Labor Statistics (emphasis mine):
“The all items index rose 2.9 percent for the 12 months ending July, the same increase as for the period ending June. The index for all items less food and energy rose 2.4 percent for the 12 months ending July; this was the largest 12-month increase since the period ending September 2008. The food index increased 1.4 percent over the last 12 months, and the energy index rose 12.1 percent.”
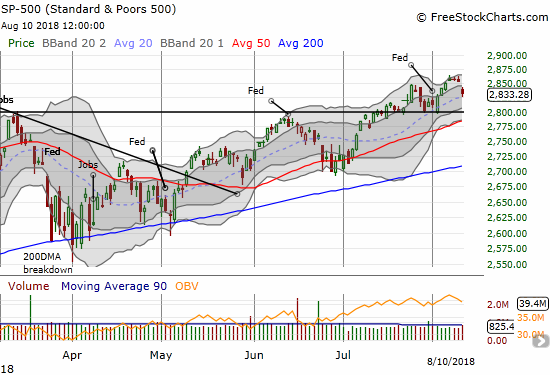
The end result on U.S. stocks was not nearly as dramatic as the headlines. The S&P 500 (SPY) and the NASDAQ lost 0.7%. QQQ lost 0.8%. More importantly, all three indices fell from a three-stall just under their respective all-time highs. This topping action flags the next change in the technical winds.
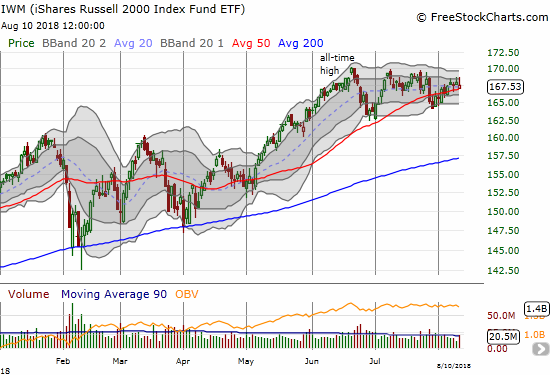
The iShares Russell 2000 ETF (IWM) is following its uptrending 50DMA, but the index of small-caps is struggling to regain the momentum that carried to a major May breakout and all-time highs.
With firm support levels below the current trading action, I am keeping the short-term trading call at neutral. As usual, I do not want to to churn my trading call without a very compelling reason. Just as with the last shallow market pullback, AT40 warned me that the previous rally had weak underpinnings. Even with the major indices closing in on all-time highs, AT40 could not even close above 56%.
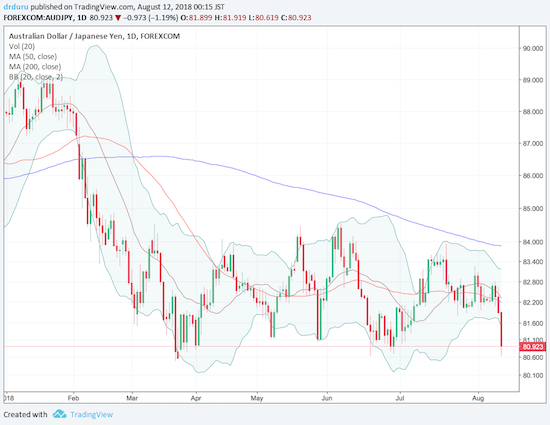
A more recent warning came from the Australian dollar (FXA) versus the Japanese yen (FXY). On Thursday, AUD/JPY faded and kept falling. This indicator of risk appetite closed the week near its low for 2018. Further selling will get me incrementally less neutral and more bearish.
Source: TradingView.com
CHART REVIEWS
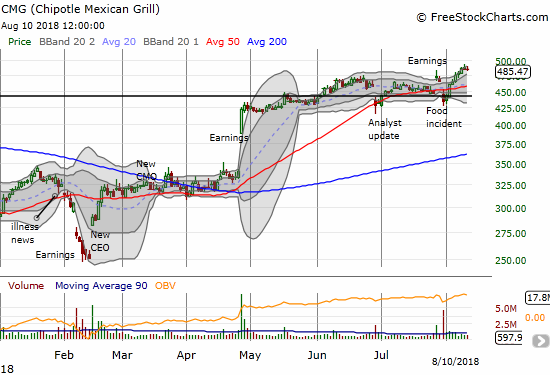
Chipotle Mexican Grill (CMG)
I guess CMG will not deliver an easy re-entry point. Much to my surprise, CMG continued to power right past its post-earnings high.
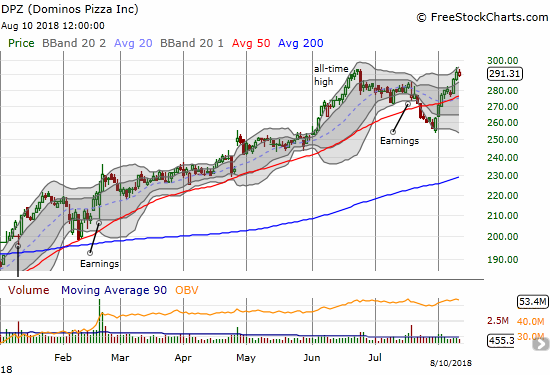
Dominos Pizza (DPZ)
Looks like I was right to be leery of DPZ’s 50DMA breakout. At one point this week, DPZ traded to an all-time high before pulling back. I still see no news to explain this fresh burst of energy. I can only assume “someone” knows “something” that the rest of us will just have to find out later.
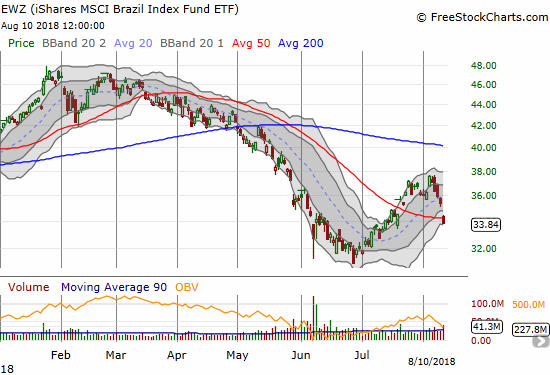
iShares MSCI Brazil Capped ETF (EWZ)
Turkey’s deepening woes infected emerging markets. EWZ pulled back sharply on Friday with a 4.4% loss that closed the ETF below its 50DMA. I earlier passed on taking a profit on my EWZ play to hold out for a 200DMA challenge. I will now wait even longer to see how things shake out.
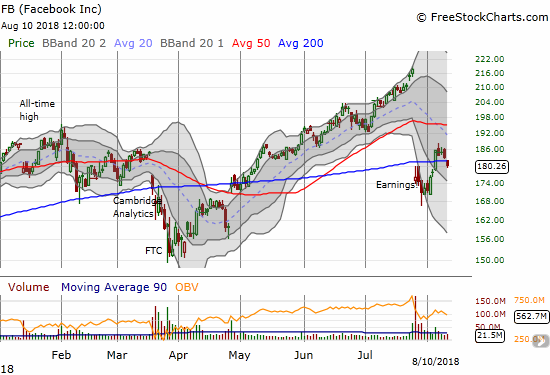
Facebook (FB)
I thought I would be writing an end to my bearish FB call in the wake of a (surprising) 200DMA breakout triggered by an analyst upgrade. Instead, Friday’s selling punched FB right back below its 200DMA. With a post-earnings relief rally apparently running out of gas, I refreshed my short position.
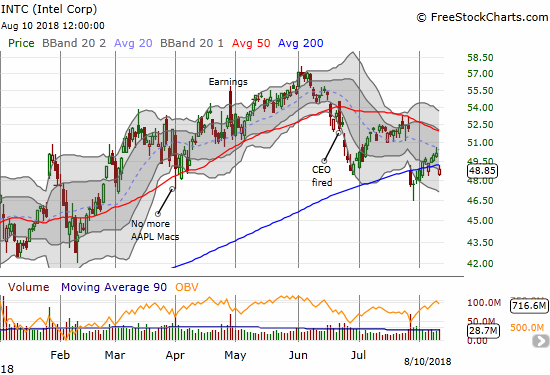
Intel (INTC)
When INTC traded above its 200DMA, I jumped on my between earnings trade on the stock. The trade looked golden until Friday’s 2.5% loss and gap down below 200DMA support. Analysts have been downgrading INTC, and a poor earnings report from Microchip (MCHP), down 10.9%, added pressure to INTC.
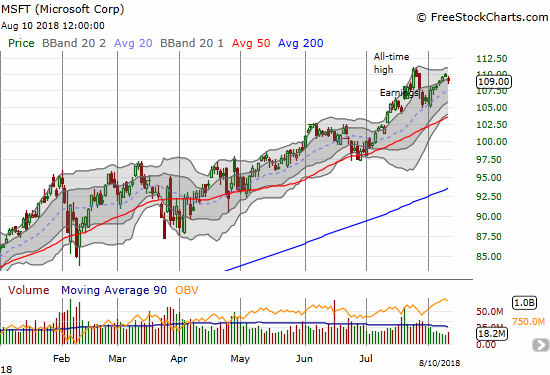
Microsoft (MSFT)
What is worse than losing money? Losing money when you are directionally correct.
MSFT was my big call options play for the week. I posted MSFT as a “safe” bet on the post-AAPL bullish momentum I wanted to ride. MSFT turned out to be “too safe” as the market spent most of the week chasing more speculative stocks. MSFT gained in inches each day of my trade until Friday’s small pullback to $109. With two tranches of $110 call options expiring Friday, I finally landed a small but decent profit on Thursday. I decided to hold out for what I thought could be a surge toward the $111 all-time high. Friday’s pullback was so complete, I was not even able to salvage value from the position.
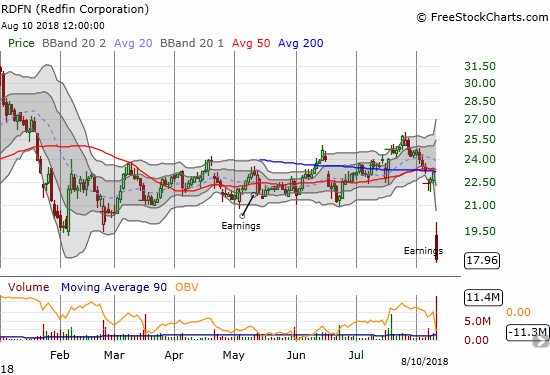
Redfin (RDFN)
Looks like I took profits in RDFN just in time. The company had some disquieting things to say about a slowing housing market. I will be covering the earnings results in another post. The conference call had a LOT of telling remarks and commentary!
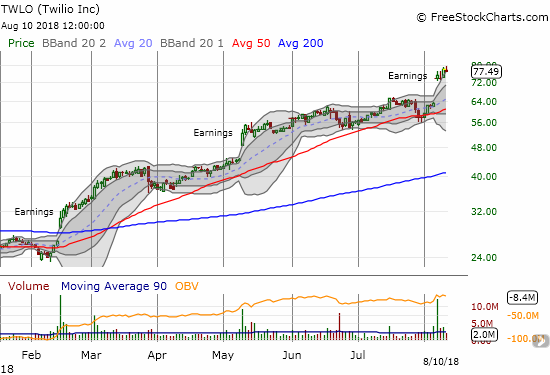
Twilio (TWLO)
I had a bullish change of heart in TWLO, but I failed to take advantage of this impressive turn in the stock. This was the kind of stock capturing the market’s attention last week. TWLO made new all-time highs on the wings of a well-received earnings report.
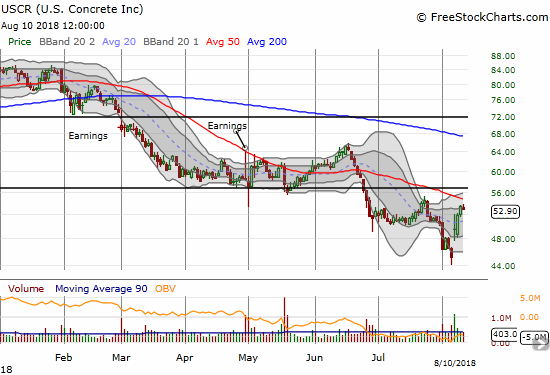
U.S. Concrete (USCR)
USCR rebounded sharply thanks to a well-received earnings report. Still, there is a LOT of damage to repair ahead. The 50DMA presents looming overhead resistance.
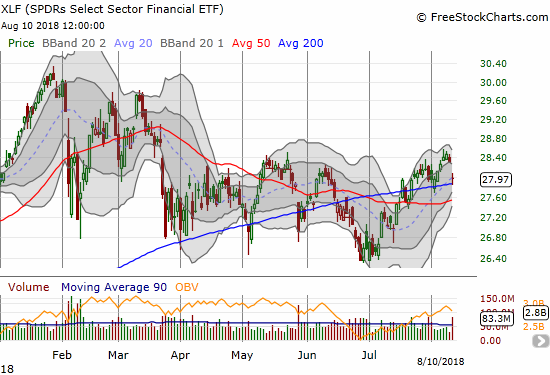
Financial Select Sector SPDR ETF (XLF)
I took profits on my XLF call options some time ago. XLF has only made grudging progress since then. Friday’s gap down and 1.2% loss presents another technical challenge at 200DMA support. I am still surprised financials are not much higher than current levels.
SPDR S&P Retail ETF (XRT)
Earnings are coming for a bunch of important retailers. XRT closed the week ahead of earnings at a marginal all-time high but only after fading off intraday highs two days in a row. I will be watching for a clean breakout of a (buyable?) breakdown back to 50DMA support.

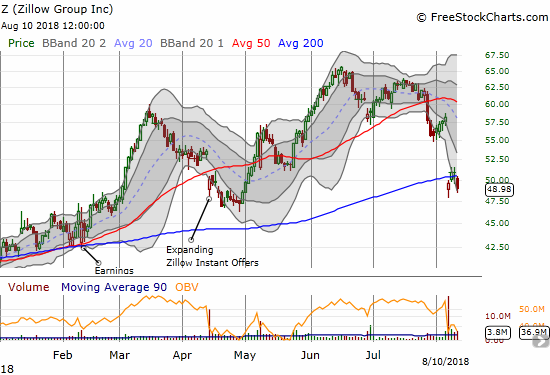
Zillow (Z)
Already under pressure, Zillow suffered from Redfin’s bad news. Z traded back under its 200DMA and closed at a fresh post-earnings low.
— – —
FOLLOW Dr. Duru’s commentary on financial markets via email, StockTwits, Twitter, and even Instagram!
“Above the 40” uses the percentage of stocks trading above their respective 40-day moving averages (DMAs) to assess the technical health of the stock market and to identify extremes in market sentiment that are likely to reverse. Abbreviated as AT40, Above the 40 is an alternative label for “T2108” which was created by Worden. Learn more about T2108 on my T2108 Resource Page. AT200, or T2107, measures the percentage of stocks trading above their respective 200DMAs.
Active AT40 (T2108) periods: Day #120 over 20%, Day #89 over 30%, Day #84 over 40%, Day #7 over 50% (overperiod), Day #23 under 60% (underperiod), Day #40 under 70%
Daily AT40 (T2108)
")
Black line: AT40 (T2108) (% measured on the right)
Red line: Overbought threshold (70%); Blue line: Oversold threshold (20%)
Weekly AT40 (T2108)

*All charts created using freestockcharts.com unless otherwise stated
The charts above are my LATEST updates independent of the date of this given AT40 post. For my latest AT40 post click here.
Related links:
The AT40 (T2108) Resource Page
You can follow real-time T2108 commentary on twitter using the #T2108 or #AT40 hashtags. T2108-related trades and other trades are occasionally posted on twitter using the #120trade hashtag.
Be careful out there!
Full disclosure: long SPY put, long AAPL calls, long DPZ put spread, long EWZ, short FB and long calls, long INTC calls, long USCR
*Charting notes: FreeStockCharts.com stock prices are not adjusted for dividends. TradingView.com charts for currencies use Tokyo time as the start of the forex trading day. FreeStockCharts.com currency charts are based on Eastern U.S. time to define the trading day.