
AT40 = 52.6% of stocks are trading above their respective 40-day moving averages (DMAs)
AT200 = 55.3% of stocks are trading above their respective 200DMAs
VIX = 12.2
Short-term Trading Call: neutral
Commentary
The technical winds may be on the upswing.
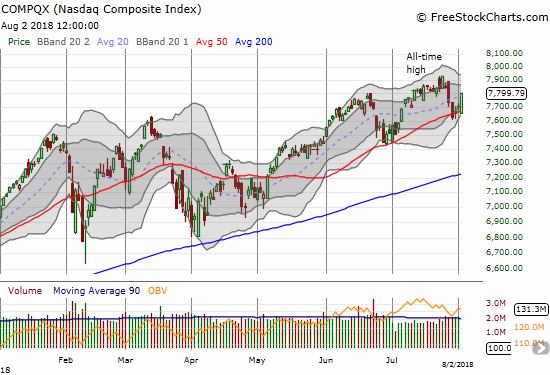
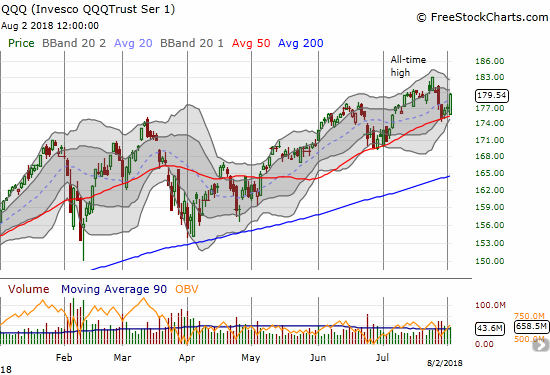
Last weekend, I pointed out how bearish divergence preceded and warned of the sell-off last Friday. Monday’s sell-off seemed to confirm a bearish swing in the technicals. In my last AT40 post, I left the short-term trading call at neutral instead of going bearish because I was wary that the 50-day moving averages (DMAs) on the NASDAQ and the Invesco QQQ Trust (QQQ) would deliver support for the indices and, by extension, the stock market. Almost like magic, those uptrending support lines held in near picture-perfect form even though it took a full four days of trading to validate a successful test.
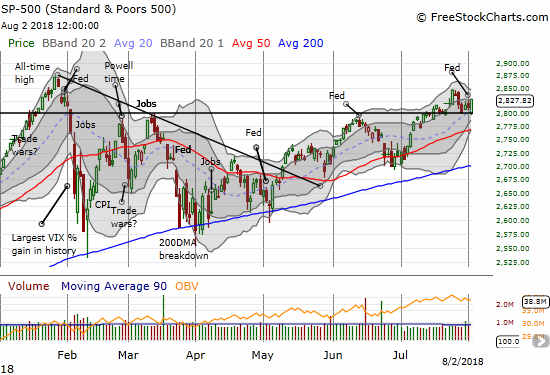
The S&P 500 (SPY) delivered its own version of technical magic by fighting through an important test of the 2800 level. In March and June, 2800 delivered a decisive cap on S&P 500 rallies. July’s breakout above 2800 was not easy but it seemed to deliver the index toward an overdue rendezvous with its all-time high. Monday’s selling took the index right back to 2800. Today, the index gapped down, dropped ever so slightly below 2800, and then launched higher to a high for the week (so far).
Combined, these successful tests of critical support set the market up for a fresh rally. While these tests are things of technical beauty, I am admittedly quite surprised by the bounces: several other conditions looked ripe to follow-through on the Friday-Monday sell-off. Even Wednesday’s post-Fed trading added to my suspicions as AT40 (T2108), the percentage of stocks trading above their respective 40DMAs, dropped at one point to a 1-month low at 46.2%. Even today, AT40 is still caught in a downtrend and only closed at 52.6%. So, I am not flipping the short-term trading call to bullish and sitting comfortably at neutral. As before, I will treat clean breaks of the current support levels as opportunities to get aggressively bearish.
The volatility index, the VIX, added to the bullish picture by plunging all the way back to 12.2. At one point today, the VIX was as high as 14.5. I added to my call options on ProShares Ultra VIX Short-Term Futures (UVXY) on Wednesday so the initial pop put me in the green. With expiration still a week away, I hesitated on the sell button. In a blink, my opportunity window closed. Ditto for my SPY puts which expire THIS Friday. The need to take quick profits on bearish positions reminds me of earlier periods of market bearishness over the past few months.
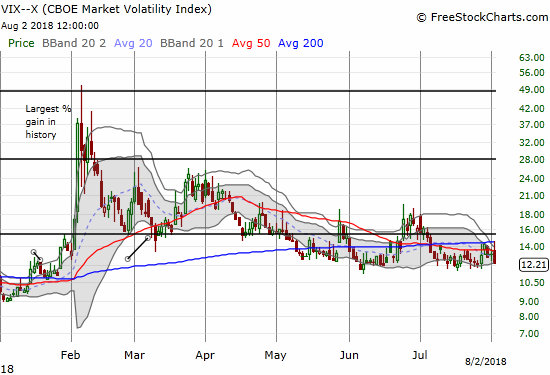
CHART REVIEWS
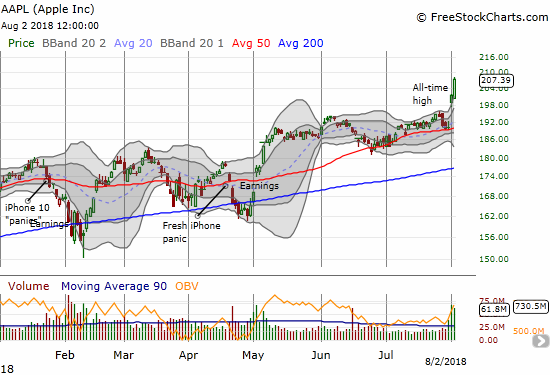
Apple (AAPL)
The trillion dollar man is here in style. AAPL closed the day with a 1.002 trillion market cap on the heels of a 2.9% surge that followed the previous day’s 5.8% post-earnings surge. I thought Wednesday’s post-earnings reaction was incredibly bullish, so I got wary about the market when I noticed the AAPL rally barely inspired the major indices, including the NASDAQ and QQQ. Today’s surge of course played catch-up big-time.
I was bathed in irony on a pre-earnings bet I made on AAPL earnings. I was mildly bullish on the prospects, but I failed to profit. I sold a put spread short but then thought I was being too directional. So, I sold short an out-of-the-money 200/195 call spread. I figured AAPL would at best gain 4% going into the CLOSE of the week. The options were priced for a 4% post-earnings pop or drop as well. I tried to salvage the trade but bailed on the adjustments after AAPL plowed through $202.50. Oh to have just been plain bullish…
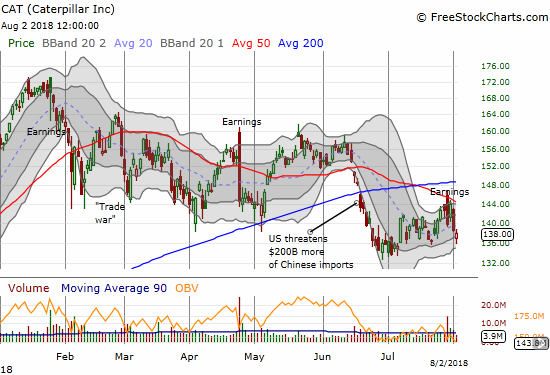
Caterpillar (CAT)
CAT is still feeling the hangover of the bearish divergence. The market initially responded favorably to its earnings with a gap up through 50DMA resistance; CAT even reported having no negative impact from US trade tensions and claimed it will be able to adjust through a combination of shifting production and hiking prices. Yet, sellers quickly stepped in and drove the stock all the way back to its 20DMA. A swift rally on Tuesday brought fresh life that was in turn squashed the last two days. Today’s bounce from the lows almost closed the gap down that so many stocks suffered to start the day. CAT is once again serving as a good hedge on bullishness.
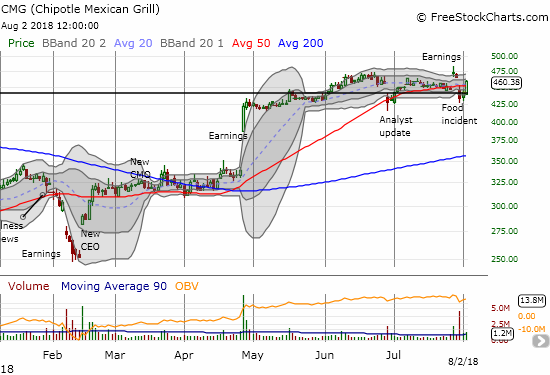
Chipotle Mexican Grill (CMG)
Today was bullish enough to help CMG close the gap down from another food poisoning incident (I do not think it is quite verified yet). Last week, I mentioned I wanted to wait for a pullback to start going long CMG again. I ignored the reason for the pullback and just plowed ahead with the strategy. Today’s 4.0% surge higher and gap fill was my reward. My limit order on my call option triggered before I could even think about being greedy and hanging on for one more day into expiration.
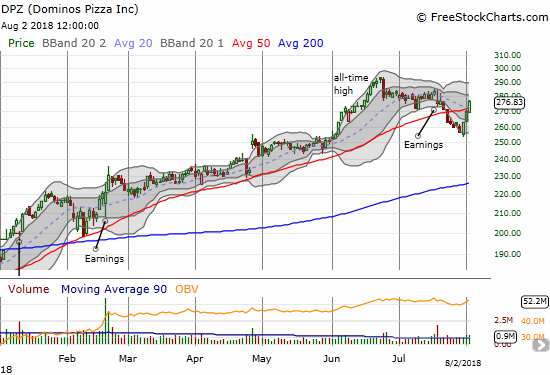
Dominos Pizza (DPZ)
What’s a trillion dollar party without pizza?
Glad I waited to fade a rally in DPZ. Out of nowhere DPZ powered from its recent low to a 3-day 7.8% gain that blew right through 50DMA resistance. Suddenly, the options are even more expensive than they were last week, so I settled for a put spread. With DPZ both above its 50DMA and closing in the middle of its initial post-earnings gap down, this trade has turned a lot more speculative than I thought it would be.
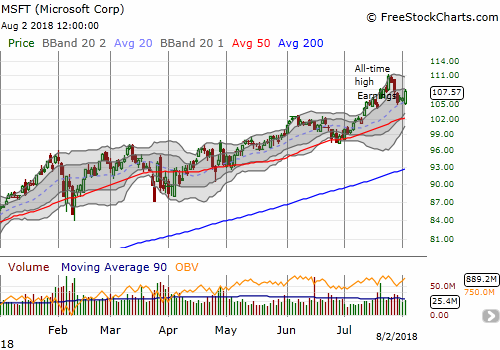
Microsoft (MSFT)
While I am not willing to flip the short-term trading call to bullish, I also do not want to miss out on a possible (AAPL-led) revival in big cap tech. My first attempt is what I consider a “safe” bet with MSFT. I loaded up on call options expiring next Friday. I will take this shift one step at a time…assuming the market allows me to do so.
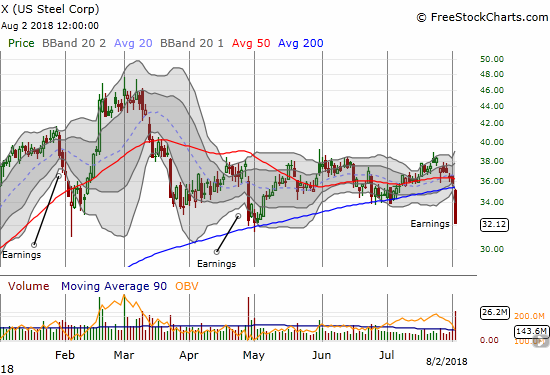
U.S. Steel (X)
For the second earnings in a row, U.S. Steel suffered a post-earning collapse. With the stock gapping below its 200DMA, closing on its lows right at the 2018 closing low, and losing 10.3% on a very strong market day, I highly suspect that X will not recover from this damage nearly as quickly as it recovered from the last post-earnings sell-off. I fully expect X to make lower lows before the next earnings cycle. So much for those steel tariffs helping this company…
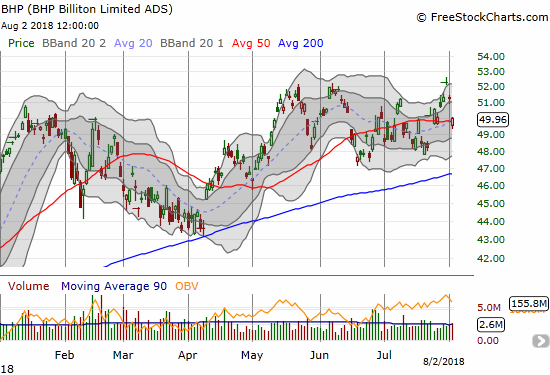
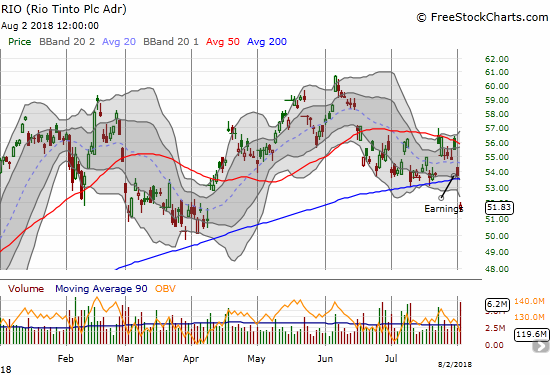
BHP Billiton (BHP) and Rio Tinto (RIO)
My favorite commodity combo did not get the memo on the market rally. BHP lost 2.5% on a gap down to 50DMA support. RIO first collapsed post-earnings back to 200DMA support and then suffered insult on top of injury to gap down well below its lower-Bollinger Band (BB). I never did double-down on my BHP puts, so I missed a major profit opportunity. Rather than take today’s profits, I decided to kick off another pairs trade with RIO call options. As before, I will be quick to sell the RIO calls into the next bounce.
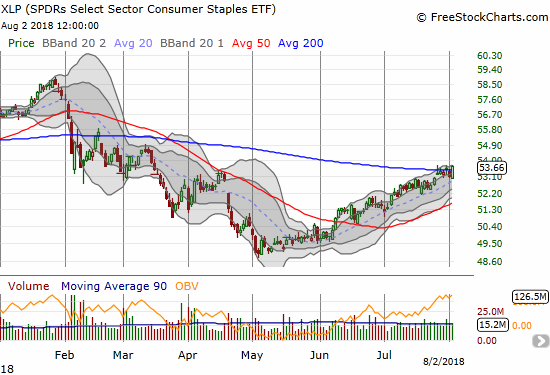
Consumer Staples Select Sector SPDR ETF (XLP)
Written-off for dead earlier this year, XLP has continued to sneak higher for three months straight. Today’s rally helped push XLP over 200DMA resistance for the first time since February. Clorox (CLX) was the big winner in the sector with today’s breakout and 6.2% post-earnings gain. I am still patiently sitting in my Campbell Soup (CPB) call spread after my hedge of puts expired with a whimper.
— – —
FOLLOW Dr. Duru’s commentary on financial markets via email, StockTwits, Twitter, and even Instagram!
“Above the 40” uses the percentage of stocks trading above their respective 40-day moving averages (DMAs) to assess the technical health of the stock market and to identify extremes in market sentiment that are likely to reverse. Abbreviated as AT40, Above the 40 is an alternative label for “T2108” which was created by Worden. Learn more about T2108 on my T2108 Resource Page. AT200, or T2107, measures the percentage of stocks trading above their respective 200DMAs.
Active AT40 (T2108) periods: Day #114 over 20%, Day #83 over 30%, Day #78 over 40%, Day #1 over 50% (overperiod ending 5 days under 50%), Day #17 under 60% (underperiod), Day #34 under 70%
Daily AT40 (T2108)
")
Black line: AT40 (T2108) (% measured on the right)
Red line: Overbought threshold (70%); Blue line: Oversold threshold (20%)
Weekly AT40 (T2108)

*All charts created using freestockcharts.com unless otherwise stated
The charts above are my LATEST updates independent of the date of this given AT40 post. For my latest AT40 post click here.
Related links:
The AT40 (T2108) Resource Page
You can follow real-time T2108 commentary on twitter using the #T2108 or #AT40 hashtags. T2108-related trades and other trades are occasionally posted on twitter using the #120trade hashtag.
Be careful out there!
Full disclosure: long SPY puts, long BHP puts, long RIO calls, long CAT calendar put spread, long UVXY puts, long DPZ put spread, long MSFT calls, short AAPL put spread (currently no value), long CPB call spread
*Charting notes: FreeStockCharts.com stock prices are not adjusted for dividends. TradingView.com charts for currencies use Tokyo time as the start of the forex trading day. FreeStockCharts.com currency charts are based on Eastern U.S. time to define the trading day.
DPZ. Set up for reversal. V bottoms without a catalyst usually represent last gasp before breakdown. Unless it makes a new high pattern forming head and shoulders top. All other QSR’s seeing weakness with rising input and labor costs.
I agree. I am just wondering whether there IS a catalyst but the rest of us just don’t know about it yet…!