
AT40 = 53.5% of stocks are trading above their respective 40-day moving averages (DMAs)
AT200 = 45.9% of stocks are trading above their respective 200DMAs
VIX = 14.8
Short-term Trading Call: cautiously bearish
Commentary
I was right to be bearish last week…until the very last day when all at once the market reversed almost all its accumulated worries.
As usual, there are a host of catalysts to cherry pick to explain what happened: a) a benign jobs report showing strong growth but wage growth “weaker than expected,” b) China approved a joint-venture between Qualcomm (QCOM) and China’s state-owned Datang Telecom Technology Co. in a hopeful sign of thawing trade tensions between the U.S. and China, and/or c) news that Warren Buffett added another 75 millions shares to his investment in Apple (AAPL) bringing his share of Apple’s stocks to a notable 5%. I could be missing some catalysts (and conveniently ignoring something the market also ignored on the day), but I will focus in on AAPL since in my last Above the 40 post earlier post I noted how AAPL’s repeated pre-earnings failure to break through 200DMA resistance was a sentiment killer. I even, =gasp=, flipped puts several times and used this behavior as part of my argument to remain cautiously bearish on the market.
The story with AAPL is simple now. The stock made a new all-time high. It completely reversed the last iPhone panic. It is one of the few big cap tech stocks which sustained a positive post-earnings response. It has major backing from a major investor of influence. The company is pumping a literal tidal wave of cash into the hands of shareholders through another $100B in its buyback and another dividend hike. These are not the tailwinds to fight! They are the tailwinds to ride.
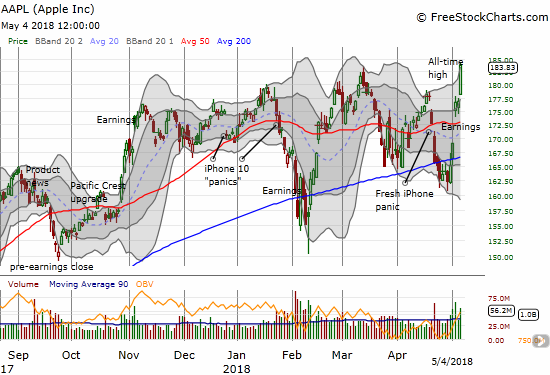
At this point, pretty much only fresh news of China vs. U.S. trade tensions could stand in AAPL’s way in the coming weeks and months. Yet, while AAPL’s stellar performance tempts me, I am not yet ready to declare the all-clear for the stock market.
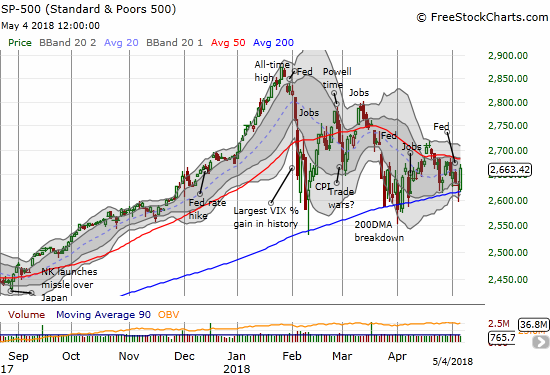
I have a few stubborn reasons left for staying cautiously bearish the market in general. The S&P 500 remains firmly stuck in a triangle pattern. I need to see the index close above the peak from the last 50DMA breakout AND show follow through buying. My favorite technical indicator, AT40 (T2108), the percentage of stocks trading above their respective 40DMAs, was very weak until Friday. Even with the S&P 500 making another amazing 200DMA comeback on Thursday, AT40 closed at a 3 week low. At 53.5%, AT40 has more upside, but it is still in “show me” mode after a bearish rejection from the 70% overbought threshold on April 19th. Finally, the S&P 500 has now responded poorly to the last three meetings from the Federal Reserve. In other words, I think it is very possible AAPL powers higher without dragging much of the general market with it as investors and traders seeking “safety” in equities bias their money toward AAPL and away from a lot of other options.
The volatility index, the VIX, is at a critical juncture. It jumped around the 15.35 pivot all week only to close at 14.8. If downward momentum continues, I will have to assume bullish sentiment is similarly growing. I was fortunate during the week to sell my last tranche of call options in ProShares Ultra VIX Short-Term Futures (UVXY) for a small profit and then quickly flip through a short position in iPath S&P 500 VIX ST Futures ETN (VXX). I bought a new tranche of UVXY calls near Friday’s close.
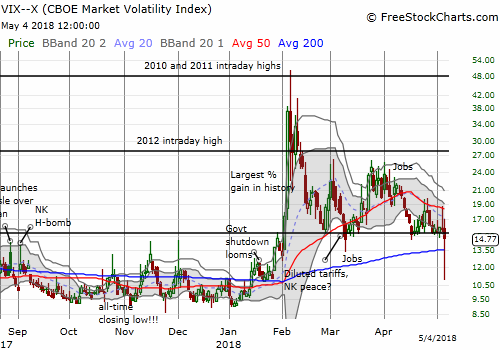
CHART REVIEWS
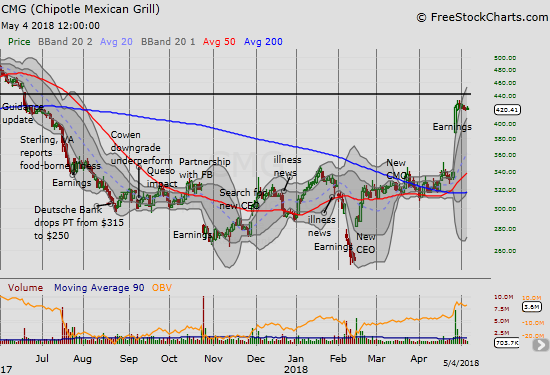
Chipotle Mexican Grill (CMG)
The wait continues. CMG has calmed down since its amazing post-earnings pop. I am itching to pounce long. I just need to see the stock trade over the intraday high of a previous trading day. I let Friday’s high go though. A hit in SwingTradeBot’s “calm after the storm” stock scan would seal my resolve to dive in.
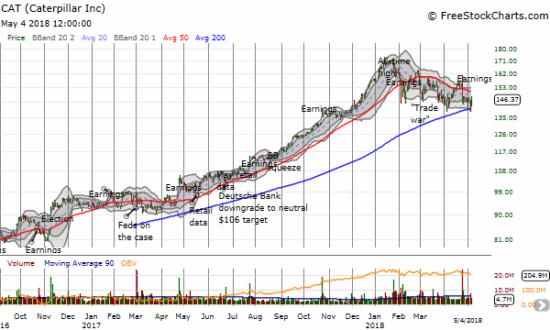
Caterpillar (CAT)
CAT joined the S&P 500 (SPY) in a resounding defense of 200DMA support. I used the last two days to return to using CAT as a hedge against more market malaise. Despite Friday’s 1.8% gain, CAT did not quite make a post-earnings high.
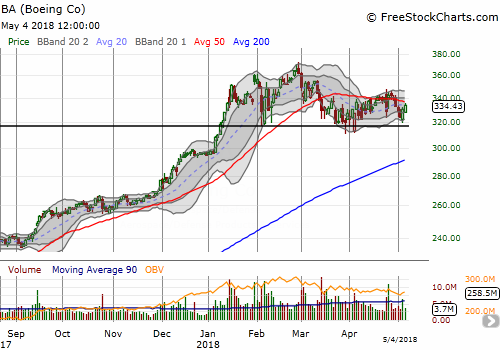
Boeing (BA)
Despite my bearishness, I could not resist testing BA’s relatively consistent behavior when it neared the bottom of its trading range. Sure enough, I was able to sell my call options at a profit after the stock made a 180 off support from the range. I will be looking to buy puts when/if BA hits the top of the range regardless of my trading call at the time.
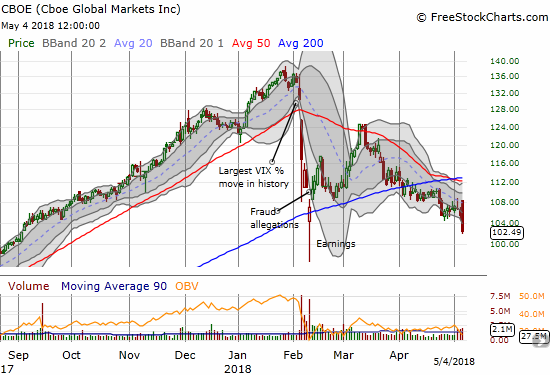
Cboe Global Markets, Inc. (CBOE)
I invested in CBOE for a longer-term trade, so I am trying not to get distracted by its on-going technical weakness. CBOE closed at a post-earnings and 8-month low. If it closes below February’s intraday low, I will likely have to rethink my thesis and the investment in it.
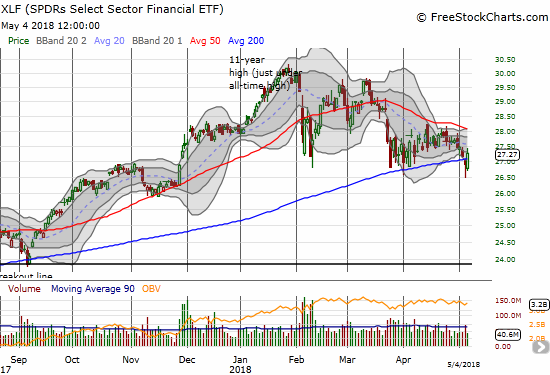
Financial Select Sector SPDR ETF (XLF)
The surprising weakness in CBOE parallels the lackluster performance of financials. On Thursday, XLF broke down below its 200DMA support. Unlike the S&P 500, it failed to bounce back. XLF’s breakdown seemed to add a confirmation to my short-term cautious bearishness. It took Friday’s big market rally to drag financials kicking and screaming out of the bearish abyss. XLF gained 1.3% on the day. I remain leery.
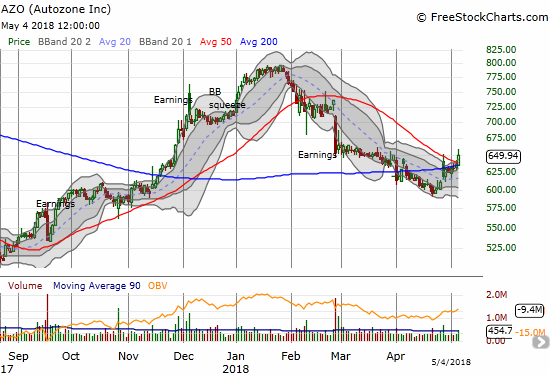
Autozone (AZO)
In my previous Above the 40 post, I noted my surprise that AZO received tepid sympathy lift from the stellar post-earnings response in O’Reilly Automotive (ORLY). With the S&P 500 snapping back and AZO trading above its 200DMA, I decided to rush in with a position. My move turned out to be very timely as AZO soared on Friday as much as 3%. I sold my call option for 3.5x what I paid. While I was prepared to hold the call option for the two weeks left until expiration, I followed the rule to sell options which double or more in price very quickly after purchase. It is a profit preservation rule that assumes such quick gains are hard to sustain. Needless to say, AZO is going to stay on my radar all the way through its next earnings report on May 22nd. I expect to have a bullish position ahead of those earnings if the stock remains around current levels.
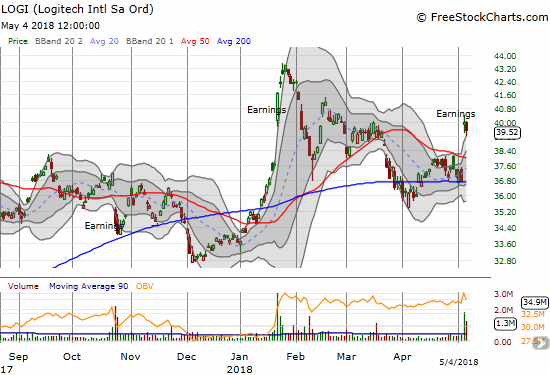
Logitech (LOGI)
I heaved a major sigh of relief when LOGI popped post-earnings over its 50DMA resistance. My position is back in the green after buying the second tranche of stock ahead of earnings, and I think my longer-term bullish thesis on this trade remains intact.
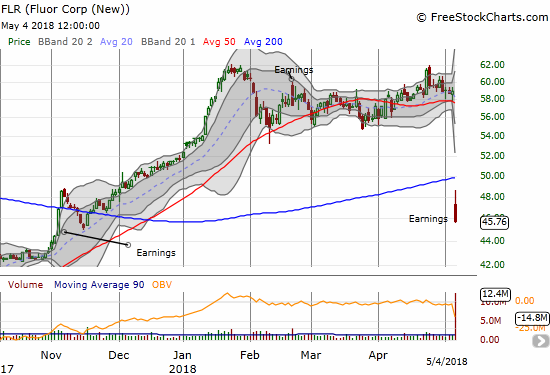
Fluor (FLR)
I breathed a sigh of relief for a different reason in FLR. When material stocks bearishly broke down in late March, I sold my long-standing position in FLR as a precaution. On Friday, FLR imploded by 22.4% after reporting earnings that clearly disappointed investors bigtime. I am now looking for an excuse to buy back in, but I have not yet had time to investigate the earnings news.
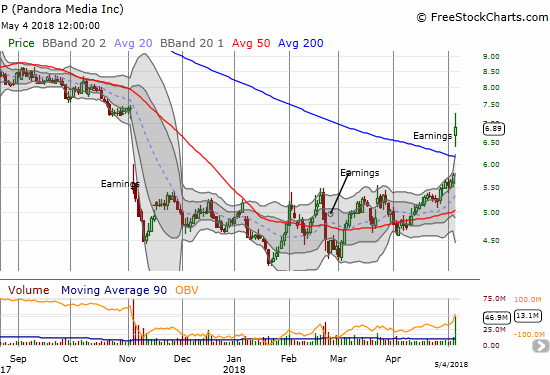
Pandora (P)
For the first time ever, I am getting bullish feelings about Pandora. The stock gapped up 19.8% after reporting earnings. The move easily cleared 200DMA resistance and a 6-month trading range in place since Pandora’s last post-earnings disaster. At its high of the day, P almost closed the gap from its previous collapse. Importantly, bears are all over Pandora with 31% of its float still sold short.
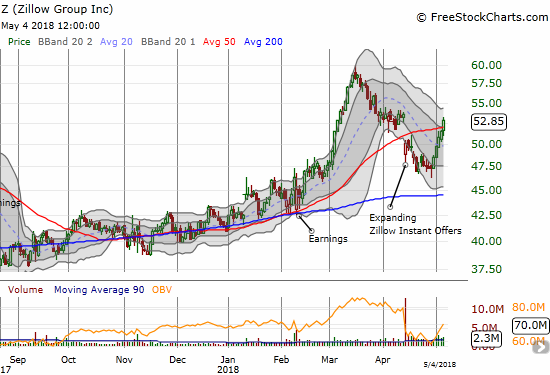
Zillow (Z)
Speaking of recoveries in single-letter stock symbols, Z ended the week with a 2.6% gain and a close above its 50DMA resistance. The stock closed the gap from the panic over the company’s expansion of “Instant Offers.” I am a buyer on a higher close no matter what my trading call is at the time.
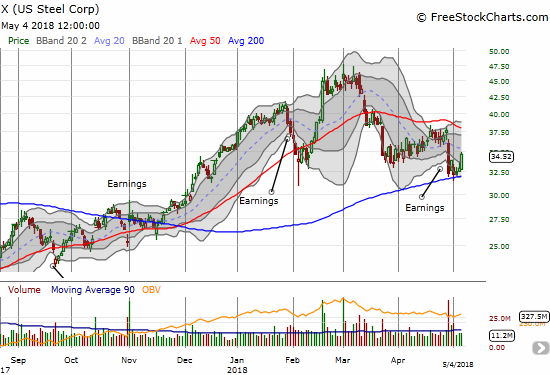
U.S. Steel (X)
If there was ever a sell on the news play, U.S. Steel was it. The stock peaked just as steel tariffs were confirmed. Since then, exemptions and deals have been struck. At its lowest close last week, X was down 30.0% from its last peak. Earnings the previous week confirmed 50DMA resistance, but this week the stock bounced off 200DMA support. I might take a flyer on call options to play a retest of 50DMA resistance which at this point would perfectly reverse post-earnings losses.
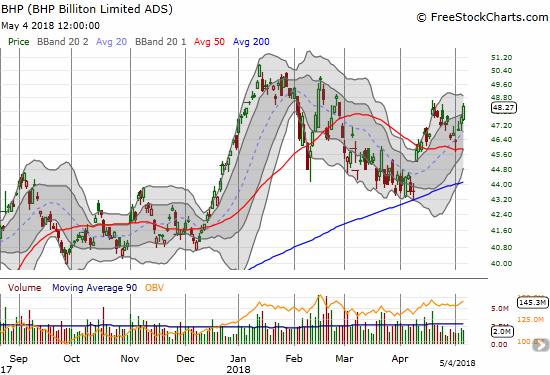
BHP Biliton (BHP)
I may have to relinquish my bearishness on iron ore and BHP in particular. Finally, my cycling through trades in BHP puts look ready to fail. BHP has fought off strength in the U.S. dollar (DXY) to make a new 2 1/2 month closing high. A hammer pattern at 50DMA support adds to the bullish case here. As a reminder, I go to pairs trade mode if Rio Tinto (RIO) makes a new high. RIO’s chart does not look quite as good as BHP though.
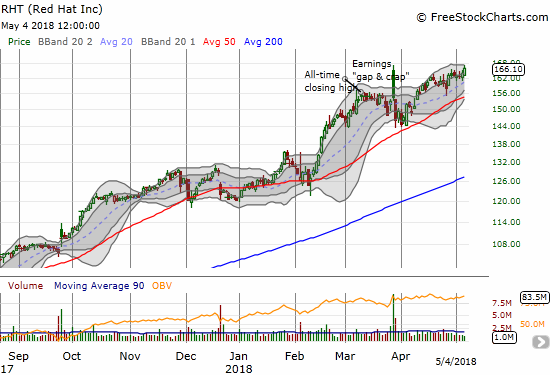
Red Hat (RHT)
Can you tell yet that I am conflicted about my bearish short-term trading call? Well if not, posting this chart of RHT’s new all-time high should do the trick.
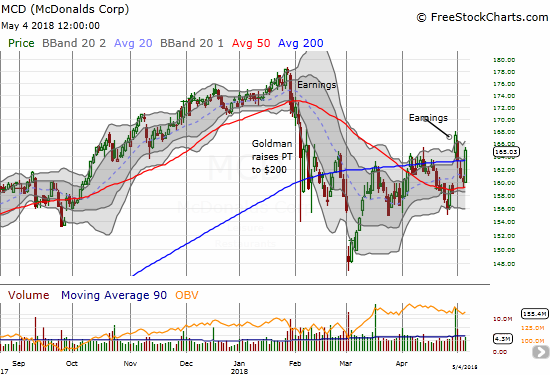
McDonald’s (MCD)
MCD was one of many stocks to quickly lose post-earnings love. A 5.8% gain and 50DMA breakout should have brought the bulls back in force. Instead profit-takers and faders pushed MCD quickly into a test of 50DMA support. Friday’s 3.1% gain confirmed that support with a fresh 200DMA breakout.
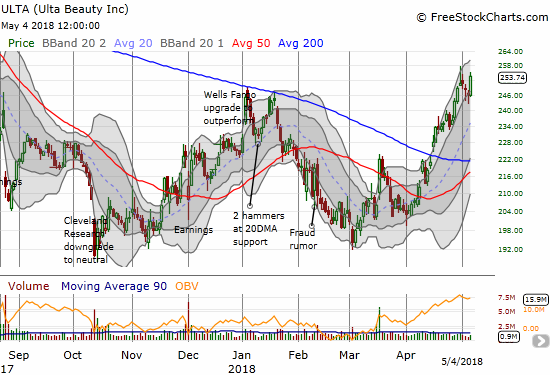
Ulta Beauty (ULTA)
It took me too long, but I returned to the bullish camp on ULTA this week. I covered an ill-fated short the previous week and bought the pullback to the lower part of the uptrend channel through the upper-Bollinger Bands (BBs). The 2.8% gain on Friday seemed to confirm the wisdom of my change in heart.
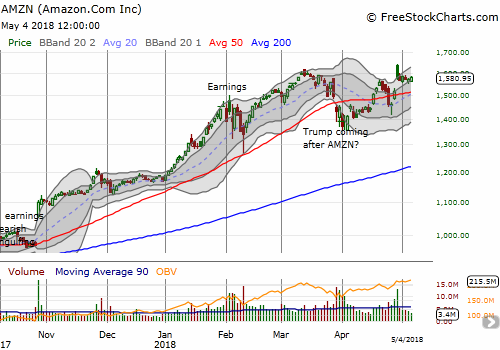
Amazon.com (AMZN)
If AMZN resumes its upward push, I will be hard-pressed to stick to my bearish biases on the general stock market. AMZN is surviving its gap and crap post-earnings move with a stabilization in its shares. The stock looks ready to climb up its upper-BB. As a reminder I bought a calendar call spread in AMZN as a hedge against my bearishness. Now I find myself near ready to root for the bulls.
Other trades: I took a loss on my Facebook (FB) calls leftover from a calendar spread and am now left with FB shares short; I flipped Intel (INTC) call options twice.
— – —
FOLLOW Dr. Duru’s commentary on financial markets via email, StockTwits, Twitter, and even Instagram!
“Above the 40” uses the percentage of stocks trading above their respective 40-day moving averages (DMAs) to assess the technical health of the stock market and to identify extremes in market sentiment that are likely to reverse. Abbreviated as AT40, Above the 40 is an alternative label for “T2108” which was created by Worden. Learn more about T2108 on my T2108 Resource Page. AT200, or T2107, measures the percentage of stocks trading above their respective 200DMAs.
Active AT40 (T2108) periods: Day #55 over 20%, Day #24 over 30%, Day #19 over 40%, Day #1 over 50% (overperiod ending 4 days under 50%), Day #12 under 60% (underperiod), Day #69 under 70%
Daily AT40 (T2108)
")
Black line: AT40 (T2108) (% measured on the right)
Red line: Overbought threshold (70%); Blue line: Oversold threshold (20%)
Weekly AT40 (T2108)

*All charts created using freestockcharts.com unless otherwise stated
The charts above are my LATEST updates independent of the date of this given AT40 post. For my latest AT40 post click here.
Related links:
The AT40 (T2108) Resource Page
You can follow real-time T2108 commentary on twitter using the #T2108 or #AT40 hashtags. T2108-related trades and other trades are occasionally posted on twitter using the #120trade hashtag.
Be careful out there!
Additional disclosure: long SPY shares, long UVXY calls, long CAT puts, long BHP puts, long AMZN calendar call spread, long ULTA, long AAPL call spread, long CBOE shares, long QCOM shares and calls
*Charting notes: FreeStockCharts.com stock prices are not adjusted for dividends. TradingView.com charts for currencies use Tokyo time as the start of the forex trading day. FreeStockCharts.com currency charts are based on Eastern U.S. time to define the trading day.