
AT40 = 54.0% of stocks are trading above their respective 40-day moving averages (DMAs)
AT200 = 46.0% of stocks are trading above their respective 200DMAs
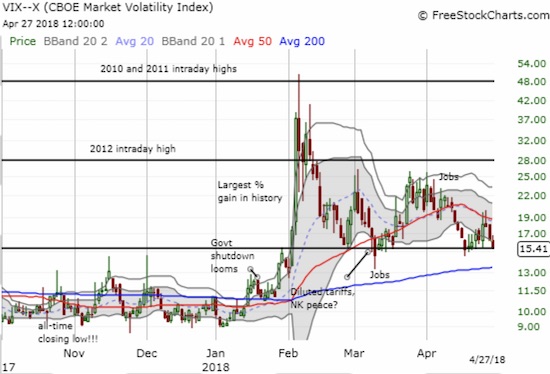
VIX = 15.4
Short-term Trading Call: cautiously bearish
Commentary

Source: My Daughter
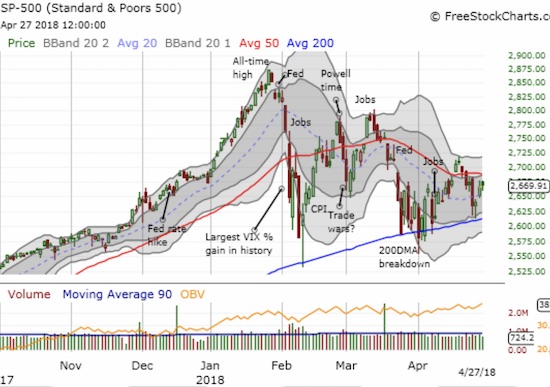
A week ago, I finally changed my short-term trading call: I went from neutral to cautiously bearish. When the stock market sold off sharply on Tuesday, April 24th, my call seemed particularly timely. The S&P 500 gapped higher just under its 50-day moving average and then proceeded to close with a 1.3% loss. At its low of the day, the index almost touched 200DMA support. The next day, the index dropped again to its 200DMA and again buyers held firm. At the time, I figured 200DMA support could not magically hold up well yet again.
Yet another picture-perfect bounce off 200DMA for the S&P 500? I am thinking it won't work so well this round. =gulp= $SPY pic.twitter.com/I3JTy0c7gd
— Dr. Duru (@DrDuru) April 25, 2018
I was wrong! For about the ninth trading day in the last 25, the S&P 500 tested its 200DMA support with either an immediate bounce or a lack of follow-through selling to confirm a 200DMA breakdown. This amazing display of technical prowess is in addition to the swift and convincing test of 200DMA support during February’s oversold adventures.
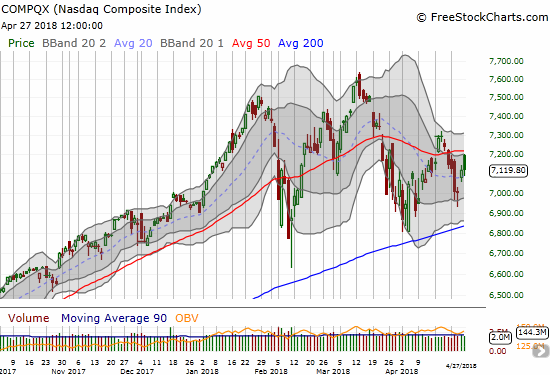
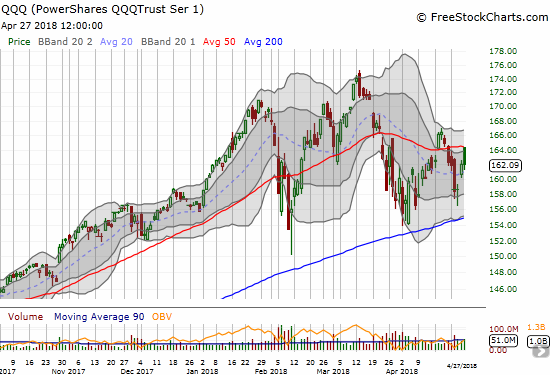
The tech-laden indices of the NASDAQ and the PowerShares QQQ ETF (QQQ) bounced back even more quickly from Tuesday’s selling. A series of bullish earnings reports from major tech stocks helped drive the action. The buyers were so aggressive that at one point these indices were positive for the week before resistance at their respective 50DMAs sent profit-takers right back into the breach.
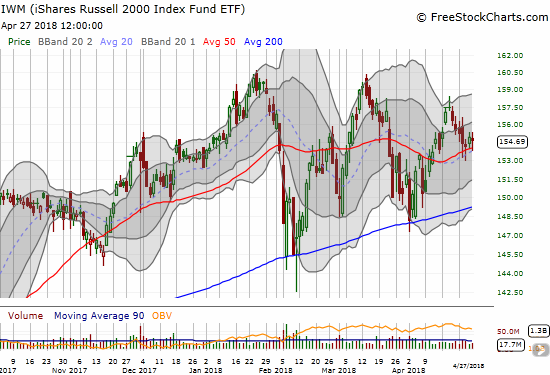
On the flip side, iShares Russell 2000 ETF (IWM) HELD its 50DMA support through the market’s churn for the week.
The volatility index, the VIX, experienced its own whiplash and finished the week with a net loss. The fear gauge finds itself right back at its 15.35 pivot point. This pivot is once again a critical test for investor angst. The VIX has held here ever since February’s historic run-up.
AT40 (T2108), the percentage of stocks trading above their respective 40DMAs, dropped as low as 44.5% during the sell-off. I was surprised it did not fall much further, so I expected yet more selling. The rebound did not reverse all of Tuesday’s loss, and AT40 finished with a net loss on the week. This low-energy bounce gives me plenty of reason to stay cautiously bearish when combined with overhead resistance of 50DMAs on the major indices, the upcoming Federal Reserve meeting, a jobs report, more news on trade negotiations and tariffs, and, oh, yeah, a strengthening U.S. dollar index (DXY). A weakening dollar was previously a great tailwind for financial markets.
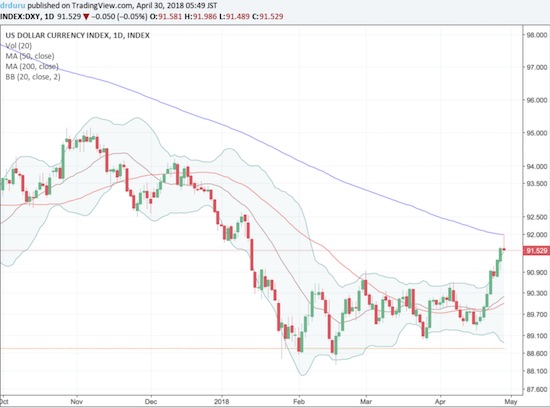
Source: TradingView.com
My favorite indicator from the world of currencies is the Australian dollar (FXA) versus the Japanese yen (FXY). Like so much in the financial markets, AUD/JPY is sitting on a razor’s edge. The currency pair dropped to a converged uptrending 20DMA and a downtrending 50DMA. A breakdown confirms my bearishness. A successful test will “help” me consider returning to neutral for the short-term trading call.
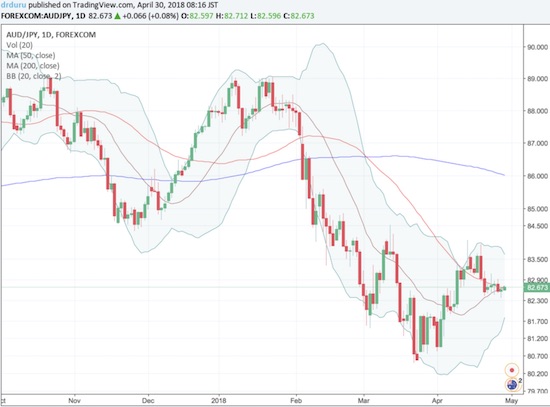
Source: TradingView.com
CHART REVIEWS
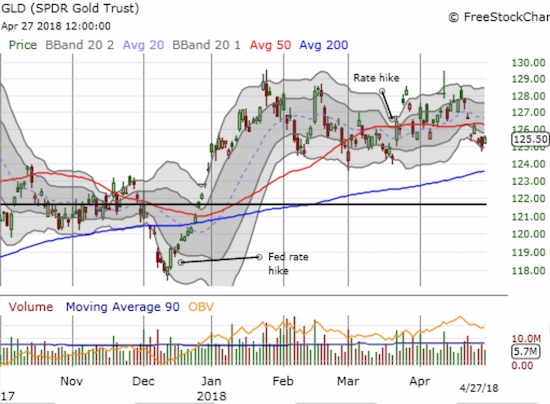
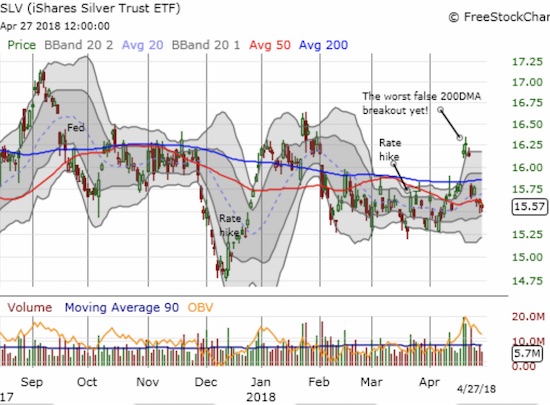
SPDR® Gold Shares (GLD) and iShares Silver Trust (SLV)
GLD and especially SLV were dramatic losers in the face of the dollar’s strength and breakout. I ended my pairs trade long SLV and short GLD just in time as SLV gapped down on Monday by a whopping 2.9% and kept selling off most of the week. GLD gapped down a much more modest 0.8% to start its sell-off for the week. Both SLV and GLD are near or at the bottom of recent trading ranges. SLV is particularly bearish as its earlier 200DMA breakout was completely abandoned leaving eager buyers on an island of false hope. SLV looks so ugly now I am no longer eager to “buy-the-dip” at this juncture; I need an even steeper discount to make the risk worthwhile. At least (large) speculators are no longer net short silver contracts.
Apple (AAPL)
The chart for AAPL does not look dramatic, but I think it is one of the most bearish around relative to its potential impact on sentiment. AAPL’s 200DMA held firm as resistance all week. Given I entered the week bearish, I was comfortable flipping puts on AAPL (twice) after AAPL turned a gap up open on Monday into a 200DMA breakdown. Tuesday’s selling confirmed the breakdown, and I find it telling that AAPL finished the week at its lowest close and lowest intraday low in two months. Needless to say, I did not buy my weekly calls this time around. Earnings on Tuesday are extremely important even as the market’s reaction to other macro factors could twist Apple around multiple times post-earnings.

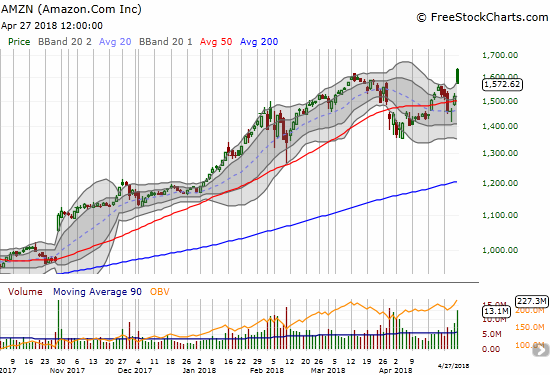
Amazon.com (AMZN)
The jury is still out on whether AMZN’s post-earnings fade is bearish. Sellers will need to finish the reversal of AMZN’s post-earnings gains. AMZN went from its highest point ever to closing below its previous all-time high in a move that became a simple reversal of the previous loss. I took this opportunity to buy a calendar call spread that I will use as a small hedge against whatever fresh bearish positions I take this coming week.
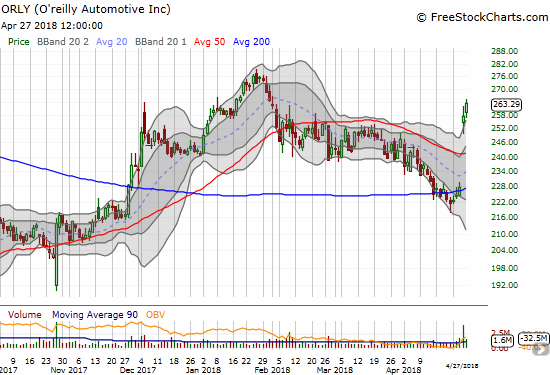
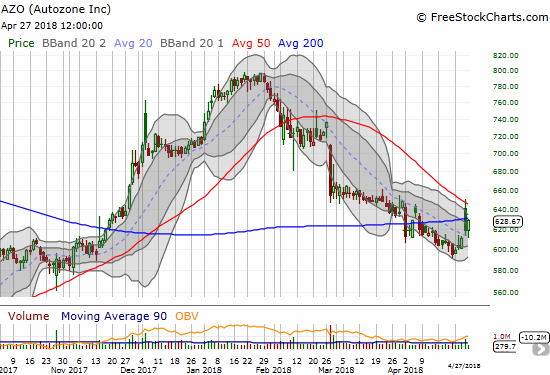
O’Reilly Auto Parts (ORLY) and Autozone (AZO)
ORLY stunned me with a 13.1% post-earnings gap up that handily cleared 50DMA resistance and confirmed 200DMA support. The move was so large that the risk/reward for buying back in looked too high. Buyers stepped in again anyway and took ORLY up another 2.3% on Friday. A new all-time is suddenly right back in play.
AZO tried to ride the coattails of ORLY only to have sellers reject the stock at 50DMA resistance and close it back under its 200DMA. AZO managed to end the week on a positive note, but it remains under 200DMA resistance. Earnings are on May 22nd, but I strongly suspect that traders will be bullishly positioning themselves over the next 3 weeks. I just need to see the stock close above its 200DMA before making my own move. I thought I had time to get back into ORLY, and I do not want to make the same gaffe with AZO!
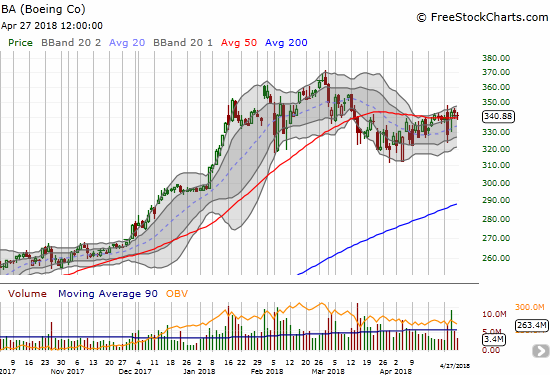
Boeing (BA)
The market liked Boeing earnings enough to reverse Tuesday’s sell-off. Still, BA did not quite break free of its 50DMA resistance. I made sure to have puts in hand for the coming week after seeing this lack of conviction. If BA manages to to close above last week’s intraday high, I will assume the stock has finally achieved escape velocity (meaning I will stop buying puts to fade the stock).
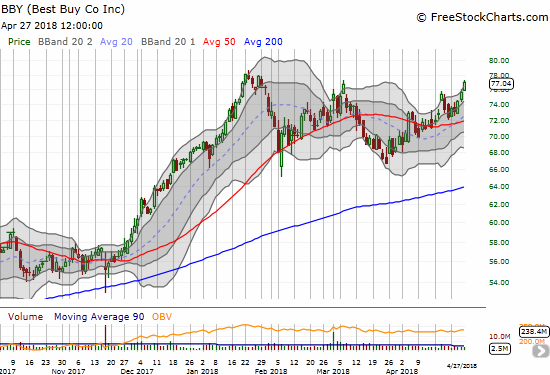
Best Buy (BBY)
BBY is keeping hope alive for big box retail. I am quite surprised to see how well BBY continues to perform right alongside AMZN. BBY ended the week on a very strong note with a close above its upper-Bollinger Band (BB). The stock is within sight of its all-time high set in January.
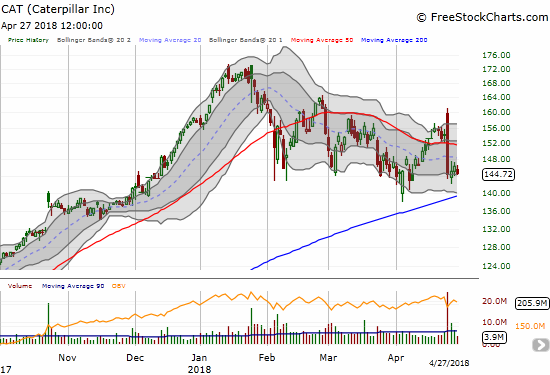
Caterpillar (CAT)
CAT suffered one of the most bearish post-earnings reactions imaginable after an initial positive response. CAT gapped up to its post February sell-off high only to meet a wall of sellers that sent the stock plunging to a 6.2% loss on the day. I was very slow to react to the bearish change of events and only caught the last few points with a fist full of put options. CAT has stabilized somewhat or at least sellers have failed to follow through. So in a twist, I decided to buy call options on CAT as a hedge against bearishness (joining AMZN in such a position).
Here is the quote from the conference call that seemed to cause all the panic (from Seeking Alpha’s transcript):
“As you know, we do not give quarterly guidance. The first quarter was impressive with segment margins that were above our Investor Day targets for both construction and resource industries. While we expect strong operating margins for the rest of the year, which is defined as within our better than the Investor Day ranges. We do not expect to repeat first quarter operating margin at the consolidated level…
…The outlook assumes that first quarter adjusted profit per share will be the high-water mark for the year.”
In other words, the first quarter was absolutely fantastic, but please do not extrapolate that performance into the year. The subsequent selling seems overdone, but investors can be fickle when they hear something is as good as it gets for a while…no matter how good things are now.
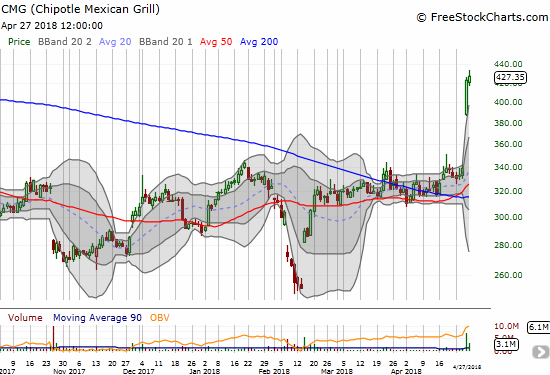
Chipotle Mexican Grill (CMG)
Just as ORLY caught me off guard, CMG doubled that surprise…on the same day too. CMG’s post-earnings performance crushed the souls of shorts (who hold about 25% of CMG’s float hostage) with a monster gap up and subsequent buying that continued until the closing bell rang. CMG gained 24.4% on the day and buyers stepped in again on Friday on the smallest of dips from the open. CMG is clearly a buy on the dips again. I of course regret ever dumping my small number of shares several months ago after the last food poisoning scare that seemed to indicate that CMG would never get out of the food scare cycles. The new CEO is now doing a masterful job with marketing.
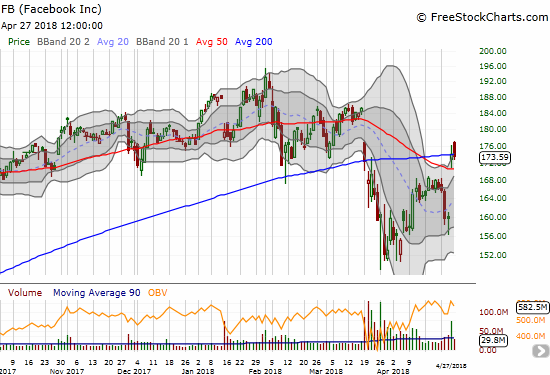
Facebook (FB)
FB earnings were highly anticipated. FB quieted the critics for now with an earnings report that sent the stock right to 200DMA resistance. However, buyers failed to follow through as sellers faded Friday’s gap up right back to the 200DMA. I used earnings to put in place a short on shares paired with a calendar call spread (the short calls expired on Friday worthless).
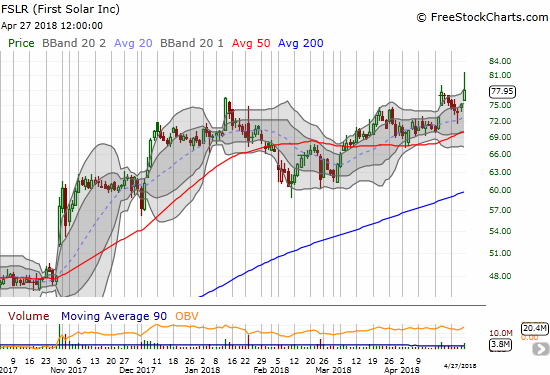
First Solar (FSLR)
I was waiting for a rendezvous with the uptrending 200DMA before snagging shares of FSLR. That moment never came. On April 18th, an upgrade sent FSLR to a new 6+ year high. On Friday, FSLR ended last week with a post-earnings buying spree but sellers managed to fade the stock back under that multi-year high. I am still not in the mood for chasing, so I continue to wait for a better risk/reward entry.
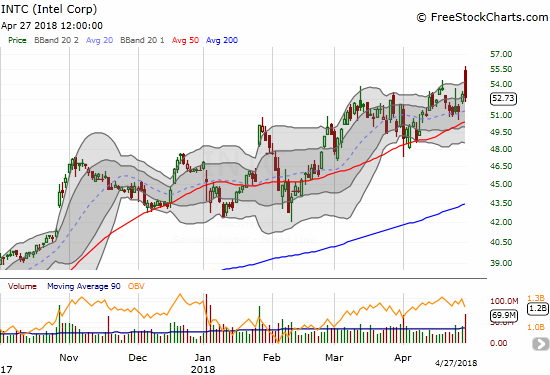
Intel (INTC)
I wrote about the post-earnings prospects for INTC just ahead of its earnings. While my assessments proved correct, I sure did not imagine the PATH INTC would take on its way to wiping out pre-earnings options buyers.
Once again, sellers stepped in to ruin the party by fading the initial excitement over INTC earnings. This time around the sellers wasted no time. INTC gapped up to a fresh 17+ year high and sellers took over from there for the rest of the day. INTC closed with a 0.6% loss. Call buyers could have doubled their money but had to sell right at the open. Note that INTC rallied 3.3% on the day going into earnings so this fade looks worse than it really is. The INTC straddle at the close on Thursday was worth about $2.70, creating a projected post-earnings close of 5.1%. INTC gapped up 5.5%.
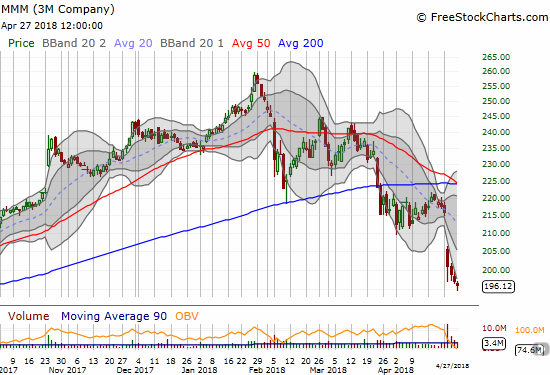
3M (MMM)
The chart of MMM is a sobering reminder of the bearish undertones of the market. While tech stocks battle the profit-takers, industrial stocks like MMM are trying to regenerate the excitement definitively lost in the February swoon. MMM gapped down post-earnings last week and confirmed its bearish 200DMA breakdown and resistance at its 200DMA.
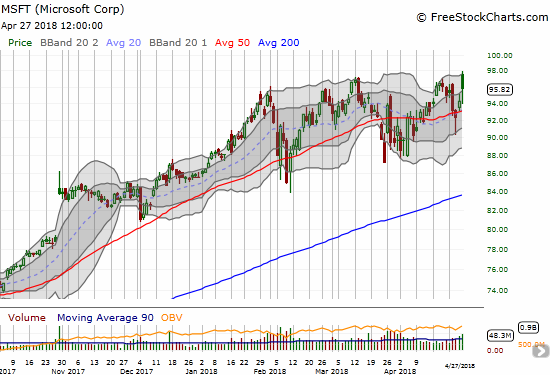
Microsoft (MSFT)
Post-earnings profit-takers jumped on MSFT, but the stock still slugged out a 1.7% gain on the day. If MSFT can recapture a new all-time high, I will assume a bullish turn is underway again.
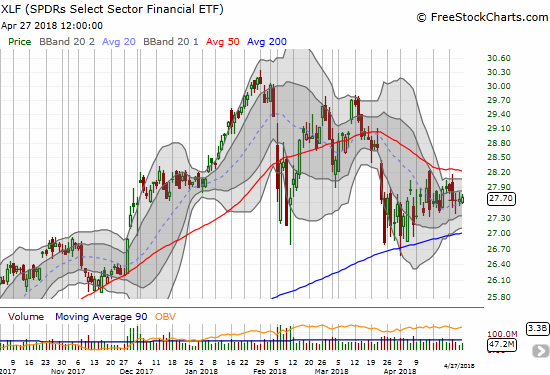
Financial Select Sector SPDR® Fund (XLF)
Financials continue to be a huge disappointment. The banks kicked off earnings season with strong reports. The market shrugged. Now, XLF is just listlessly drifting along between its 50 and 200DMAs. XLF might hold the keys to the market’s next definitive pivot to a bearish or bullish move. I am keeping my eye on XLF.
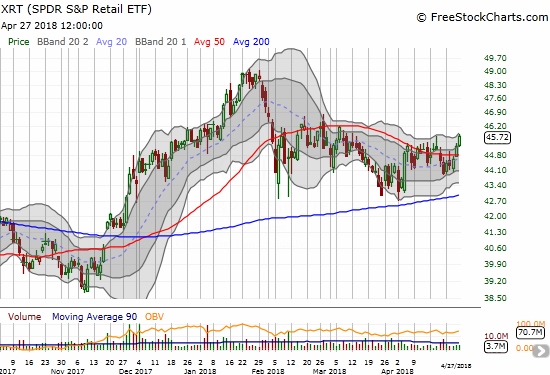
SPDR® S&P Retail ETF (XRT)
Maybe, just maybe, hope remains for the 2018 retail trade? XRT actually broke out from last week’s churn and made a new 7-week high above its 50DMA. My exposure to retail remains limited to my call options on Macy’s (M) and shares and calls on Dick’s Sporting Good (DKS). After “escaping” with profits on earlier retail positions, I am still reluctant to expand my positioning. Perhaps I will re-examine my positioning when I finally get bullish on the market again.
— – —
FOLLOW Dr. Duru’s commentary on financial markets via email, StockTwits, Twitter, and even Instagram!
“Above the 40” uses the percentage of stocks trading above their respective 40-day moving averages (DMAs) to assess the technical health of the stock market and to identify extremes in market sentiment that are likely to reverse. Abbreviated as AT40, Above the 40 is an alternative label for “T2108” which was created by Worden. Learn more about T2108 on my T2108 Resource Page. AT200, or T2107, measures the percentage of stocks trading above their respective 200DMAs.
Active AT40 (T2108) periods: Day #50 over 20%, Day #19 over 30%, Day #14 over 40%, Day #2 over 50% (overperiod), Day #7 under 60% (underperiod), Day #64 under 70%
Daily AT40 (T2108)
")
Black line: AT40 (T2108) (% measured on the right)
Red line: Overbought threshold (70%); Blue line: Oversold threshold (20%)
Weekly AT40 (T2108)

*All charts created using freestockcharts.com unless otherwise stated
The charts above are my LATEST updates independent of the date of this given AT40 post. For my latest AT40 post click here.
Related links:
The AT40 (T2108) Resource Page
You can follow real-time T2108 commentary on twitter using the #T2108 or #AT40 hashtags. T2108-related trades and other trades are occasionally posted on twitter using the #120trade hashtag.
Be careful out there!
Additional disclosure: long SPY shares, long UVXY calls, long GLD, long SLV, long AMZN calendar call spread, short FB shares and long calls, long CAT calls, short AUD/JPY
*Charting notes: FreeStockCharts.com stock prices are not adjusted for dividends. TradingView.com charts for currencies use Tokyo time as the start of the forex trading day. FreeStockCharts.com currency charts are based on Eastern U.S. time to define the trading day.