

Stock Market Commentary
The week closed with strong speculative energy, particularly in crypto, with the signing of a package of crypto legislation including a stablecoin bill. Surprisingly, the speculative frenzy did not translate into the overall stock market beyond a few select stocks like OpenDoor (OPEN). In fact, the major indices mainly had a steady week punctuated by a brief breakdown in market breadth. This shaken but steady behavior came as the market concluded that Trump’s on-going threats and insults hurled at Federal Reserve Chair Jerome Powell would finally culminate in a real attempt to fire the Chair. As if to prevent a real market pullback, Trump hurriedly (quasi) refuted the market rumors which included a termination letter Trump shared with Congressional Republicans. Like so many other false alarms since the tariff blink, the market rebounded right back.
The shaken but steady theme looks like a dominant them for the post tariff scare era. Each incident washes out another cohort of motivated sellers and in turn creates a clearer path of least resistance higher. Still, I feel obligated to keep an eye out for the next risk that the market does not care about for now. Looming largest on my radar is a very real prospect for a very real government shutdown. Last week’s historic rescission vote that clawed back previously appropriated monies from public broadcasting and foreign aid threatens to undermine the good faith required for lawmakers to negotiate budget deals – from Marketplace (which provides broadcasts to public stations) (emphasis mine):
“Usually, the parties have to work together to pass annual “appropriations” bills, because in the Senate, you need 60 votes to pass a spending bill…So, these things end up getting both parties to work, and no one gets exactly what they want. But this time, after lawmakers struck a bipartisan deal in March to fund the government, Republicans alone just voted to change it. They did it just as Congress is negotiating the next round of funding…’And so, the question for Democrats is, how can you know that whatever deal you try to reach with Republicans, won’t then just be cut again in the same way that just happened,’ said Devin O’Connor, a Senior Fellow at the Center on Budget and Policy Priorities…All of this could set up for a government shutdown in the fall if Democrats don’t trust the GOP on a deal.”
Of course few people, especially traders and investors, care about these prospects in this moment. I want to be ready so I don’t need to get ready.
The Stock Market Indices
S&P 500 (SPY)
The S&P 500 displayed technical tension early in the week, forming a bearish engulfing pattern that briefly raised the specter of a top. The Trump-firing rumor seemed set to confirm the top. Yet, as the index approached 20DMA support, Trump (mostly) refuted the rumors and the market quickly rebounded. Buyers never looked back from there. A new (marginal) all-time high followed on Thursday, confirming strength.
NASDAQ (COMPQ)
The NASDAQ outperformed other indices, closing up each day of the week, thanks largely to strength in Nvidia (NVDA). The tech laden index maintained a steady, consistent uptrend, showing slightly better technical strength than the S&P 500.
")
iShares Russell 2000 ETF (IWM)
IWM struggled relative to the S&P 500 and the NASDAQ, churning through the week. Like the S&P 500, the ETF of small caps briefly tested 20DMA support. I somehow neglected to buy another round of call options on the pullback.
")
The Short-Term Trading When Shaken But Steady
- AT50 (MMFI) = 65.3% of stocks are trading above their respective 50-day moving averages (8th overbought day)
- AT200 (MMTH) = 52.8% of stocks are trading above their respective 200-day moving averages
- Short-term Trading Call: cautiously bullish
AT50 (MMFI), the percentage of stocks trading above their 50DMAs, closed the week at 65.3%. My favorite technical indicator opened the week in overbought territory. The next day AT50 traded down to 62.8% before rebounding with the major indices. Still, AT50 never recovered overbought conditions and on Friday pulled away from the 70% overbought threshold. Overall, this behavior is bearish per the AT50 trading rules. Again, I am staunchly remaining cautiously bullish for the short-term trading call because of the layers of support waiting to catch the S&P 500 on any pullback.
In the spirit of avoiding complacency, I am not only looking out for looming fundamental risks to the market, but also I am warily noting that AT50 has spent the last two months pivoting around the overbought threshold with the majority of the time below 70%. Thus, while buyers still dominate the market, the longer this bias remains for trading below 70%, the more I will worry about an imminent pullback consistent with the AT50 trading rules.
I am also watching AT200 (MMTH), the percentage of stocks trading above their 200DMAs. This indicator of longer-term health in market breadth pulled back along with AT50. Its rebound failed to return AT200 to its confirmation level. This confirmation level of 56.1% matches where AT200 traded at the previous S&P 500 all-time high in February. I want to see a return to at least those levels to feel more at ease.
Charts of AT50 and AT200 are at the bottom of this post.
The Equities: Shaken But Steady
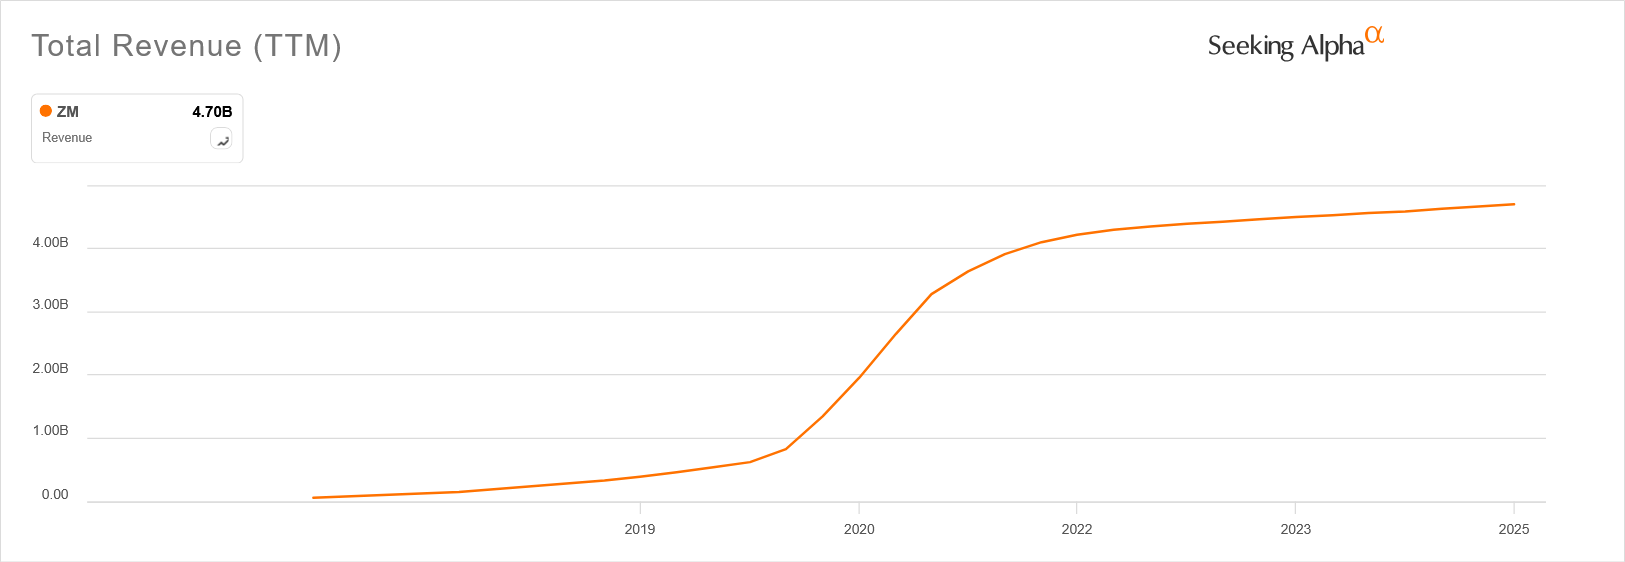
Zoom Video Communications (ZM)
Technical status: Broke below both the 50DMA and 200DMA after failing at converged support.
Trade commentary: I will not initiate trades, but I am monitoring for a potential future breakout. I was really hopeful that ZM would have regained favor by now. Instead, it looks ZM will go down as a company with ubiquitous software that is only good enough for a stable, not growing, business. The chart below from Seeking Alpha shows how the company grew revenue (trailing twelve months0 like gangbusters with the onset of the pandemic and then practically came to a screeching halt after 2022.
Okta, Inc (OKTA)
Description: Okta, Inc. is an independent identity provider that offers identity and access management solutions to securely connect people to technology, including Single Sign-On and Multi-Factor Authentication.
Technical status: Holding above its 200DMA after a series of volatile earnings seasons.
Trade commentary: In early April I claimed that OKTA was thrown out with the bath water of the tariff drama, trauma, and noise. I bought shares shortly afterward but was lucky to take profits ahead of last May earnings. That 16.2% post-earnings plunge was a stark reminder of why so many otherwise attractive stocks are essentially rentals for trade. Sine I remain a fan of the company, I sold a put to grab some panic-driven premium. I was subsequently assigned shares at the $105 strike. Since then, I have sold calls against this position three times. The latest call has a $100 strike price and expiration this coming week.
Fastenal Company (FAST)
Description: Fastenal Company distributes industrial and construction supplies across North America, offering fasteners, tools, safety products, and inventory management services to manufacturing and construction customers.
Technical status: Jumped 4.2% on earnings to reach new all-time highs and has gained every day since.
Trade commentary: FAST is a buy on the dips given its strong bullish positioning. This stock is also suitable for a long-term investment given years, even decades, of growth over time.
Freeport-McMoRan (FCX)
Description: Freeport-McMoRan Inc. is a leading international mining company primarily engaged in the extraction of copper, gold, and molybdenum, with operations in North and South America and Indonesia.
Technical status: FCX pulled back to its 20DMA after rallying well above its upper Bollinger Band (BB).
Trade commentary: For risk management, I took profits on FCX into strength. I am monitoring support for the next buy entry while staying cautious ahead of earnings. Copper is subject to increased tariffs in the U.S. and trading at all-time highs. FCX is lagging the commodity.
SPDR Select Sector Fund – Financial (XLF)
Description: The SPDR Select Sector Fund – Financial (XLF) is an exchange-traded fund that seeks to provide investment results corresponding to the performance of financial sector equities in the S&P 500 Index.
Technical status: Briefly lost prior all-time high support but recovered by week’s end.
Trade commentary: I made the case for a bullish trade on the XLF breakout through a YouTube short. I subsequently accumulated call options, including through the brief breakdown below the former all-time high. This was a classic “shake but steady” setup. I now expect a resumption of the move higher (all else being equal of course).
iShares Expanded Tech-Software Sector ETF (IGV)
Description: The iShares Expanded Tech-Software Sector ETF (IGV) tracks an index of U.S. software and services companies, providing targeted exposure to firms in the software industry, including application and infrastructure software providers.
Technical status: Held 20DMA support after falling back into the zone of its double top.
Trade commentary: A week ago I flagged IGV’s sharp pullback from all-time highs as a potential warning about software stocks. This rebound from primary support averts a bearish signal. Now IGV needs to finish reversal with a new all-time high.
CoreWeave, Inc (CRWV)
Description: CoreWeave, Inc. is a specialized cloud provider focused on high-performance computing workloads, including AI/ML, VFX, and pixel streaming, using a network of GPU-accelerated infrastructure.
Technical status: Broken below its 50DMA and in a steady downtrend from its all-time high.
Trade commentary: CRWV is not a a buy candidate given the 50DMA breakdown. I also will not short the stock because of the potential for the stock to soar 10-20% on any given day for no reason. The stock is down 23% since announcing a deal to acquire Core Scientific in an all-stock deal. I expect CRWV to continue making moves to take advantage of its over-priced stock including a large release of stock whenever its lock-up(s) expire. An analyst slammed CRWV with a “reduce” rating on Thursday with a $32 price target due to its over-reliance on just two, albeit large and important, customers, Microsoft (MSFT) and Nvidia (NVDA).
Duolingo, Inc (DUOL)
Description: Duolingo, Inc. operates a digital language learning platform that offers bite-sized lessons in over 40 languages, using gamification to increase user engagement and retention.
Technical status: Testing 200DMA support after a near 2-month decline.
Trade commentary: I will consider entering on a close above Friday’s closing price. However, that steep 20DMA could prove to be tough resistance before a rally to looming 50DMA resistance.
Whirlpool Corporation (WHR)
Description: Whirlpool Corporation is a global home appliance manufacturer known for its brands like Whirlpool, KitchenAid, and Maytag, offering a wide range of products including washers, dryers, refrigerators, and ovens.
Technical status: Reversed below its 200DMA after briefly breaking above.
Trade commentary: I bought an August $90 put option after noticing the breakdown below converged support from WHR’s 20DMA and 50DMA. I suspect the 50DMA will hold as support. Regardless, WHR’s sudden streak of enthusiasm followed by a sharp fall from favor has all the look of trader’s games.
Sarepta Therapeutics (SRPT)
Description: Sarepta Therapeutics, Inc. is a medical research and drug development company focused on precision genetic medicine for rare diseases, particularly Duchenne muscular dystrophy (DMD).
Technical status: Highly volatile with massive 35.9% sell-off on a double dose of bad news immediately following a brief post-restructuring 19.5% rally.
Trade commentary: I bought speculative shares on the restructuring news, partially encouraged by a thumbs up from CNBC’s Fast Money. I bought a small amount of shares with a stop set on a full reversal of Thursday’s gain. The subsequent collapse in the stock is a stark reminder of how simple stops can be in sufficient tools of risk management.
Sarepta’s management now faces scathing criticism for non-disclosure on a patient death. The company’s main drug may also get shut down by the FDA.. Still, I decided to trade on the potential of an overdone panic-driven sell-off by selling a weekly put at the $12.50 strike. With SRPT’s continued fall from a multi-year trading range, I am not likely to hold SRPT long whether for gain or to stop the bleeding.
3M Company (MMM)
Description: 3M Company is a diversified technology and manufacturing company that produces a wide range of products including adhesives, abrasives, personal protective equipment, and consumer goods.
Technical status: Formed a bearish engulfing top with a 3.7% drop after earnings gap-up.
Trade commentary: I am not buying MMM because of the bearish signal. However, I am monitoring for a future setup perhaps on a test of 200DMA support (the blue line).
Domo, Inc (DOMO)
Description: Domo, Inc. offers a cloud-based business intelligence platform that connects data, people, and systems to enable real-time decision-making and business insights at scale.
Technical status: DOMO rose 13% after prior pullbacks to 20DMA and 50DMA support.
Trade commentary: As part of risk management with the stock market at lofty levels and DOMO at resistance near a 2-year high, I sold August $17 calls against my position. If this sudden surge is the start of another sharp run-off, I could be DOMO-less in August. If so, I will evaluate a reentry strategy, if I decide it makes sense.
Spotify Technology (SPOT)
Description: Spotify Technology S.A. operates a digital music streaming service that provides access to millions of songs, podcasts, and other audio content to users worldwide via both free and premium subscription models.
Technical status: Sitting at 50DMA support after a long uptrend.
Trade commentary: As planned, I bought a small number of shares on at test of 50DMA support to start a long-term position. I fully recognize I am VERY late on SPOT, so I am bracing myself for a larger pullback as far as 200DMA support. Note that such a pullback would be a major event since SPOT last touched its 200DMA in January, 2023. At that time, SPOT broke out above its 200DMA as part of a confirmation of its bear market bottom. SPOT only traded around $99 so that breakout was a HUGE missed opportunity.
ARK Innovation ETF (ARKK)
Description: The ARK Innovation ETF (ARKK) is an actively managed ETF from ARK Invest that aims to capture long-term growth by investing in companies involved in disruptive innovation across sectors like genomics, AI, and fintech.
Technical status: Trading far above its upper Bollinger Band to a 3 1/2 year high.
Trade commentary: I have had quite a change of heart in ARKK starting with its breakout above the pre-pandemic high back in December, 2024. That moment converted me into an ARKK bull (and sometime apologist). As a reminder, I monitored ARKK closely since its collapse, even though I was bearish, because I wanted to have shares on hand in case Cathy Wood and company figured out how to turn the ship around.
That moment finally came with a fresh breakout above the pre-pandemic high back in December. Thanks to my bullishness, despite subsequent pullbacks, this year I accumulated a core ARKK position in addition to trading covered call positions, including during the tariff drama, trauma, and noise. Now, after an impressive run-up, ARKK over-extended above its upper-BB. As a part of risk management, I sold August $80 call options against my core position. Assuming ARKK will maintain its typical volatility, a pullback is highly likely before the August expiration.
")
")
Be careful out there!
Footnotes
Subscribe for free to get email notifications of future posts!
“Above the 50” (AT50) uses the percentage of stocks trading above their respective 50-day moving averages (DMAs) to measure breadth in the stock market. Breadth defines the distribution of participation in a rally or sell-off. As a result, AT50 identifies extremes in market sentiment that are likely to reverse. Above the 50 is my alternative name for “MMFI” which is a symbol TradingView.com and other chart vendors use for this breadth indicator. Learn more about AT50 on my Market Breadth Resource Page. AT200, or MMTH, measures the percentage of stocks trading above their respective 200DMAs.
Active AT50 (MMFI) periods: Day #43 over 20%, Day #41 over 30%, Day #36 over 40%, Day #31 over 50%, Day #29 over 60%, Day #4 under 70%
Source for charts unless otherwise noted: TradingView.com
Full disclosure: long IWM shares, long SPY put spread, long OKTA shares and short call, long XLF calls, long WHR put, long SRPT and short SRPT put, long DOMO shares and short calls, long SPOT, long ARKK shares and short calls, long IPO
FOLLOW Dr. Duru’s commentary on financial markets via StockTwits, BlueSky, and even Instagram!
*Charting notes: Stock prices are not adjusted for dividends. Candlestick charts use hollow bodies: open candles indicate a close higher than the open, filled candles indicate an open higher than the close.
* Blog notes: this blog was written based on the heavily edited transcript of the following video that includes a live review of the stock charts featured in this post. I used ChatGPT to process the transcript.