

Housing Market Intro and Summary
What happened in the housing market in February, 2024? Breakouts and bottoms happened. In my previous Housing Market Review, I posited the possibility of a top in the seasonal trade on home builders. In the subsequent month, the stocks of home builders took on new life as investors forgot about their previous disappointments. The fresh focus on positive news from the likes of Toll Brother, Inc helped drive a series of breakouts in the stocks of home builders. The housing data reported in February mostly supported the fresh momentum.
- Builder sentiment enjoyed a third straight month of improvement.
- Housing starts remain in breakout territory.
- New home sales stabilized.
- Perhaps most importantly, existing home sales are bottoming.
However, a bottom in mortgage rates in February should paint some caution on the fresh optimism and momentum. Buyers were extremely active in January while rates fell. Applications for new home mortgages stalled in February. The housing market faces an important test in the current spring selling season.
Housing Stocks
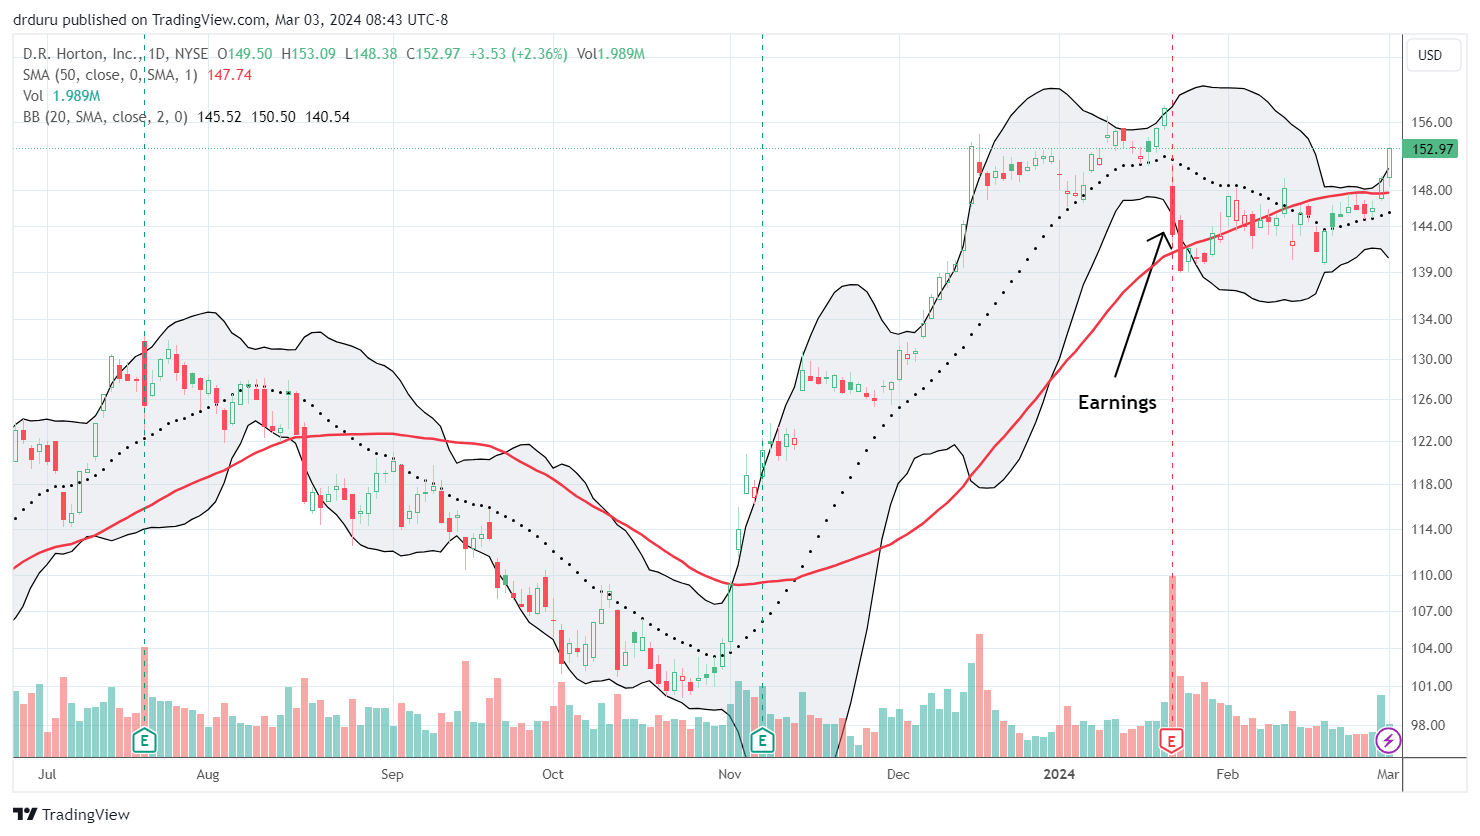
Disappointing earnings news from D.R. Horton, Inc (DHI) temporarily took the iShares US Home Construction ETF (ITB) down to the bottom of its previous trading range. Over a month later, the market has all but forgotten about those troubles. Last week, ITB broke out to a new all-time high, led by breakouts to all-time highs by Lennar (LEN) and PulteGroup (PHM). ITB is even on the verge of going parabolic.
")
ITB under-performed the S&P 500 (SPY) in January by -1.7% versus 1.6%. However, ITB closed the gap with dramatically improved year-to-date performances for both indices. ITB is now up 7.8% year-to-date versus 7.7% for the S&P 500. Thus, the seasonal trade is still technically over given the strategy identifies periods of likely ITB out-performance. Still, the overall strong performance makes late stage trades attractive.
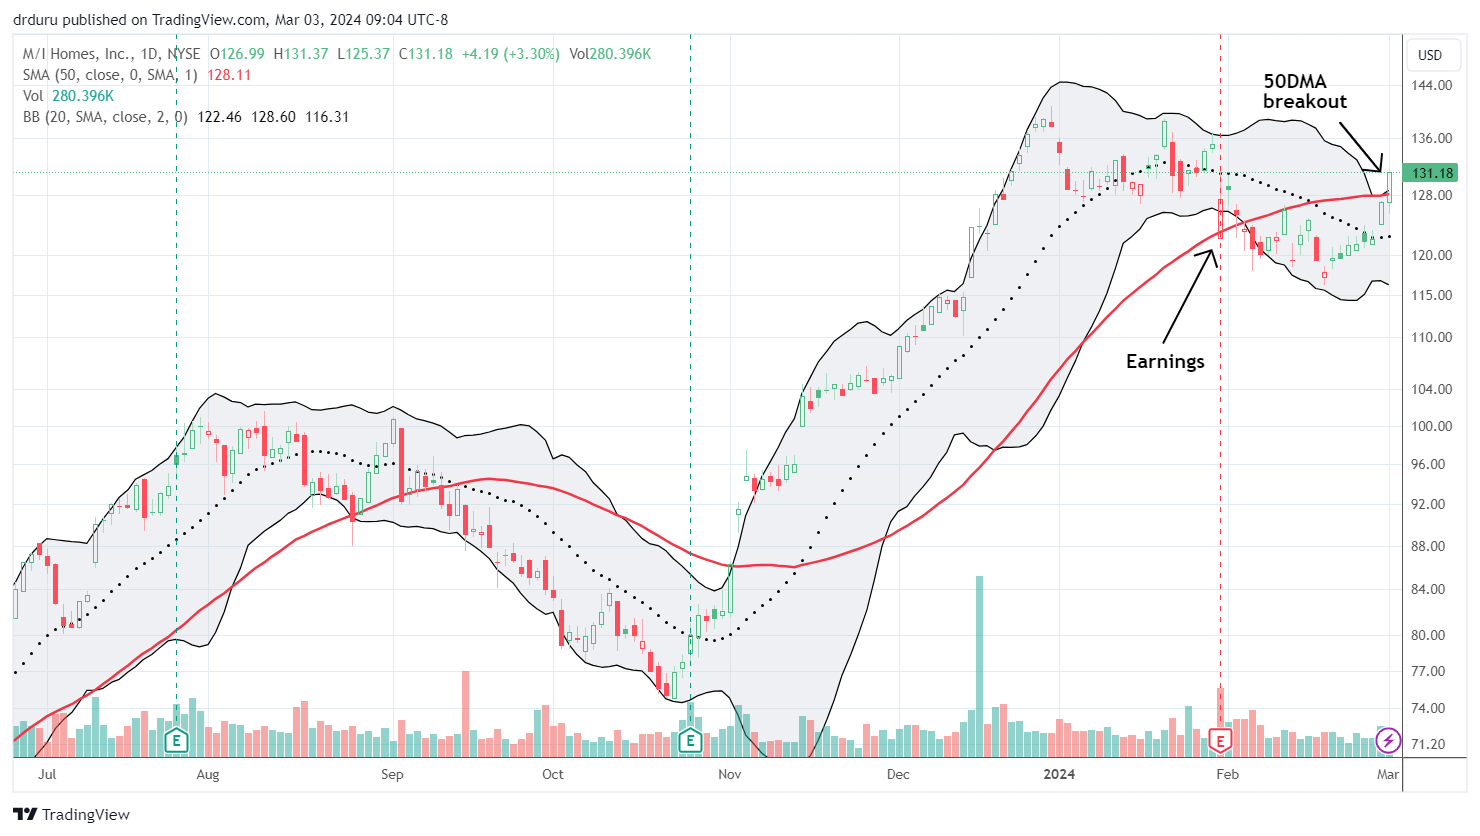
The change in investor sentiment is quite dramatic. In the last Housing Market Review I noted that in addition to DHI’s 9.2% post-earnings loss, two other builders experienced sizable post-earnings losses: Meritage Homes (MTH) -7.2%, and M/I Homes (MHO) -5.7%. While MTH continues to languish a bit, MHO has nearly reversed its losses. Even Beazer Homes (BZH) has completely reversed its post-earnings loss. I like MHO the most for a late stage trade since it just broke out above its 50-day moving average (DMA) the red line.
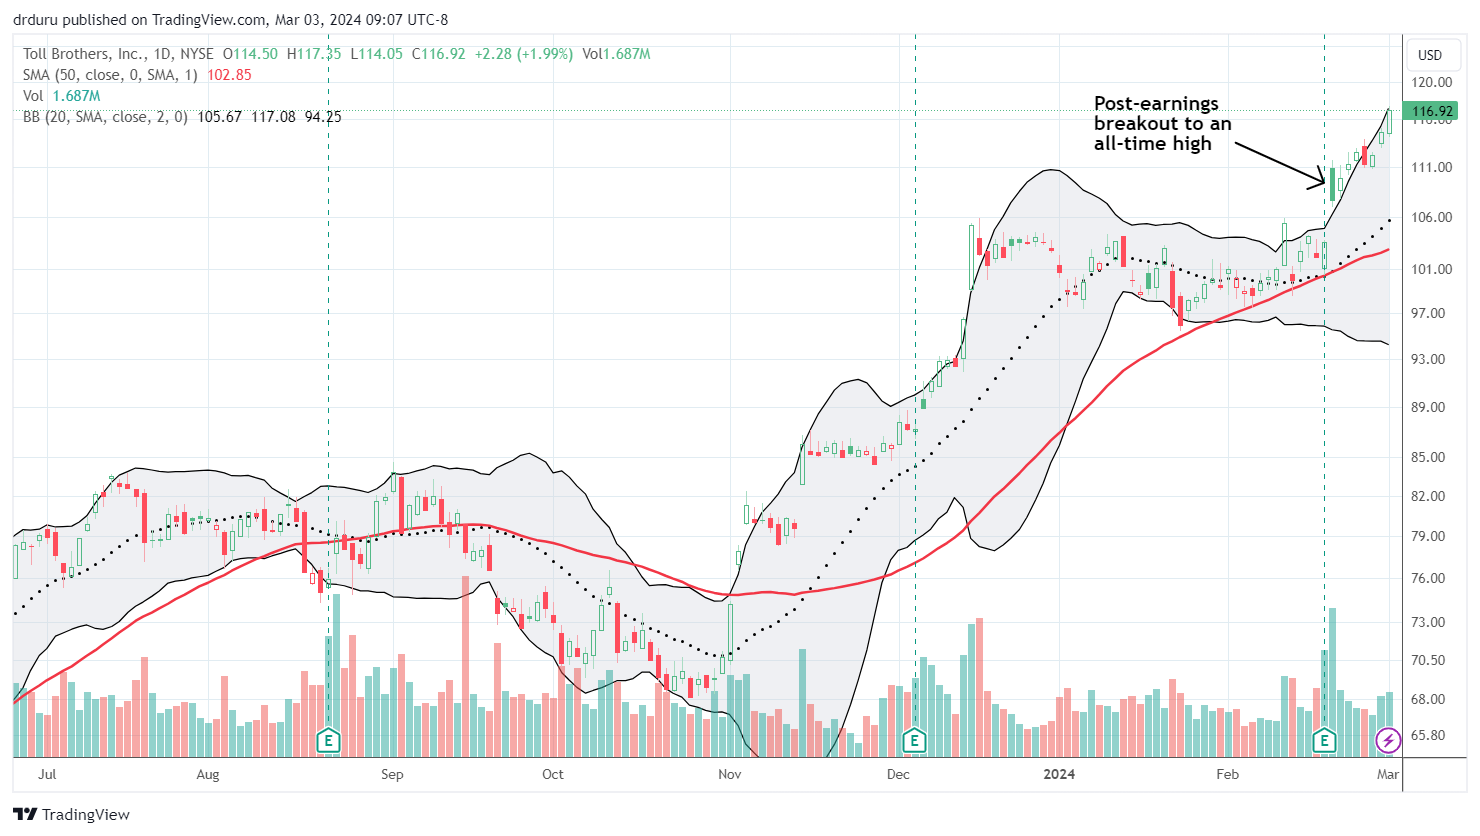
I think Toll Brothers (TOL) helped to flip investor sentiment even though it is unique as a luxury builder. TOL’s breakout on February 21st occurred at the start of the current rally for ITB.
LGI Homes (LGIH) is one of my favorite builders, but it continues to languish after its 8.4% post-earnings loss.
Housing Data
Home Builder Confidence: The Housing Market Index – February, 2024
The rebound in builder sentiment continued for a third straight month. February’s 5 point jump to 49 for the National Association of Home Builders (NAHB)/Wells Fargo Housing Market Index (HMI) brought sentiment to the edge of returning to positive territory (above 50). The components gained 3 or 4 points for a relatively even distribution. The HMI component SF Detached Next Six Months (Seasonally Adjusted) last changed by such a small amount in July, 2023.
With confidence on the move higher and mortgage rates lower overall, the NAHB reported an on-going reduction in pressure to incentivize sales. The 25% share of builders cutting prices is significantly down from January’s 31% and December’s 36%. However, the average price discount stayed flat at 6% for the eighth straight month (revised upward?). The share of builders providing incentives decreased from 62% in January to 58% in February which in turn is the lowest share since last August.
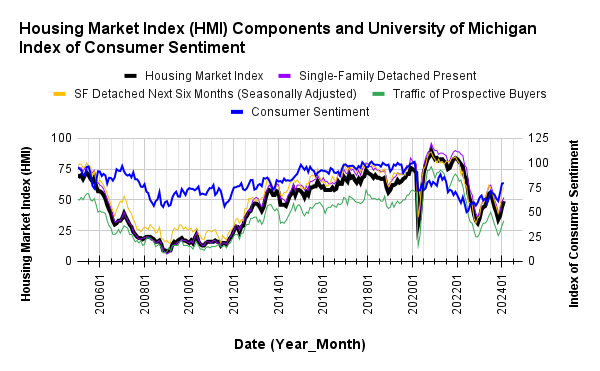
/Wells Fargo Housing Market Index (HMI) and the University of Michigan Index of Consumer Sentiment")
Source for data: NAHB and the University of Michigan
Note how the HMI previously peaked alongside consumer sentiment. Builder sentiment is rising with consumer sentiment but still lags the breakout. I continue to expect builder sentiment to chase consumer sentiment higher and further confirm the recent trough as the low for this cycle.
Every region experienced an increase in its HMI with confidence surging in the Northeast and West. In January, the West jumped off its lows by 9 points. In February the West surged again by 9 points. The Northeast jumped by 7 points for its fourth straight month in positive territory. The South became the second region to enter positive territory with an HMI that nudged higher from 49 to 50. The Midwest is now a major laggard with an HMI increasing from 35 to 38.
New Residential Construction (Single-Family Housing Starts) – January, 2024
In November, single-family housing starts broke with the bottom in builder sentiment. December and now January delivered fresh diverges between sentiment and starts. For now, I assume this is a natural pullback after a rush to get ready for the spring selling season. Single-family housing starts dropped 4.7% month-over-month to 1,004,000, down from 1,054,000 (revised upward). Starts continued year-over-year strength with a 22.0% gain in January. The favorable comparables will continue until May. In a previous Housing Market Review I claimed that year-over-year strength would begin to moderate; November’s year-over-year gain was 42%. December’s was 15.8%.
![US. Bureau of the Census, Privately Owned Housing Starts: 1-Unit Structures [HOUST1F], first retrieved from FRED, Federal Reserve Bank of St. Louis, March 2, 2024](https://drduru.com/onetwentytwo/wp-content/uploads/2024/03/20240302_Housing-Starts-January-2024.png "Housing starts")
Poor builder sentiment never hindered intentions to build in 2023. Building permits in January further supported the current uptrend. The twelfth consecutive monthly increase was a 2.2% gain. For several months, I claimed that the message from building permits was an imminent breakout in starts. That breakout finally unfolded in November just as sentiment bottomed. Thus, I am expecting the breakout in starts to hold despite the small setbacks in December and January.
Every region achieved year-over-year jumps in housing starts. Housing starts surged significantly in the West. The Northeast, Midwest, South, and West each changed +24.6%, +17.3%, +8.4%, and +80.0% respectively year-over-year.
New Residential Sales (Single-Family) – January, 2024
New single-family home sales trended downward for the second half of 2023. I earlier noted that if sales did not rebound in December and January, I would start to worry about an imminent air pocket in the housing market. Right on schedule, December new home sales jumped, and January new home sales held up. January new home sales of 661,00 increased 1.8% from December’s 651,000. December sales were revised downward from 661,000.
![US. Bureau of the Census, New One Family Houses Sold: United States [HSN1F], first retrieved from FRED, Federal Reserve Bank of St. Louis, March 2, 2024.](https://drduru.com/onetwentytwo/wp-content/uploads/2024/03/20240302_New-Home-Sales-January-2024.png "new home sales")
The median price increased 1.8% from December to $420,700, also a decline of 2.6% year-over-year. While the year-over-year changes have likely bottomed, a downtrend from early 2022 remains in place.
In the last Housing Market Review I noted the contrast in 2023 between declining sales and price and all-time highs for the stocks of home builders. I claimed that contrast added to the signs that investors have likely priced in most of the coming good news for the housing market and thus topped out the seasonal trade. That assessment proved premature!
The sequential transition in price mix toward lower price tiers took a big detour in November but mostly resumed in December. In January the change in price mix did not exhibit a particular pattern.
January inventory was 8.3 months of sales, little changed from December’s 8.2 months. Absolute inventory increased slightly from 453,000 to 456,00 or up 0.7%. On a month of sales basis, the new home market remains well supplied given 6 months of sales is considered a balanced market.
In November, the South stuck out as the one region with a year-over-year decline in sales. For December, the Northeast stuck out. In January the split was 50/50 with the West surging (along with housing starts). The Northeast, Midwest, South, and the West changed +4.9%, -4.1%, -13.5%, and +57.0% respectively.
Existing Home Sales – January, 20234
Existing home sales suddenly look like they are bottoming out thanks to an upward revision for December and a fresh rebound in sales for January. The seasonally adjusted annualized sales in January of 4.0M declined just 1.7% year-over-year and increased a healthy 3.1% from December. December’s sales were revised upward from 3.78M. In a prior Housing Market Review, I figured sales would bottom with mortgage rates dropping, and the National Association of Realtors (NAR) concurred. The chart below now shows a clear bottoming process with sales last this high back in August.

(For historical data from 1999 to 2014, click here. For historical data from 2014 to 2018, click here) Source for chart: National Association of Realtors, Existing Home Sales© [EXHOSLUSM495S], retrieved from FRED, Federal Reserve Bank of St. Louis, March 2, 2024

The NAR heralded a change in market dynamics: “While home sales remain sizably lower than a couple of years ago, January’s monthly gain is the start of more supply and demand…Listings were modestly higher, and home buyers are taking advantage of lower mortgage rates compared to late last year.”
The median sales price of an existing home continued its downtrend from last June, but, surprisingly, the NAR chose to focus on a seasonal high: “The median home price reached an all-time high for the month of January.” This observation comes on the heels of the last report where the NAR lamented the potential for accelerating prices to divide the country into “haves and have-nots.” Prices increased 5.1% year-over-year for the 7th straight year-over year gain, so the overall trend is indeed pointing upward.
January’s absolute inventory of 1.01M homes was up 2.0% month-over-month and up 3.1% year-over-year. According to the NAR, “unsold inventory sits at a 3.0-month supply at the current sales pace, down from 3.1 months in December but up from 2.9 months in January 2023.”
The average time on market for an existing home leapt higher by 7 days to 36 days in January. This increase is also significant given January, 2023 featured homes sitting on the market for an average 33 days. So while demand has increased, buyers may be showing a little more patience in the face of slightly higher inventory. The NAR did not provide a specific percentage of homes that sold within a month, but I have to assume it dropped from December’s 56%.
The share of sales to first-time home buyers decreased to 28% in January from 29% in December. The share was 31% a year ago. This share continues to drift up and down with no direction. The NAR’s 2017 Profile of Home Buyers and Sellers reported an average of 34% for 2017, 33% for 2018, 33% for 2019, 31% for 2020, 34% for 2021, 26% for 2022, and 32% for 2023. The first-time buyer share for 2022 was the lowest on record for the NAR. The complete rebound in 2023 surprises me given that difficult inventory, rate, and price conditions are supposed to work against first-time home buyers. So it is interesting to see first-time buyers retreat slightly despite declining prices (sequentially) and increasing inventory.
The West was a surprising exception to the regional year-over-year declines in sales. The regional year-over-year changes were: Northeast -5.9%, Midwest -3.1%, South -1.6%, West +2.8%.
As usual, every region experienced a year-over-year price increase. The regional year-over-year price changes were as follows: Northeast +10.1%, Midwest +7.6%, South +4.1%, West +6.3%.
Single-family existing home sales increased 3.4% from December and declined on a yearly basis by 1.4%. The median price of $383,500 was up 5.0% year-over-year and down 0.6% month-over-month.
California Existing Home Sales – January, 2024
California’s existing home sales surged off a 16-year low and ended a 30-month streak of year-over-year declines. Sales rebounded from December to January, climbing 14.4% month-over-month to 256,160, and marking a 5.9% increase year-over-year from 241,920. The California Association of Realtors (C.A.R.) expects to “see more pent-up demand translate into sales.”
The median home price in January fell to $788,940, representing a 3.8% decrease from December, yet showing a 5.0% increase from $751,700 in January 2023. The median price has increased year-over-year for seven straight months.
Various measures of market tightness showed some changes in favor of buyers. The Unsold Inventory Index (UII) rose month-over-month from 2.5 to 3.2 months in January, though it showed a decrease from 3.5 months year-over-year. The median time to sell a home fell to 32 days from 39 days a year ago but increased from December’s 26 days. The sales-price-to-list-price ratio increased year-over-year from 96.5% to 98.9% but dropped (slightly) for the second month in a row after a 7-month streak of staying flat 100%.
The C.A.R. reported that active listings increased for the first time in 19 months with a year-over-year increase that was last exceeded almost 2 years ago in May, 2022. New active listings at the state level increased from a year ago for the first time in 19 months, and the annual increase was the largest since May 2022. The C.A.R. went on to report that “the jump in new active listings contributed to an improvement in overall active listings, and the sharp drop in rates at the end of 2023 was likely the motivating factor that convinced more homeowners to sell their homes.” However, the active listings as reported through FRED by realtor.com shows a 2-month decline. I do not yet know to reconcile these data (perhaps one number is seasonally adjusted?).
![Housing Inventory: Active Listing Count in California (Source: Realtor.com, Housing Inventory: Active Listing Count in California [ACTLISCOUCA], retrieved from FRED, Federal Reserve Bank of St. Louis, March 2, 2024](https://drduru.com/onetwentytwo/wp-content/uploads/2024/03/20240302_Housing-Inventory-Active-Listing-Count-in-California-January-2024.png)
Home closing thoughts
A Carless, Planned Community: Culdesac Tempe
I first heard about Culdesac Tempe on CNBC. It is a carless, planned community targeting sustainable living patterns. I edited the following summary based on ChatGPT’s review of the website’s content:
Culdesac Tempe is the United States’ first car-free neighborhood built from scratch, located in Tempe, AZ. This innovative community focuses on walkability and sustainable living, offering residents discounts on Lyft rides, free metro rides, car-sharing options, and extensive bike parking facilities. It features over 700 apartments, retail and amenities space, shared courtyards, and emphasizes pedestrian-friendly spaces with zero square feet dedicated to asphalt for parking. Designed as a “5-minute city,” Culdesac Tempe aims to provide convenience, luxury, and a strong sense of community within a walkable layout.
CoHousing
Innovative efforts to create sustainable living communities take on many forms. CoHousing Solutions offers development and marketing consulting for cohousing communities, aiming to create sustainable, collaborative neighborhoods. They define cohousing as follows:
“Cohousing communities are intentional, collaborative neighborhoods that combine extensive common facilities with private homes to create strong and successful housing developments. Most of these communities are organized as townhouse or condominium developments with a homeowners association; a few are organized as cooperatives. Cohousing is not a financial or legal model, but rather a descriptive term that shows the intent of these developments to cultivate a strong sense of community through extensive common facilities and active collaboration of the residents.”
CoHousing Solutions also trains entrepreneurs to build future cohousing projects, emphasizing collaboration and sustainability.
The National Zoning Atlas
In “The mapping tool that’s trying to make zoning laws accessible to all“, Marketplace interviewed Sara Bronin about her National Zoning Atlas that makes sense of the labyrinth of zoning laws that impede development of housing. The atlas consolidates zoning laws from various local governments into a single map, like a “Google map for land use regulation.” Bronin explained how zoning laws contribute to housing shortages by restricting the building of apartments and duplexes in many areas. Initially developed in Connecticut as part of an advocacy movement for affordable housing, the tool has already led to legislative changes in places like Montana, showcasing its potential to inform and drive zoning law reform.
A Small but Growing Attraction to Smaller Homes
Straightening out the biased mess in zoning laws will take time to deliver substantial affordable housing options for Americans. In the meantime, other movements are growing steam. In “the Great Compression” the New York times reports on a trend toward smaller, more affordable homes. The article highlights the economic and demographic shifts driving demand for such homes, including rising housing costs and interest rates. In their earnings reports, home builders frequently talk about their efforts to reduce costs and builder smaller floorplans to meet the budgets of buyers. The Great Compression speaks to the extremes of the response to the affordability challenges. For now, tiny homes are a small fraction of new construction, but they are likely to grow in popularity.
Starter Homes
On a related note, Marketplace discussed the changing landscape for starter homes in “Are we finished with starter homes?” The article featured laments from San Jose, California about the high cost of starter homes and the compromises made in Delaware to find an affordable starter home far away from an urban center. Marketplace points out the impact of rising costs for land, materials, and labor.
On-Going Stagnant Rent Growth
While housing costs remain high at least it appears rents have stopped surging. Stagnant rent growth is a sign that housing’s contribution to sticky inflation will decline over time. In “Apartment Rent Growth Remains Near Stagnant“, RealPage explains how minor year-over-year increases in rent since August, 2023 reflect a balance of strong apartment demand versus a significant rise in apartment supply.
Spotlight on Mortgage Rates
The Mortgage Bankers Association (MBA) reported a weekly decrease in mortgage applications three of the four weeks in February. This stall in momentum coincides with what looks like a (short-term) bottom in mortgage rates. The interest rate on the 30-year fixed mortgage crept higher all month.
New home mortgage purchase applications surged 19.1% year-over-year in January and 38% month-over-month (not seasonally adjusted). The year-over-year increase was the 12th consecutive month of gains. While the sequential surge is not seasonally adjusted, it likely provides direct evidence of the strong tailwinds that come from falling rates. Thus, the spring selling season may test buyer resolve if rates are truly done going down for now.
![Freddie Mac, 30-Year Fixed Rate Mortgage Average in the United States [MORTGAGE30US], retrieved from FRED, Federal Reserve Bank of St. Louis; March 3, 2024.](https://drduru.com/onetwentytwo/wp-content/uploads/2024/03/20240303_30-Year-Fixed-Rate-Mortgage-Average-in-the-United-States.png)
Be careful out there!
Full disclosure: long ITB
Is ITB still a buy now or wait for next trading season?
ITB is going parabolic. Too risky to buy here. I am trying to wait out the next dip!
If a dip doesn’t come in a day or two, I will try a low risk (but low reward) calendar call spread just to make sure I have a new position in place.