

Stock Market Commentary
As new year weakness continues in the stock market, a serious tension has emerged in the message of the market between profit-taking versus a sustained top. An extended overbought period raises the stakes for the resolution of this tension. As long as the stock market remains overbought, I will assume the current selling is a garden variety pullback that is delivering a much-needed cooling period…and select buying opportunities. However, once the overbought period ends, buyers will need to step in with force to prevent bearish trading conditions from completing a takeover of the trading action.
The Stock Market Indices
The S&P 500 (SPY) ended a 4-day slide with a feeble 0.2% gain on Friday. The index faded from its highs in a move that held out the 20-day moving average (DMA) (the dashed line) as resistance. On the other hand, the S&P 500 is clinging to presumed support from the last low in December where I called a third strike against the rally. As a result, if buyers do not start the coming week on a strong note, the S&P 500 looks set up to finish reversing its December breakout at the same time it hits the lower Bollinger Band (BB) (the curving, solid black line). I have an SPY $475 monthly calendar call spread hanging in the balance.
")
The NASDAQ (COMPQ) has already reversed its December breakout. The tech laden index ended a 5-day slide with a meager 0.1% gain. Unless buyers start the coming week strong, the NASDAQ looks set up to test its 50DMA (the red line) in short order.
")
The iShares Russell 2000 ETF (IWM) is back in a bear market. This drop is the biggest setback of the short year so far. The ETF of small caps is on a 6-day slide. This weakness alone puts the overbought period in peril. The selling pressure looks strong enough to push IWM into a test of 50DMA support which would also reverse the big surge in mid-December. That surge challenged resistance at the time from the bear market line. I have the long side of a calendar call spread hanging in the wobbly balance (weekly IWM $199 call).
")
The Short-Term Trading Call As Weakness Continues
- AT50 (MMFI) = 76.4% of stocks are trading above their respective 50-day moving averages (24th overbought day)
- AT200 (MMTH) = 62.2% of stocks are trading above their respective 200-day moving averages
- Short-term Trading Call: neutral
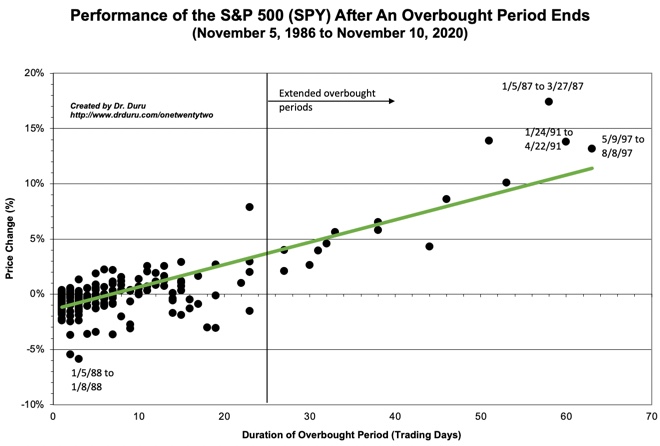
AT50 (MMFI), the percentage of stocks trading above their respective 50DMAs, closed at 76.4% for a 24th straight day in overbought territory. This extended overbought rally crossed a crucial juncture. At the same time weakness continues, the historical record suggests that this overbought period will end with the S&P registering a gain for the period. The S&P 500 is currently up 2.2% since flipping overbought on December 1st. If the overbought period ended right now, the index would slightly underperform expectations (the green line in the chart below). Thus, a further decline from here would cause even more underperformance. One potential scenario consistent with history is a wider performance divergence between the S&P 500 (flat or up) and IWM (down). [AT200 (MMTH), the percentage of stocks trading above their respective 200DMAs, continues to support the bullish case although this indicator of longer-term market breadth is off its primary uptrend].
My short-term trading call remains at neutral as I see both bearish and bullish signals in this extended overbought rally. Last week I took note of potential bottoms in select downtrends. Thanks to swingtradebot, I surfaced potentially bottoming “dojis.”
Cybersecurity software company Qualys, Inc (QLYS) typifies the losers for 2024. Selling that began at the end of last year became relentless this year. QLYS closed the week 12.4% below its all-time high and slightly below 50DMA support. If sellers press the issue for a confirmed 50DMA breakdown, the next “natural” support sits at the top of the stock’s first day post-earnings surge on November 3rd (look at the first “E” from starting from the left of the horizontal axis).
")
Adobe Inc (ADBE) has already suffered a confirmed 50DMA breakdown. A 6.4% post-earnings loss last month started the current bout of weakness. ADBE ended the week right at the top of last year’s double all-time high. If buyers fail to step up here, ADBE is set up to test the bottom of the last trading range around $500. I bought a weekly $560/$545 put spread in case a further slide is in store for ADBE in the coming week.
")
Amazon.com (AMZN) is trying to hold the line against on-going weakness at its 50DMA support. AMZN also happened to close right at last year’s former high from September. If buyers fail to step up, AMZN could fall a LOT further. Thus, the technicals here will be a key tell and critical to watch!
")
Royal Caribbean Cruises Ltd (RCL) startled me at the end of last year by almost reaching its all-time high. RCL started 2024 with a huge drawdown of 7.2% that appeared to engrave a lasting top in the stock. However, buyers stepped into RCL the last two days before the stock tested any natural lines of support. This outperformance surprised me. A reversal of the year’s first day loss would be a very bullish event for RCL and the consumer discretionary space in general.
")
A friend convinced me to speculate in biotech stock Esperion Therapeutics, Inc (ESPR). I liked the technical and fundamental setup. On the technical side, ESPR made a clean breakout on December 14th after key drug news: “U.S. FDA Updates LDL-C Lowering Indication for Esperion’s NEXLETOL® (bempedoic acid) Tablet and NEXLIZET® (bempedoic acid and ezetimibe) Tablet.” The stock was able to ride the general market’s speculative flurry to just keep running higher.
Almost prophetically, I told my friend at the end of last year that my trader intuition was telling me to take profits. I suppressed the urge because an enduring fundamental play was the presumed positive resolution to a $300M dispute with partner Daiichi Sankyo Europe. Abruptly, the companies settled on a $125M payment, and ESPR promptly sold on the news. The 21.2% plunge took me right back to my starting point. Fortunately, the technicals emerged once again with buyers defending 20DMA support. I added to shares on Friday’s post-news high; the move looks like it is confirming a recovery from an overdone sell-off. ESPR now looks set up again to resume its recovery from last March’s 54.2% collapse as, hopefully, good news returns to the company. Stay tuned!
")
British fintech company Endava plc (DAVA) was not immune from the selling in the U.S. Yet DAVA ended Friday with a promising defense of uptrending 20DMA support. I bought shares assuming the rally is ready to resume. Like so many software companies of its ilk, DAVA is down significantly from its manic pandemic highs. DAVA printed an ominous double-top across November and December 2021 above $170.
")
")
")
Be careful out there!
Footnotes
Subscribe for free to get email notifications of future posts!
“Above the 50” (AT50) uses the percentage of stocks trading above their respective 50-day moving averages (DMAs) to measure breadth in the stock market. Breadth defines the distribution of participation in a rally or sell-off. As a result, AT50 identifies extremes in market sentiment that are likely to reverse. Above the 50 is my alternative name for “MMFI” which is a symbol TradingView.com and other chart vendors use for this breadth indicator. Learn more about AT50 on my Market Breadth Resource Page. AT200, or MMTH, measures the percentage of stocks trading above their respective 200DMAs.
Active AT50 (MMFI) periods: Day #41 over 20%, Day #39 over 30%, Day #37 over 40%, Day #36 over 50%, Day #33 over 60%, Day #23 over 70% (24th day overbought)
Source for charts unless otherwise noted: TradingView.com
Full disclosure: long ADBE put spread, long ESPR, long IWM call, long SPY calendar call spread
FOLLOW Dr. Duru’s commentary on financial markets via StockTwits, Twitter, and even Instagram!
*Charting notes: Stock prices are not adjusted for dividends. Candlestick charts use hollow bodies: open candles indicate a close higher than the open, filled candles indicate an open higher than the close.
Awesome scatter plot. Great work!
Thanks! And thanks for reading.
Dr. Duru – it’s really great to have discovered this blog and someone who finds technical analysis as well as market analysis as exciting as I have. Thanks for sharing all of what you do, and I’m very curious to see future post and/or your thoughts on the XOP/XLE spaces respectively and possibly your view of their potential performance this year.
Thanks for reading, Shrief!
From a technical standpoint, I would not buy either XOP or XLE until they crossed above the 50DMA. However, the trading ranges are even more salient for both XOP and XLE. So you have two main choices, buy at or near the bottom of the trading range and get out with a (small) loss if the selling continues, or wait until a breakout to buy above the range. Everything else in between is essentially 50/50. From a fundamental standpoint, I keep hearing (on CNBC Fast Money) that the oil companies have extremely strong balance sheets. So, a long-term investors should feel comfortable buying and waiting it. Personally, the dividend yields on XLE and XOP aren’t quite big enough to make it worth my time to sit and wait out the churn for however long it will take to get the trading ranges resolved.
I have no forward predictions in this space (I generally try not to make predictions. I strongly prefer to lay out conditions for buying and selling. I have to get a STRONG conviction before I even dare to whisper a prediction!).
I hope that helps!
It helped most definitely, and had I not goofed and been a bit more definitive in my inquiry to your thoughts about a BEARISH position due to that BIG bearish engulfing candle we got last week, that probably would have helped! LOL
I paper traded the XOP to the downside when it ran up to the 50dma back in 1st week of NOV (*say you look at weekly charts without saying you look at weekly charts hahaha) and got out on the 1st positive day off the bounce of the 200dma. So having that “trial” version of the put spread and seeing how well it behaved, I set an alert for a close at/near $139-$140, which happened a few days after Christmas, which just so happened to be at ABOUT the 50dma and BOOM: next day confirmed close below JUST LIKE IT did back in early NOV.
I have been focusing on trying to remain disciplined so I took profit when it got back to the 50 2nd day of trading of the year, but then THE NEXT DAY, massive bearish engulfing… that was why I was interested in hearing your thoughts on its BEARISH-ness? Do you see continued downside given all the news? Would you consider (if you were bearish) support to be at/around $130 (given you had a 1-3 month outlook)?
Great work!
Given the trading range, it is hard for me to be bullish or bearish. Right now, the trend is down, but XOP is testing the December low. I am guessing a lot of technical traders are getting ready to buy at that point and will have increasing tensions in the Middle East as a an excuse to buy. But if that support breaks, then XOP becomes VERY bearish to me with the next stop looking like $122 or so (following the downtrend line.
Hi Shrief – I am curious what you decided to do about XLE. The breakout is here!