

Stock Market Commentary
Signature stock market moments capped a remarkable year for the stock market. Two months of nearly relentless buying delivered a stunning 70% of the gains for the S&P 500 in 2023 after bulls exploded out of oversold trading conditions. Housing-related stocks soared even more as financial markets celebrate the presumed end of the Federal Reserve’s war on inflation. Every strike against the rally was followed by a swift return of buyers. The frenzy reached such a feverish pitch that parabolic moves percolated and boiled over. I now see two markets vying to win over investor and trader sentiment. The tension could very well produce a second remarkable year with plenty of twists and turns.
(Reminder! The One-Twenty Two Holiday Contest and Giveaway ends January 7th!)
The Stock Market Indices
The S&P 500 (SPY) looked set for an all-time high but tantalizingly stopped short of the celebratory milestone. An all-time high would have perfectly wrapped up the theme of a remarkable year. Instead, we are left with the tension of an index whose recovery from the third strike against the rally suddenly looks tenuous. The uptrending 20-day moving average (DMA) (the dotted line) is practically begging for a test after a relentless 2-month rally. The S&P 500 gained 24.2% in 2023 and closed the year right on top of the former high set on December 19th.
")
The NASDAQ (COMPQ) also closed the year right on top of its previous high. Also like the S&P 500, 20DMA support is beckoning for a retest after the tech laden index accelerated away from support at the beginning of December. The NASDAQ gained an eye-popping 43.4% for the year, but it is still about 1000 points away from its all-time high.
")
The iShares Russell 2000 ETF (IWM) ended the year with a more decisive pullback. The 1.6% decline on Friday took IWM back to its previous high (amazing synchronicity with the other major indices!) and left IWM below its August, 2022 high. The pullback left IWM with an underperforming 15.2% gain for 2023. The current trip above the bear market line looks promising. The 11 straight trading days above the bear market line is the second longest since IWM confirmed its bear market back in April, 2022. The longest stretch was 13 straight days in July. IWM remains above the highs set during July.
")
The Short-Term Trading Call With A Remarkable Year
- AT50 (MMFI) = 84.6% of stocks are trading above their respective 50-day moving averages (20th overbought day)
- AT200 (MMTH) = 65.8% of stocks are trading above their respective 200-day moving averages
- Short-term Trading Call: neutral
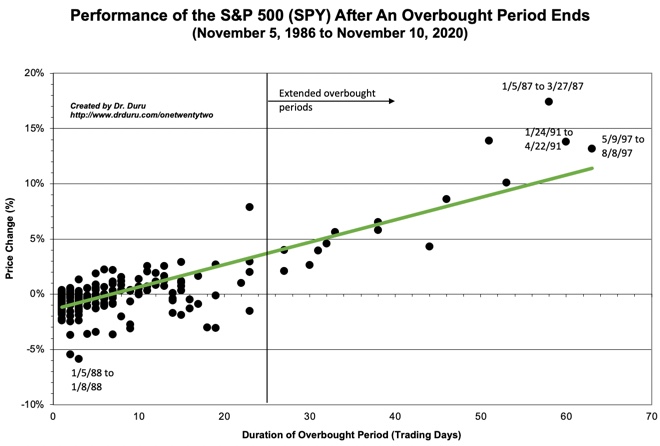
AT50 (MMFI), the percentage of stocks trading above their respective 50DMAs, closed at 84.6% for a 20th straight day in overbought territory. This extended overbought rally is at a crucial juncture. Starting now, the chart below shows the strong tendency for the S&P 500 to exit the overbought period with a positive performance. The S&P 500 is currently up 3.8% since flipping overbought on December 1st. If the overbought period ended right now, the chart below tells me to expect around a 3% S&P 500 performance. After 20 days in duration, only one overbought period in the available history delivered a negative return for the S&P 500. Thus, the risk/reward for traders chasing the market looks better and better the more extended the overbought period gets. This counter-intuitive dynamic is what can frustrate bears who want to automatically attack overbought conditions.
I now see two fascinating tensions in the wake of the remarkable year that was 2023.
The dominant theme right now is what I am calling the “Cathie Wood Market” (hat tip to my youngest brother). In this market, speculation and risk-taking earn outsized rewards. Over the last two months, especially in December, the frenetic trading action felt like a herd trying to play catch-up after being too skeptical for too long about the stock market. The universe of beaten-up, speculative stocks, the universe that fills up so much of the ARK Invest funds, is fertile ground given the potential upside of going from trash to just bad.
The theme looming over the Cathie Wood Market is what I am calling the “Be Ready So You Don’t Have to Get Ready Market.” The bears gave us a litany of complaints last year, and they ended the year about as wrong as can be. The most enduring error will be the “most anticipated recession” in history, a recession that never even came close to materializing in 2023. The collapse of regional banks last March was as close as the bears got to dancing on the grave of the economy. Yet that episode simply washed out the motivated sellers and set up a remarkable oversold buying opportunity. The Panic of 2023 quickly transformed into the speed bump of 2023.
This debacle for the bears presents another lesson in the difficulty of forecasting and the frequent futility in trading and investing based on economic forecasts. The market itself so often tells us everything we need to know, especially when it comes to trading around the extremes of the cycles in market breadth.
Having said all that, overbought conditions are not a time to get comfortable with the stock market, even during an impressive extended overbought rally. This year should deliver unanticipated surprises whether they come from the lag effects of monetary tightening, global conflicts, tense U.S. politics, or something else unimaginable right now. Thus times like these with elevated prices and extremely low volatility (the VIX is at 12.4 and right around pre-pandemic lows) provide discounts on insurance and protection. I am ready with small short-term long positions and periodic put options. I will also be ready to go after parabolic run-ups and apparent blow-off tops.
The charts below present examples of the tensions of the two markets tugging at each other. They form narratives born out of a remarkable market.
The ARK Innovation ETF (ARKK) found a low last year at its pandemic low. This low collapsed as support at the end of 2022. The support held beautifully in May. The support looked imperiled at the end of October. Speculative fever officially launched with ARKK gapping up 8.4% away from support. The frenzy was confirmed with ARKK gapping up 5.1% away from the 50DMA (the red line) support formerly resistance. ARKK finally made a new high for the year in mid-December. Even after the current 49.3% 2-month move, ARKK is still 15%+ away just from its pre-pandemic high and sits at less than a third of its all-time high. So the Cathie Wood Market offers plenty of aspirations for upside as long as speculative fever persists.
ARKK is my core trade for keeping a stake in the Cathie Wood Market. I returned to my previous covered call strategy ARKK: buying shares, selling calls, and allowing the position to get called away any given week. This strategy works for me especially well during overbought conditions. I plan to add to the position on dips to support, especially the uptrending 50DMA.
")
The Be Ready (So You Don’t Have to Get Ready) Market was in full display with crypto mining stocks. The Valkyrie Bitcoin Miners ETF (WGMI) went parabolic even as Bitcoin (BTC/USD) stabilized through much of December. The divergence was glaring. The parabolic move reached its extreme with WGMI extending well above its upper Bollinger Band (BB) on a 12.4% surge. Parabolic moves are ALWAYS dangerous, and their (inevitable) end can leave a lot of damage in their wake.
The yellow flag went up on WGMI with a gap down of 5.4% to the upper-BB. I bought a put spread on top component Marathon Digital Holdings, Inc (MARA). MARA plunged 16.4% on Friday along with a 14.2% loss for WGMI. I took profits given the extreme and swift nature of the selling. Be ready so you don’t have to get ready… (Note how the pattern of failure after WGMI made parabolic moves in April and especially in July).
")
Coinbase Global, Inc (COIN) has more than doubled since its last earnings report. Anticipation of a Bitcoin ETF is surprisingly helping to send COIN higher; an ETF would allow investors to participate in crypto without using a crypto broker. COIN’s rally has not (yet?) gone parabolic, but the run-up makes COIN a perfect option for hedging against bullishness. I sold a call spread short on Friday even though trend-following programs are apparently jumping on every downtick in COIN. (At the time of writing, Bitcoin is breaking out to new highs so COIN will likely turn right around to start the year. I sold my latest BTC/USD).
")
I called Beyond Meat, Inc (BYND) the speculative trade for 2024. BYND looked good the first half of December but failed the last two weeks of the year. Thus, my hypothesis does not look so strong given the underperformance relative to the Cathie Wood Market. Still, the BYND trade remains in play for now, so I will just see whether BYND can get back on track.
")
Intel Corporation (INTC) is one of my big misses for 2023. While I still love buying call options on INTC after earnings, the winning move was just to load up on shares with every dip during the year. INTC almost doubled in 2023 and maintained an uptrending 50DMA along the way. The stock ended the year with a small parabolic move, so I am looking for an imminent dip to the 20DMA for the next opportunity to participate. While INTC is definitely not a participant in the Cathie Wood Market, it IS an example of a “safer” alternative that can run up in parallel. A LOT of ETFs own a piece of INTC.
")
")
")
Be careful out there!
Footnotes
Subscribe for free to get email notifications of future posts!
“Above the 50” (AT50) uses the percentage of stocks trading above their respective 50-day moving averages (DMAs) to measure breadth in the stock market. Breadth defines the distribution of participation in a rally or sell-off. As a result, AT50 identifies extremes in market sentiment that are likely to reverse. Above the 50 is my alternative name for “MMFI” which is a symbol TradingView.com and other chart vendors use for this breadth indicator. Learn more about AT50 on my Market Breadth Resource Page. AT200, or MMTH, measures the percentage of stocks trading above their respective 200DMAs.
Active AT50 (MMFI) periods: Day #37 over 20%, Day #35 over 30%, Day #33 over 40%, Day #32 over 50%, Day #29 over 60%, Day #20 over 70% (20th day overbought)
Source for charts unless otherwise noted: TradingView.com
Full disclosure: long ARKK, long BYND, short COIN call spread
FOLLOW Dr. Duru’s commentary on financial markets via StockTwits, Twitter, and even Instagram!
*Charting notes: Stock prices are not adjusted for dividends. Candlestick charts use hollow bodies: open candles indicate a close higher than the open, filled candles indicate an open higher than the close.