

Housing Market Intro and Summary
Of all the November housing data, housing starts provided the clearest support for the sharp rebound in the stocks of home builders the last two months. In parallel, builder sentiment has likely bottomed in anticipation of the positive impact of falling mortgage rates. On the other hand, existing home sales are not yet showing a direct response to falling mortgage rates as market dynamics still rest on a supply response; the winter is a seasonally slow time for listings from existing home owners. New home sales took a surprising plunge which could be the calm before a sales flurry in the new year. In the last Housing Market Review, I claimed that forward-looking prospects look much better than the backward view. That observation remains the case but now the question is whether the stock market has already priced in all the good news to come for the spring selling season.
Housing Stocks
The year 2023 ended with an exclamation point for housing-related stocks and the seasonal strength for these stocks. The iShares US Home Construction ETF (ITB) achieved an all-time high with an eye-popping 17.1% gain in December and an 18.2% gain in November. The combined 38.3% gain over these two months far outpaces the S&P 500 (SPY) and its 13.7% gain over the same period. This divergence is so extreme (and surprising), I decided to close out all my trades on this period of seasonal strength. Given the industry’s go-forward tailwinds, I will look to buy dips for the remainder of this period of seasonal strength.
")
In the last Housing Market Review I pointed out how Zillow Group, Inc (ZG) looked like it turned the corner. December’s run-up confirmed the observation! ZG gained an additional 36.2% from there which in turn translated into a 21-month high. ZG remains a sliver of its heights during the pandemic housing mania, but the company and stock finally look bottomed out. Lower mortgage rates should support this turn.
")
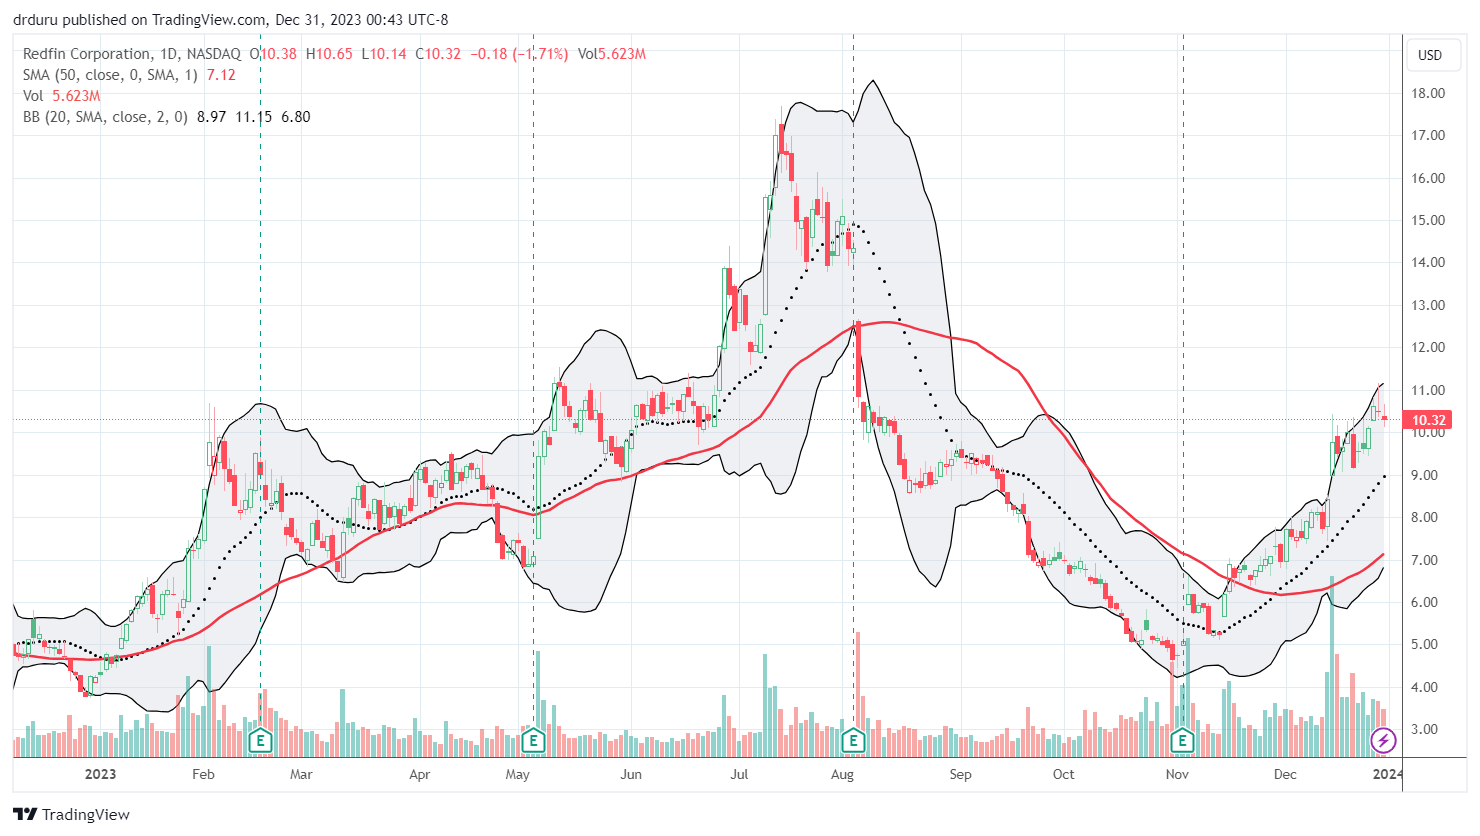
I think of Zillow and Redfin Corporation (RDFN) as direct competitors. However, the two companies formed a listings partnership in August that raises the prospects of the two companies merging one day in the future. The National Association of Home Builders (NAHB) observed that this partnership makes new home listings available to a larger audience. The news did not help either ZG or RDFN at the time as both stocks continued a sell-off that only ended in late October.
Given the current outperformance for new home sales over existing home sales, this deal has the look of a necessity for Redfin and a bonus for Zillow. Zillow is in a stronger financial position than Redfin with the relative performance of the stocks reflecting the difference in fortunes. For example, Redfin had to secure $250M in financing from Apollo Capital Management. The news helped to propel RDFN higher by 5.0% on the next day (October 24th), but sellers quickly reversed those gains on the way to the October low. In other words, investors concluded the financing will have little material impact on Redfin’s prospects. Thus, ZG looks like a much better stock than RDFN.
Housing Data
Home Builder Confidence: The Housing Market Index – December, 2023
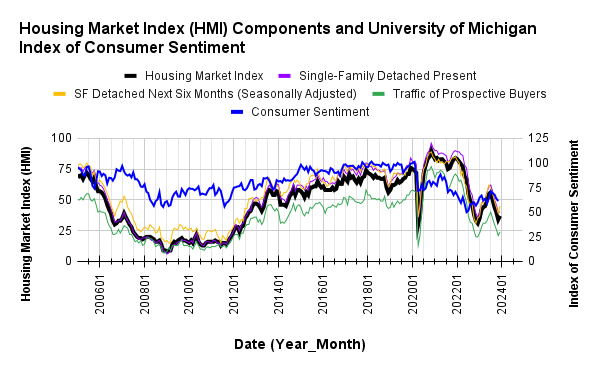
In June, the National Association of Home Builders (NAHB)/Wells Fargo Housing Market Index (HMI) entered positive sentiment territory (over 50) for the first time in almost a year. The HMI reached a 13-month high in July. With a peak in mortgage rates likely in place, November should mark the low for sentiment. The HMI increased 3 points to 37 in December. Likely a portent of a bottom in sentiment, the HMI component measuring future sales expectations, SF Detached Next Six Months (Seasonally Adjusted), increased six points.
The NAHB continues to report pressure on builders to reduce prices to address affordability issues. The 36% share of builders cutting prices is flat with November’s share which in turn was a level last seen in November of last year. The average price discount stayed flat at 6% for the third straight month. The share of builders providing incentives stayed flat at 60%, down from the 62% in October which tied the cycle high set last December.
/Wells Fargo Housing Market Index (HMI) and the University of Michigan Index of Consumer Sentiment")
Source for data: NAHB and the University of Michigan
Note how the HMI peaked along with the recent peak in consumer sentiment.
The jump in SF Detached Next Six Months (Seasonally Adjusted) was a major driver of the increase in HMI.
Every region except the West experienced an increase in its HMI. So while each region is off its lows for the year and cycle, the West remains stuck at the lows. I will be closely watching sentiment in the West for the next report.
New Residential Construction (Single-Family Housing Starts) – November, 2023
Single-family housing starts broke out alongside the likely bottom in builder sentiment. In my previous Housing Market Review, I noted the oddity of the divergence between sentiment and starts. I offered a hypothesis that the largest builders are not nearly as pessimistic as the smaller builders. The NAHB also took note in its December HMI report. However, the discussion surprised, even confused, me. The NAHB suggested that the inventory of new homes is constrained. Yet, supply is at 9.2 months of sales (see the next section), well above the 6 that is considered a balanced market. Emphasis mine:
“It is worth noting that single-family builder sentiment has separated somewhat from recent starts/permits data. Our statistical analysis indicates that temporary and outsized differences between builder sentiment and starts occur after short-term interest rates rise dramatically, increasing the cost of land development and builder loans used by private builders. In turn, higher financing costs for home builders and land developers add another headwind for housing supply in a market low on resale inventory. While the Federal Reserve is fighting inflation, state and local policymakers could also help by reducing the regulatory burdens on the cost of land development and home building, thereby allowing more attainable housing supply to the market. Looking forward, as rates moderate, this temporary difference between sentiment and construction activity will decline.“
First of all, the Fed is technically done fighting inflation. Secondly, rate moderation will bring sentiment up, but it will likely have little impact on starts or supply given the high amount of activity already going on relative to post financial crisis trends.
Housing starts soared 18.0% month-over-month to 1,143,000, up from 970,000 (revised upward). Starts continued year-over-year strength with a whopping 42.2% gain in November. Given starts bottomed last year in November, the year-over-year strength should moderate going forward.
![US. Bureau of the Census, Privately Owned Housing Starts: 1-Unit Structures [HOUST1F], first retrieved from FRED, Federal Reserve Bank of St. Louis, December 28, 2023](https://drduru.com/onetwentytwo/wp-content/uploads/2023/12/20231228_Housing-Starts.png "Housing starts")
Poor builder sentiment never hindered intentions to build in 2023. Building permits in November generated a tenth consecutive monthly increase with a 0.8% gain. For several months, I insisted that the message from building permits was an imminent breakout in starts. That breakout finally unfolded in November just as sentiment bottomed, also consistent with my expectations.
Every region experienced a year-over-year surge in housing starts. Housing starts in the Northeast, Midwest, South, and West each changed +33.9%, +83.2%, +35.7%, +40.5% respectively year-over-year.
New Residential Sales (Single-Family) – November, 2023
New home sales were rangebound from April to October. However, these sales hit new lows for the year in November. If not for the peak in mortgage rates, I would worry that these sales would continue to decline into the spring selling season and cause a tremendous glut in supply. So, if sales do not rebound in December and January, I will start to worry about an imminent air pocket in the housing market.
The 590,000 new homes sold in November delivered a 12.2% month-over-month decline and a 1.4% year-over-year jump. October sales were revised downward from 679,000 to 672,000.
![US. Bureau of the Census, New One Family Houses Sold: United States [HSN1F], first retrieved from FRED, Federal Reserve Bank of St. Louis, December 28, 2023.](https://drduru.com/onetwentytwo/wp-content/uploads/2023/12/20231228_New-Home-Sales.png "new home sales")
The median price increased 4.8% from October to $434,700, also a 6.0% year-over-year decrease. The year-over-year changes may have bottomed out given October’s record-setting 16.4% year-over-year plunge (revised).
The transition in price mix toward lower price tiers took a big detour in November. The two price tiers from $400,000 to $749,999 gained significant share at the expense of adjacent tiers. A similar detour occurred year-over-year with the $200,000 to $299,999 tier also gaining significant share. I cannot explain this one month shift, so I will look to see whether the previous pattern resumes or not.
The inventory for new homes rebounded from 6.9 months of sales in September to 7.8 months in October where it stood in August (these are unrevised numbers). The November plunge in sales sent inventory soaring to 9.2 months of sales. Absolute inventory increased from 439,000 to 451,00 or up 2.7%. Assuming sales will pick up again in the coming months, absolute and relative inventories should come back down.
In November, the South stuck out as the one region with a year-over-year decline in sales (in October, every region achieved a year-over-year jump in sales). The Northeast, Midwest, South, and the West changed +13.8%, +52.2%, -8.4%, and +7.9% respectively.
Existing Home Sales – November, 2023
The November housing market created a sharp convergence with plunging new home sales and a slight increase in existing home sales. Given the the on-going gap in inventory, this convergence should be a 1-month event. However, I will be watching for signs of a sustained pivot.
Existing home sales are still in a downtrend from February’s peak, but a 5 consecutive month decline ended with a 0.8% month-over-month increase in November. The seasonally adjusted annualized sales in November of 3.82M declined 7.3% year-over-year. October’s sales were unrevised from 3.79M. With mortgage rates dropping, existing home sales should finally find a bottom around these levels last seen in the wake of the Great Financial Crisis (GFC) in 2010. The National Association of Realtors expressed similar sentiments: “The latest weakness in existing home sales still reflects the buyer bidding process in most of October when mortgage rates were at a two-decade high before the actual closings in November…A marked turn can be expected as mortgage rates have plunged in recent weeks.”

(For historical data from 1999 to 2014, click here. For historical data from 2014 to 2018, click here) Source for chart: National Association of Realtors, Existing Home Sales© [EXHOSLUSM495S], retrieved from FRED, Federal Reserve Bank of St. Louis, December 28, 2023

The median sales price of an existing home last peaked in June. The 1.0% month-over-month price drop in November resumed an on-going descent. Falling mortgage rates may bring an end to the downtrend. Prices increased 4.0% year-over-year for the 5th straight year-over year gain, so the overall trend remains upward. The NAR even lamented “Home prices keep marching higher….Only a dramatic rise in supply will dampen price appreciation.”
October’s absolute inventory of 1.13M homes decreased 1.7% month-over-month but increased 0.9% year-over-year. According to the NAR, “unsold inventory sits at a 3.5-month supply at the current sales pace, down from 3.6 months in October but up from 3.3 months in November 2022.”
The average time on market for an existing home increased by another 2 days to 23 days in November. The 62% of homes that sold within a month is down from the 66% in October. Demand pressures continue to decline, likely due to seasonal factors.
The share of sales to first-time home buyers increased to 31% in November from October’s 28%. The share was also 28% a year ago. This share drifts up and down with no direction. The NAR’s 2017 Profile of Home Buyers and Sellers reported an average of 34% for 2017, 33% for 2018, 33% for 2019, 31% for 2020, 34% for 2021, 26% for 2022, and 32% for 2023. The first-time buyer share for 2022 was the lowest on record for the NAR. The complete rebound in 2023 surprises me given that difficult inventory, rate, and price conditions are supposed to work against first-time home buyers.
As has been the pattern for most of the year, all regions declined significantly in sales year-over-year. The regional year-over-year changes were: Northeast -15.8%, Midwest -8.7%, South -4.3%, West -8.6%.
As usual, every region experienced a year-over-year price increase. The West was the first region to flip negative in January, but the region was flat for July and now up since August. The regional year-over-year price changes were as follows: Northeast +4.8%, Midwest +4.9%, South +3.4%, West +5.3%.
Single-family existing home sales increased 0.9% from October and declined on a yearly basis by 7.3%. The median price of $392,100 was up 3.5% year-over-year and down 1.0% month-over-month.
California Existing Home Sales – November, 2023
While existing home sales nationwide achieved a feeble bounce off major lows, California’s existing home sales continued to plunge. The California Association of Realtors (C.A.R.) blamed mortgage costs just one month after sprinkling rate optimism in its commentary.
Sales of existing single-family homes in California dropped 7.4% from October to November and declined 5.8% year-over-year to 223,940. This 29th straight year-over-year decline took sales to a 14-year low. November’s median home price decreased 2.2% from October but held above $800,000 for the eighth month in a row. The median price is up 6.2% year-over-year, the largest such gain in 18 months despite the continued decline in sales. The C.A.R. explained that “while sales have been weak for the past several months, a tight supply of homes for sale is keeping home prices from falling.” Prices increased 8.5% year-over-year on a square foot basis.
The Unsold Inventory Index (UII) increased from 2.7 in October to 3.0 in November and fell 6.3% year-over-year. Active listings are on an 8-month losing streak based on year-over-year declines, but they have also increased sequentially for the last 8 months. November’s UUI rise was the smallest since the streak began and of course could be a seasonal effect. Note the distinctly different patterns between pre and post-pandemic active listings.
![Housing Inventory: Active Listing Count in California (Source: Realtor.com, Housing Inventory: Active Listing Count in California [ACTLISCOUCA], retrieved from FRED, Federal Reserve Bank of St. Louis, December 30, 2023.)](https://drduru.com/onetwentytwo/wp-content/uploads/2023/12/20231230_California-Active-Listings.png)
Despite the sales decline, the market of existing buyers and sellers remains relatively competitive in California. The average time to sell a home increased from 20 days in October to 21 days in November. This duration is still substantially shorter than the 29 days a year ago. The statewide sales-price-to-list-price ratio stayed flat for the seventh month in a row at 100.0%. A year ago, the ratio was 96.7%.
Home closing thoughts
Most Popular Housing Stories of 2023 from the Joint Center for Housing Studies of Harvard University
It is that time of year: reflections, summaries, the best and the most popular. The Joint Center for Housing Studies of Harvard University posted its top 10 blogs of 2023 with topics ranging from “investor activity in rental markets, the cost benefits of manufactured housing, the dwindling supply of low-cost rentals, and more…”
More Apartments Equals More Rental Affordability
RealPage Analytics quantified the impact that increased apartment supply can have on affordability. Cities “building the largest numbers of new apartments” are seeing falling rents, while cities “adding little-to-no-supply” are seeing rising rents. RealPage quantified the effect in submarkets:
“Submarkets that expanded their apartment stock by 3-5% saw rents hold flat over the last year. Submarkets expanding by 5-10% saw rents fall 2%. And submarkets expanding by more than 10% notched rent cuts of 3%. By comparison, submarkets that added little or no new apartments saw rents grow about 2%.”
Spotlight on Mortgage Rates
The Mortgage Bankers Association (MBA) reported a weekly increase in mortgage applications two of the first three weeks of December. The plunge in mortgage rates from the peak in late October is providing a tailwind for mortgage applications. November logged yet another year-over-year surge in mortgage applications for new homes. Mortgage rates were last at current levels around 6 months ago.
![Freddie Mac, 30-Year Fixed Rate Mortgage Average in the United States [MORTGAGE30US], retrieved from FRED, Federal Reserve Bank of St. Louis; https://fred.stlouisfed.org/series/MORTGAGE30US, December 31, 2023.](https://drduru.com/onetwentytwo/wp-content/uploads/2023/12/20231230_30-Year-Fixed-Rate-Mortgage-Average-in-the-United-States.png)
Be careful out there!
Full disclosure: long ITB