

Stock Market Commentary:
Last week was a bullish week for the stock market. Key breakouts on the major indices made a bullish case for stocks as buying strength conjured up overbought trading conditions. Yet another post-CPI celebration sealed the deal on a bullish convergence leading into the report on inflation. While it is tempting to scoff at the trading action as yet another bear rally, the technicals say otherwise. Sure, the earnings season may yet hold enough bad news to bring the celebration to an end, but I suspect only surprisingly harsh hawkish Fedspeak could be shocking enough to undermine the market’s renewed optimism.
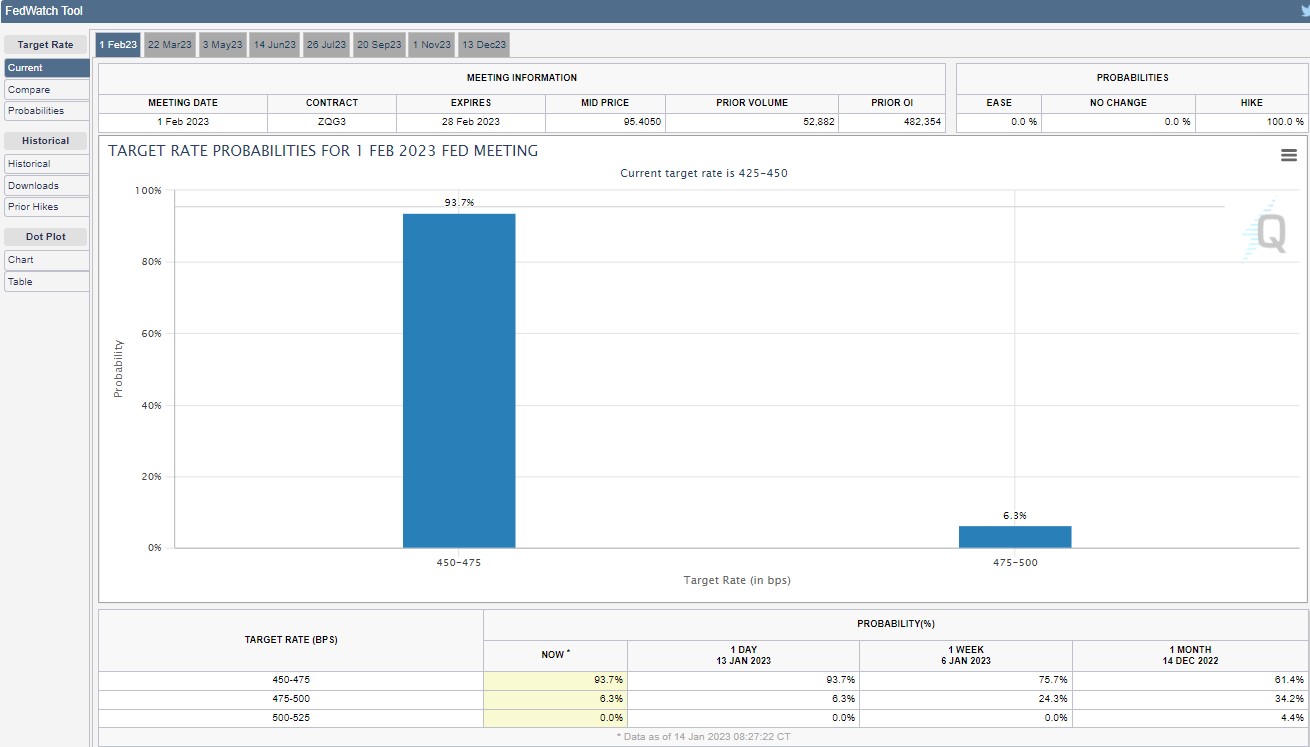
The next Federal Reserve’s release on monetary policy comes February 1st. Financial markets are expecting the Fed to carry through on its promise to ease up on monetary tightening with a 25 basis point hike. I could see Powell couching the hike with stern reminders of hawkish intent if the stock market ascends into full bull mode going into the February 1st release.
The following words from Federal Reserve Governor Michelle W. Bowman on January 10th remind me that the Fed will likely continue to reiterate its caution about repeating the mistakes of the past.
“From the late 1960s through the mid-1980s, the U.S. economy experienced high inflation, high unemployment, and declining living standards. During that time, policymakers prematurely eased monetary policy when the economy weakened, and inflation remained high. The FOMC was forced to return to tightening monetary policy, causing a deep recession in 1981 and 1982. This is an important lesson that guides my thinking about monetary policy and my continued support for policy actions that will continue to lower inflation.”
In other words, the Fed is not going to cut rates the minute the labor market shows some weakness. This century, markets have become accustomed to a Fed eager to rush to the rescue at a moment’s notice. Bowman’s positive observations about the economy suggest the Fed assumes it has plenty of room and time before it has to reverse course on its hawkishness.
“While the path ahead looks uncertain, I am encouraged by three specific developments. The first is the ongoing strength of the labor market, which was further supported with last Friday’s jobs report. So far, the job market has remained resilient despite higher interest rates and slower growth. The second development is that the balance sheets of households have remained strong, with low debt levels. Low debt and strong balance sheets together with the strong labor market mean that consumers and businesses can continue to spend even as economic growth slows. The third point is the strength of the U.S. banking system, with high levels of capital and liquidity, due in large part to the reforms adopted after the last financial crisis.”
The Stock Market Indices
The S&P 500 (SPY) struggled with its 200-day moving average (DMA) (the blue line below) in the wake of the December CPI report. The index first gapped into resistance, faded into negative territory, and closed right under resistance. Friday’s 0.4% gain and close above resistance settled the uncertainty. The S&P 500 next faces the challenge of confirming the 200DMA breakout and then major resistance from the May, 2021 low. The last two 200DMA breakouts struggled right at that May, 2021 low. So, if the S&P 500 manages to close above all this resistance, the index will be in “full bull” mode. Note well that 200DMA breakouts last February and March were major fakeouts.
The 2-day gain was small, but it was enough to blow up my CPI trade. Plunging volatility helped to leave my S&P 500 put spread essentially worthless.
")
The NASDAQ (COMPQ) still has a lot of work ahead. However, the tech-laden index is off to a good restart with a confirmed 50DMA (red line) breakout. Last month’s new lows put a messy stain on the NASDAQ’s trading action. Accordingly, the NASDAQ remains suspect until it can clear its 200DMA. The last close above this long-term resistance was exactly a year ago.
")
The iShares Russell 2000 ETF (IWM) has the strongest momentum of the major indices. Ever since breaking out above its 20DMA (dashed line), buyers have pushed IWM nearly straight up. IWM not only has a confirmed 200DMA breakout on the books, but also IWM is challenging the double peak from the November and December highs. IWM even looks poised to challenge its bear market line.
")
Stock Market Volatility
The volatility index (VIX) has been a bit of a mystery since its December high. Through it all, the VIX’s 50DMA held firm as resistance and guided it into Friday’s breakdown. The VIX now sits at a 52-week low and definitely confirmed the market’s growing bullish sentiment. While this increasing complacency seems to contradict expectations for an imminent recession, at least put protection is now relatively cheap.
")
The Short-Term Trading Call With Overbought and a Bullish Case
- AT50 (MMFI) = 72.3% of stocks are trading above their respective 50-day moving averages (overbought)
- AT200 (MMTH) = 53.1% of stocks are trading above their respective 200-day moving averages
- Short-term Trading Call: neutral
AT50 (MMFI), the percentage of stocks trading above their respective 50DMAs, closed in overbought territory (above 70%) for the second straight day. The overbought trading conditions flipped me from cautiously bearish to neutral. As a reminder, overbought conditions are not by themselves bearish and instead can confirm the strength in the market’s buying power. The bearish signal comes after the end of overbought trading.
The previous bear cycle started with the failure of AT50 at the overbought threshold. Good economic news sent the market into a pre-Christmas sell-off. The sell-off hit a bottom with AT50 at “close enough to oversold” levels. The bear cycle technically ended with bad economic news the previous Friday, but I retained the cautiously bearish short-term trading call. I wanted to be mentally ready to make bearish trades at the overbought threshold. However, good inflation news sealed the deal for a bullish bias in the market. So, ironically, I now need to prepare to trade on the bullish side of neutral!
The Australian dollar vs the Japanese yen (AUD/JPY) stands out as the big stick in the eye of the market’s growing bullishness. My favorite forex indicator of sentiment failed perfectly at 50DMA resistance. AUD/JPY sold off sharply the last two days as the stock market rallied. I suspect the fresh sell-off in the U.S. dollar (DXY) distorted the AUD/JPY signal with traders trading in dollars for yen. Traders have tended to reverse sharp sell-offs in AUD/JPY, and I expect the same here. Accordingly, I bought a small position. I also took profits on Invesco CurrencyShares Japanese Yen Trust (FXY) while keeping a FXY call spread in play (for background see “FXY: Japan Looks Set To Outperform In 2023“).
")
When I described the market’s path of least resistance as pointing upward, I pointed to Caterpillar Inc (CAT) as a trading exception to my bearishness. CAT definitively broke out on Friday, January 6th and effectively led the way for the market’s bullish push. Buyers have convincingly followed through with 4 straight up days. It is hard to stay bearish on the market with CAT ripping higher like this! I do not understand the excitement over CAT, but I sure do not want to fight it.
")
All sorts of meme and formerly dead stocks ran sky high last week. So, I am more curious about and even interested in familiar names which may have some residual juice to squeeze for a sustained bullish mood in the market. Twilio Inc (TWLO) confirmed a 50DMA breakout last week. I like buying TWLO after a close at a post-earnings high. At that point, I would speculate on a complete reversal of the post-earnings loss.
")
I earlier identified the VanEck Semiconductor ETF (SMH) as my new way to hedge bullishness. If I start to make more bullish trades, I will look to backstop myself with SMH puts. Interestingly, CNBC’s Options Action caught on to this idea as well in Friday’s show. Kevin Kelly from Kelly Intelligence proposed a meaty put spread at May $225/$195. In the meantime, SMH is in a bullish position with a confirmed 200DMA breakout. SMH is also challenging its previous peak.
")
And then there is Apple (AAPL). Surprisingly, AAPL remains well below its 50DMA even as AT50 indicates over 70% of stocks trade above their respective 50DMAs. So imagine how much higher the market can go if AAPL gets serious about challenging its 50DMA resistance. A 50DMA breakout on AAPL would be a major victory for the bulls in the middle of overbought trading conditions.
")
")
")
Source for charts unless otherwise noted: TradingView.com
Full disclosure: long QQQ put spread, long FXY call spread, long AUD/JPY
FOLLOW Dr. Duru’s commentary on financial markets via StockTwits, Twitter, and even Instagram!
*Charting notes: Stock prices are not adjusted for dividends. Candlestick charts use hollow bodies: open candles indicate a close higher than the open, filled candles indicate an open higher than the close.
What’s going to wake up VIX is a new kind of US government shutdown: one with no visible path to resolution. Historically, debt limit confrontations have consistently caused violent short-term market moves – and in 2011 resulted in S&P permanently downgrading the U.S. credit rating. This time, the U.S. House is set up for a literally interminable shutdown: the debt limit “no” votes demanded the elimination of the Speaker’s ability to negotiate an end to debt limit impasses as a condition of electing him.
Yellen says we’ll hit the debt limit this Thursday, whereupon she will have to start taking extraordinary actions to keep the government running. She expects the US to default on its debt as early as June.
Crucially, there is no consensus among Republicans regarding what to demand to end a shutdown. There is an extensive discussion of the ramifications here:
https://www.washingtonpost.com/us-policy/2023/01/13/debt-ceiling-gop-plan/
With the market in the land of complacency again, I think the prevailing market expectation is that the latest debt ceiling circus will get resolved just like all the others. The market may not wake up to any contrary realities until May or even June if the Fed has become more market-friendly by May.