Stock Market Commentary:
Revisions to the report on GDP (gross domestic product) typically do not generate reactions in the financial markets, especially the third revision. So I completely look past the third revision to Q3 GDP when I concluded the path of least resistance offered a reprieve. The revision revealed economic conditions were even better than previously reported, and the stock market practically freaked out. In an inflationary environment with a hawkish Fed, the stock market treated this good economic news as awful news (for a fresh explainer, see “Why Wall Street Wants A Recession“). Buyers shook off their stupor as the NASDAQ tested important lows. Gains on Friday and a plunge in the VIX offer fresh hope and a second chance for a path of least resistance pointing upward.
Perhaps most importantly, last week delivered the largest ever weekly outflows from equity funds. If anything can clear out a second chance for an upward pointing path of least resistance, the exhaustion of sellers can certainly do it. This airpocket of selling could even carry holiday cheer into early January before the prevailing bearish winds blow again.
The Stock Market Indices
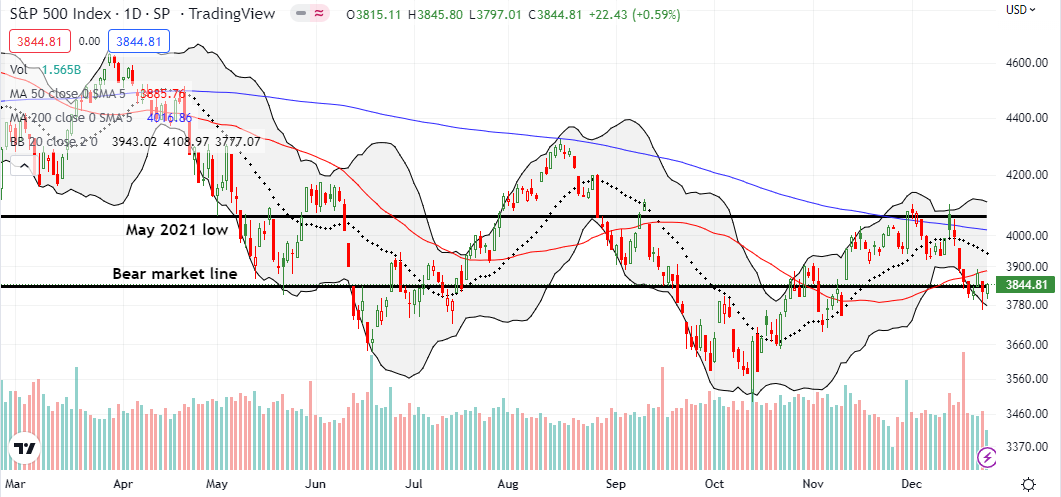
The S&P 500 (SPY) essentially ended the week with a flat performance. In between the bookends, the index swung around its bear market line with plenty of drama. Wednesday’s rally to resistance at the 50-day moving average (DMA) (the red line below) looked like a move up the path of least resistance. Thursday’s good economic news initially took the S&P 500 down a whopping 2.9%. The path of least resistance woke up from there and lowered the day’s loss to 1.5%. Friday’s 0.6% gain offered holiday hopes for a fresh challenge of 50DMA resistance.
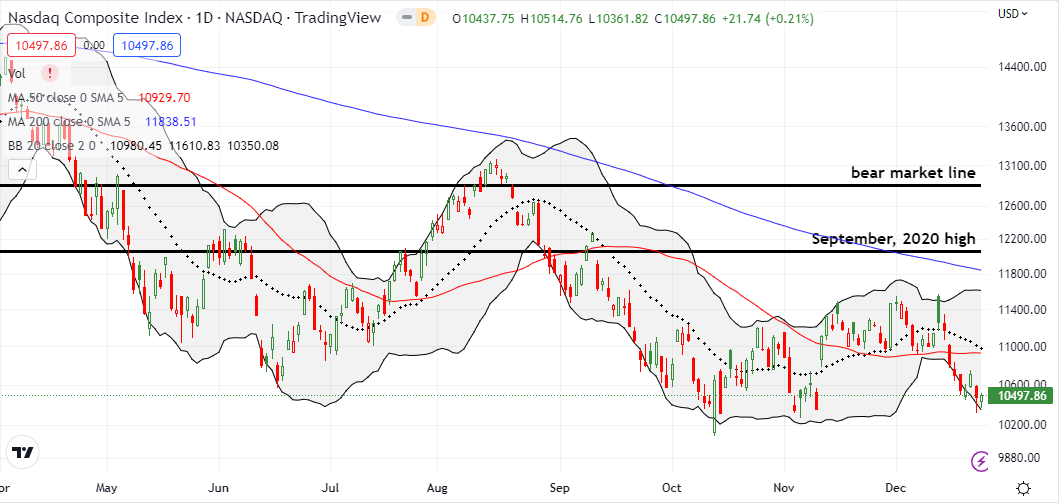
The NASDAQ (COMPQ) tested the closing lows of October and November before the path of least resistance opened up again to the upside. The tech-laden index ended the week with a 1.9% loss. Accordingly, I think the NASDAQ remains at risk for breaking down to new lows. Still, I took profits on my QQQ put spread and will look to fade any rally into converging resistance from the 20DMA (dotted line) and 50DMA.
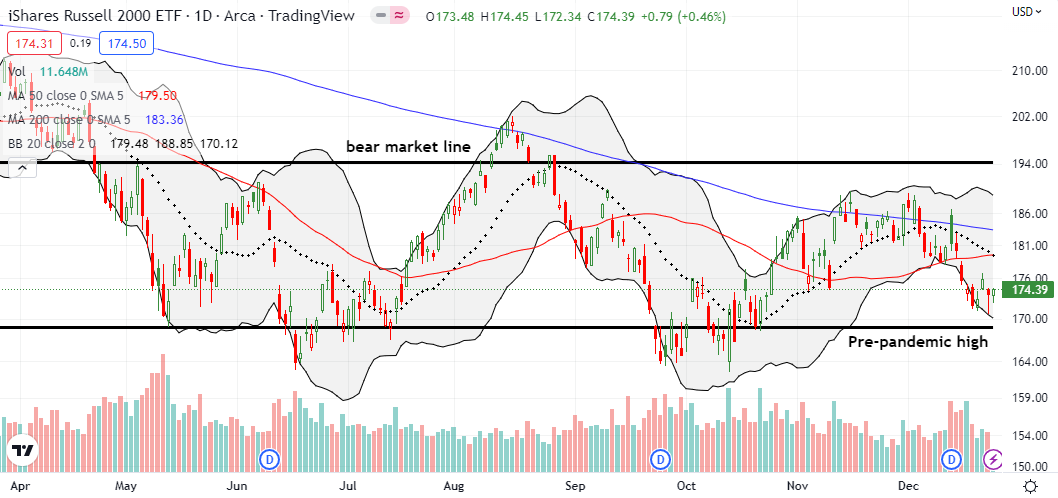
The iShares Russell 2000 ETF (IWM) churned above support from its pre-pandemic high. I am surprised sellers failed to press the issue all the way down to support. Like the S&P 500, IWM ended the week with a flat performance. The short side of my IWM calendar put spread expired worthless as hoped and now I will ride a Jan $170 put the rest of the way.
Stock Market Volatility
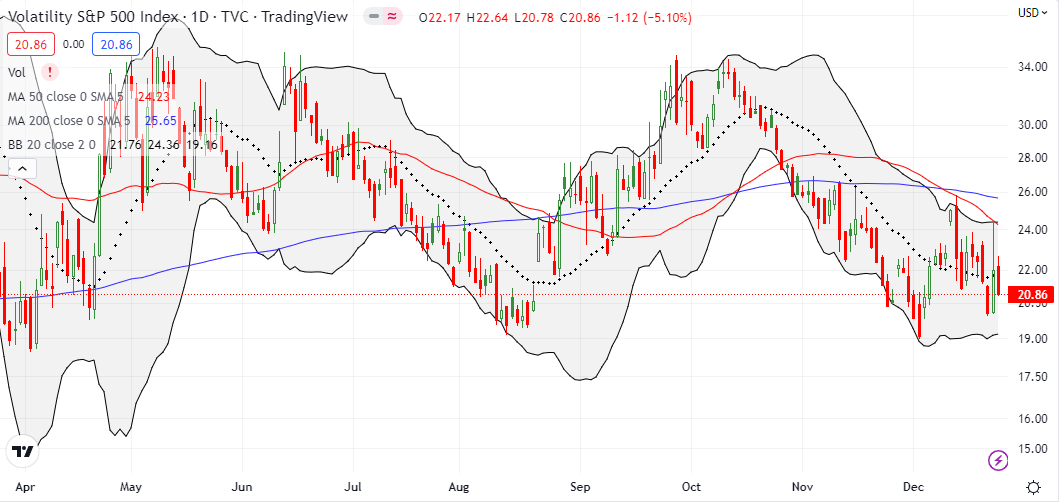
The volatility index (VIX) successfully defended the important 20 level as support. However, it lost ground 4 of 5 trading days. On Thursday, the VIX soared past 24 before faders pushed the VIX back to 22. The wild behavior of the VIX sent me to Bill Luby of VIXandMore with questions. I plainly asked “what’s going on?”
“0dte” and “1dte” stand for “0 days to expiration” and “1 day to expiration.” In other words, retail options traders are speculating wildly. As a result, the VIX is exhibiting some strange behavior as it less effectively reflects fundamental market sentiment.
The Short-Term Trading Call With the Path of Least Resistance
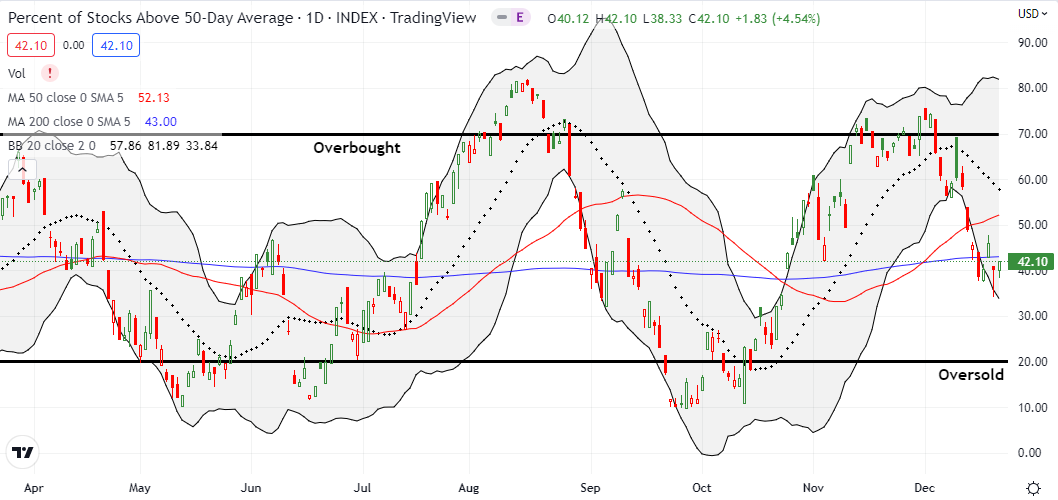
- AT50 (MMFI) = 42.1% of stocks are trading above their respective 50-day moving averages
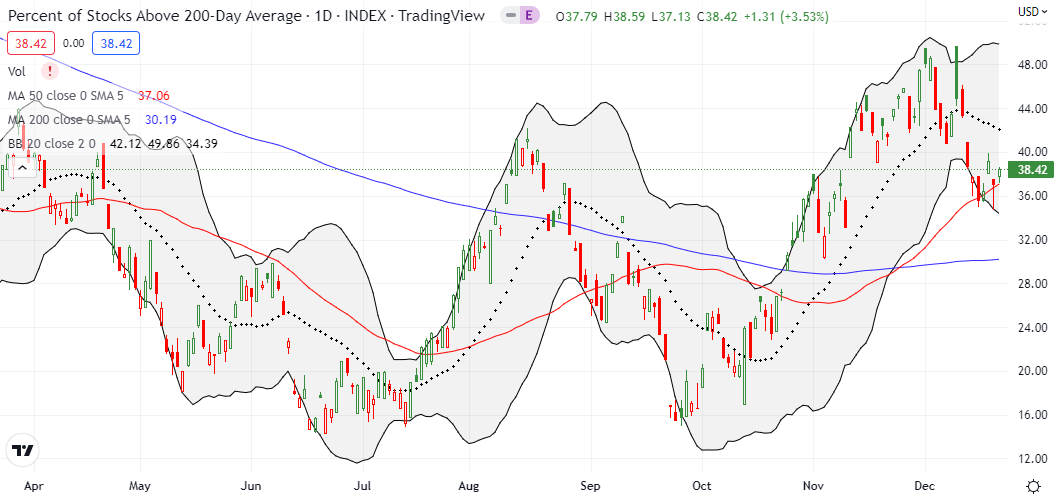
- AT200 (MMTH) = 38.4% of stocks are trading above their respective 200-day moving averages
- Short-term Trading Call: cautiously bearish
AT50 (MMFI), the percentage of stocks trading above their respective 50DMAs, churned with the stock market. My favorite technical indicator fell as low as a 2-month low before rebounding by Friday to a 3.5 percentage point loss for the week. At 34%, the AT50 lows got to “close enough to oversold” territory. Accordingly, I am not pressing bearish bets here…even with market dynamics structured in favor of the bears. As a reminder, I am not downshifting to neutral as I want to be mentally prepared to fade the market sometime in early January.
The next three stock charts show some positive signs in the stock market.
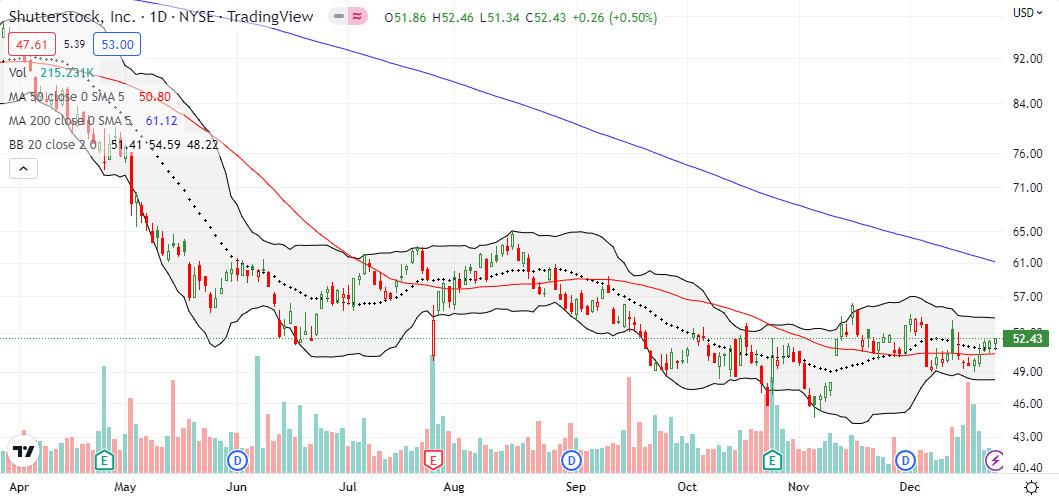
Shutterstock, Inc. (SSTK), an image services company, is showing resilience with a 3-month consolidation period to-date. Since the previous 4-month consolidation period failed to generate a bullish breakout, there is no need here to try to get ahead of a potential upward move. Still, I have this stock on my watchlist as further downside risks seem small. SSTK has an attractive 2.4 price/sales valuation.
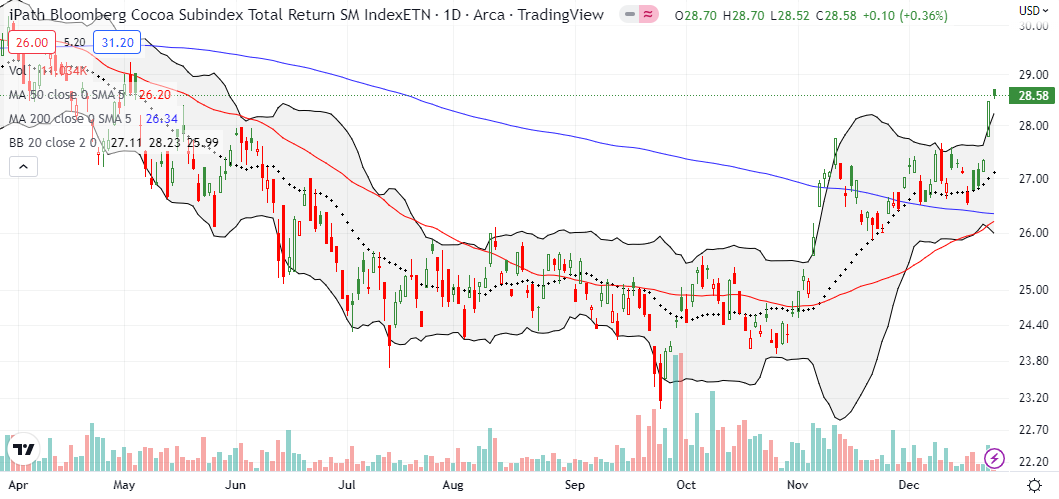
I have not written about cocoa in a long time. The price action has been relatively mute and tightly rangebound since 2018. Still, as a cocoa permabull, I accumulated iPath Bloomberg Cocoa Subindex Total Return(SM) ETN (NIB) on the pullback starting in May. I watched carefully after November’s bullish 200DMA breakout and decided to take profits on last week’s big breakout. As a reminder, I buy dips and sell rallies in NIB given the largely rangebound trading for years. Now, I am back to buy-the-dip mode. It is also time to more closely track cocoa news.
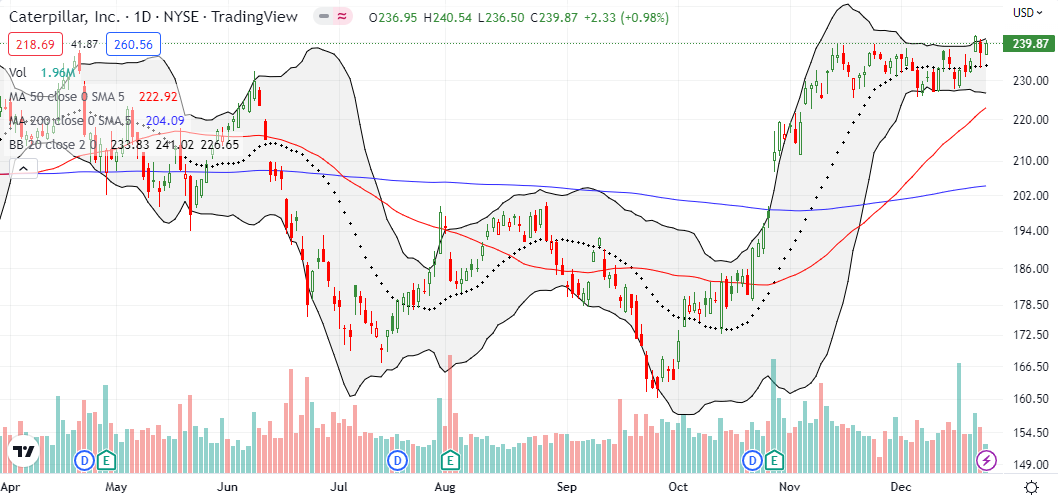
I early mentioned Caterpillar as an important breakout/breakdown candidate. CAT broke out Wednesday during the market rally. The disappointment over the GDP revision ended the breakout. However, buyers showed some life on the rebound from 20DMA support. Friday’s 1.0% gain holds out the possibility of holiday cheer with a breakout. On a confirmed breakout, I will put my bearishness on pause long enough to give CAT call options a chance.
Be careful out there!
Footnotes
“Above the 50” (AT50) uses the percentage of stocks trading above their respective 50-day moving averages (DMAs) to measure breadth in the stock market. Breadth defines the distribution of participation in a rally or sell-off. As a result, AT50 identifies extremes in market sentiment that are likely to reverse. Above the 50 is my alternative name for “MMFI” which is a symbol TradingView.com and other chart vendors use for this breadth indicator. Learn more about AT50 on my Market Breadth Resource Page. AT200, or MMTH, measures the percentage of stocks trading above their respective 200DMAs.
Active AT50 (MMFI) periods: Day #49 over 20%, Day #45 over 30%, Day #4 over 40% (overperiod), Day #7 under 50% (underperiod), Day #13 under 60%, Day #15 under 70%
Source for charts unless otherwise noted: TradingView.com
Full disclosure: long IWM put, long SPY calendar call spread
FOLLOW Dr. Duru’s commentary on financial markets via StockTwits, Twitter, and even Instagram!
*Charting notes: Stock prices are not adjusted for dividends. Candlestick charts use hollow bodies: open candles indicate a close higher than the open, filled candles indicate an open higher than the close.


